Fibre-generated point processes and fields of orientations
This paper introduces a new approach to analyzing spatial point data clustered along or around a system of curves or "fibres." Such data arise in catalogues of galaxy locations, recorded locations of earthquakes, aerial images of minefields and pore …
Authors: Bryony J. Hill, Wilfrid S. Kendall, Elke Th"onnes
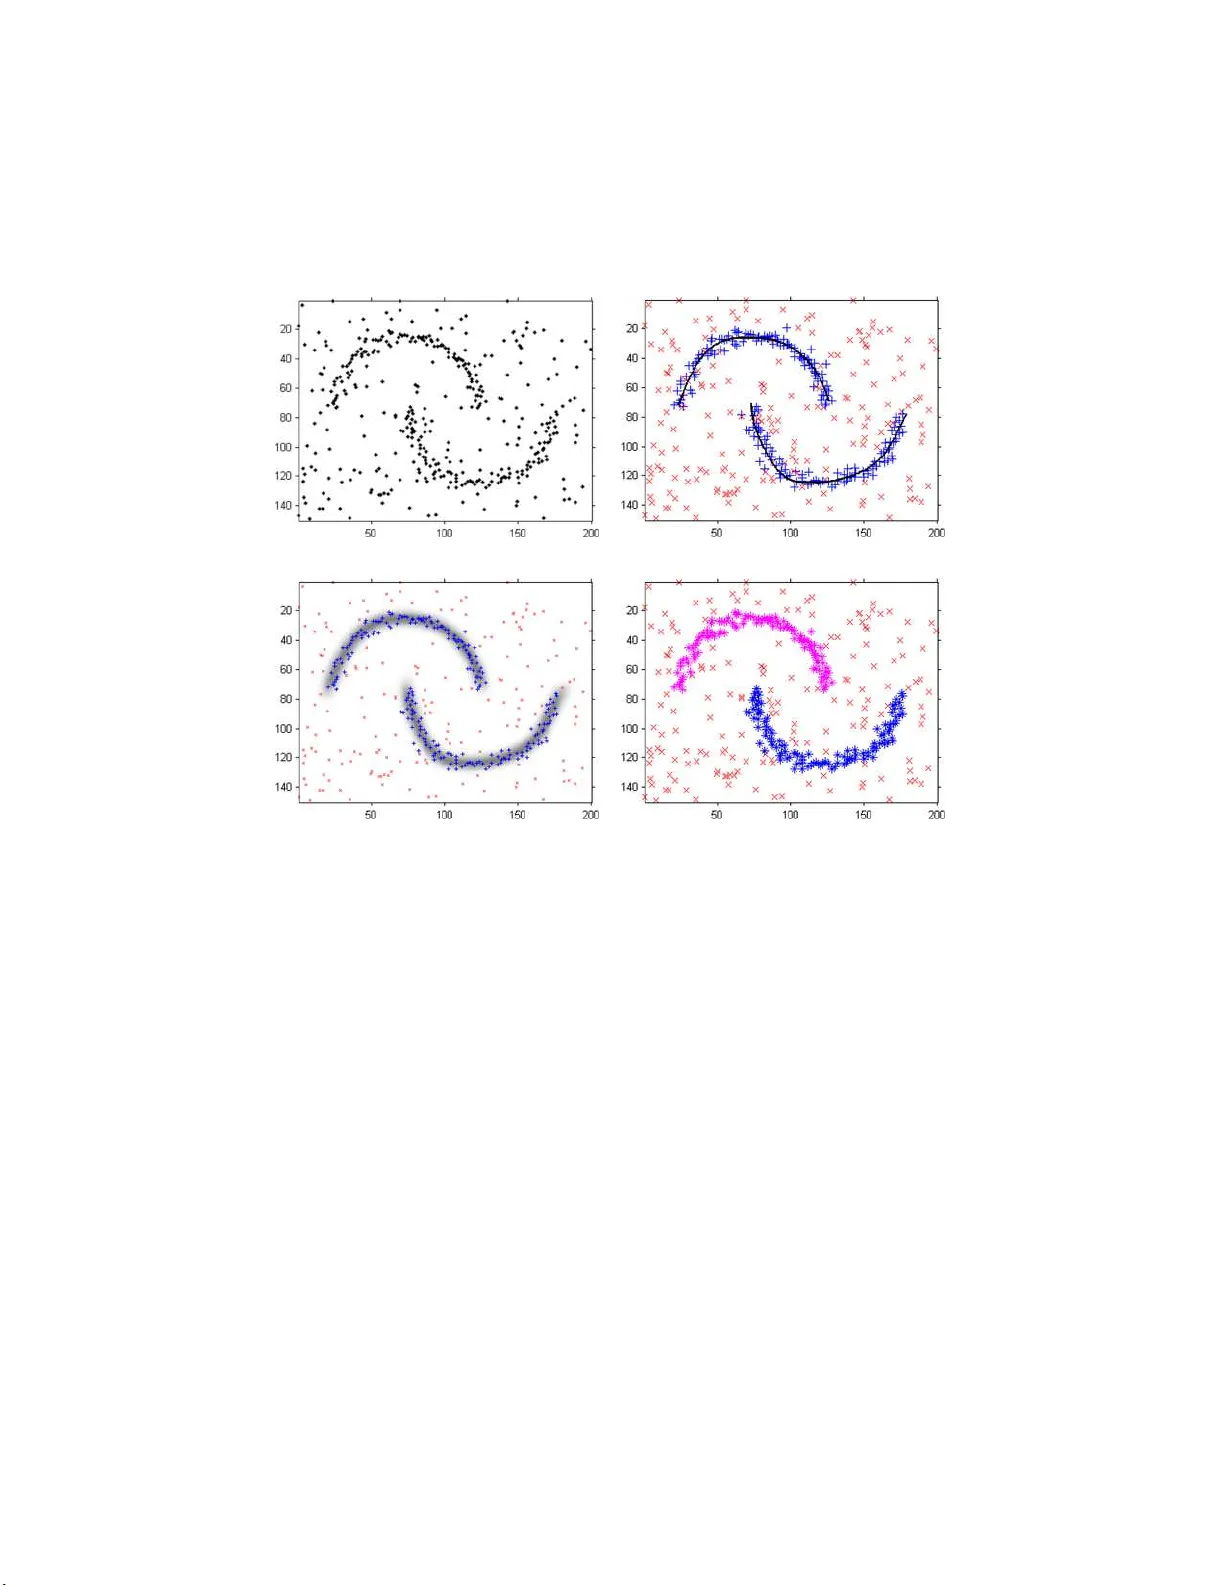
The Annals of Applie d Statistics 2012, V ol. 6, No. 3, 994–1020 DOI: 10.1214 /12-A OAS553 c Institute of Mathematical Statistics , 2 012 FIBRE-GENERA TED POINT PROCESSES AND FIELDS OF ORIENT A TIONS By Br yony J . Hill, Wilfrid S. Kendall and E lke Th ¨ onnes University of Warwick This pap er introduces a new approac h to analyzing spatial p oint data clustered along or around a system of curv es or “fibres.” Such data arise in catalogues of galaxy locations, recorded locations of earthquakes, aerial images of minefields and p ore patterns on fi nger- prints. Finding the underlying cu rvilinear structure of these p oin t- pattern d ata sets may not only facilitate a b etter und erstanding of how they aris e but also aid reconstruction of miss ing data. W e b ase the space of fibres on the se t of integra l lines of an orien tation field. Using an empirical Bay es approac h, we estimate th e field of orien- tations from anisotropic features of the data. W e th en sample from the p osterior distribution of fi bres, exploring mo dels with different num b ers of clusters, fitting fibres to t h e clusters as w e proceed. The Ba yesian approac h p ermits inference on v arious p roperties of the clus- ters and a ssociated fibres, and the results perform w ell on a num b er of very d ifferen t curvilinear struct u res. 1. Int ro duction. In th is p ap er we introd uce a new empirical Ba yes ap- proac h concerning p oin t pro cesses that are clustered along curve s or “fibres,” with add itional bac kground noise. In nature suc h p oint p atterns often arise when ev ents o ccur near some laten t curvilinear generating feature. F or example, earthquakes arise around seismic faults whic h lie on the b oun daries of tectonic p lates and hence are naturally cur vilinear. Similarly , sw eat p ores in fingerprints lie on th e ridges of the finger, wh ich p ossess a curvilinear stru cture. Figure 1 presents these data together with tw o s im ulated examples of p oint patterns clustered around un- derlying families of cur v es with additional b ac kground n oise. Identificat ion of cu r vilinear elements and elucidation of their relationship with the p oint data is both an in teresting theoretical pr oblem and a usefu l to ol for ga in ing Received Sep tem b er 2011; revised F ebru ary 2012. Key wor ds and phr ases. Mark ov chain Monte Carlo, spatial b irth–death process, earth- quakes, empirical Ba yes, fibre pro cesses, fi eld of orien tations, fingerprints, spatial p oint processes, tensor fields. This is an electronic reprint of the or iginal ar ticle publis he d by the Institute of Ma thematical Statistics in The Annals of Applie d St atistics , 2012, V ol. 6, No. 3, 99 4–102 0 . This r eprint differs from the or iginal in paginatio n and t yp ogra phic detail. 1 2 B. J. HILL, W . S. KENDALL A N D E. TH ¨ ONNES (a) (b) (c) (d) Fig. 1. F our ex amples of p oint p atterns cluster e d ar ound latent curviline ar fe atur es with b ackgr ound noise. (a) Simul ate d p oint p attern. (b) Simulate d p oint p attern describ e d in Stanfor d and R aftery ( 2000 ). (c) Earthquake epic enters in the New Madrid r e gi on. Data is taken fr om CERI (Center for Earthquake R ese ar ch and Information). (d ) Por es along ridges of a p ortion of the fingerprint a002–05 fr om the NIST Sp ecial Database 30 [Watson ( 2001 )]. understand ing of the origins of the data. It also pro vides a tec hn ique for reconstruction of missing data. The mo d el introdu ced here describ es families of nonint ersecting curv es via a field of orienta tions (a map υ FO : W → [0 , π ) assigning an undirected orien tation to eac h p oin t in th e win do w). The curves are pro du ced as seg- men ts of streamlines in tegrating the field of orien tations. W e say th at a curve inte g r ates the field of orienta tions if th e curv e is contin uously differentia b le and of u n it sp eed, and if its tangen t agrees with the field of orien tations at FIBERS, POINT PROCESSES, FIELDS OF ORI ENT A TIO NS 3 eac h p oin t. The term str e amline is used to describ e a curv e wh ic h in tegrates the field of orien tations and has no end p oin ts in th e interior of the windo w W \ ∂ W . W e choose to u se a v arian t on an emp ir ical Ba y es approac h to estimate the field of orienta tions, sin ce a fully Ba y esian approac h w ould inv olv e in finite- dimensional distributions and b e very compu tationally in tensiv e. The em- pirical Ba yes comp onent consists of estimation of the field of orien tations from the data v ia a tensor field as detailed in Section 4.1 . In the follo wing, a tensor field is rep r esen ted b y assignation of a symmetric nonn egativ e def- inite matrix to eac h p oin t of the planar wind o w. T ensor fields of this kind pla y an imp ortan t role in diffusion tensor imaging [DTI, see Le Bihan et al. ( 2001 )]. Th e field of orien tations is constructed simply b y calculating the orien tations of the rep resen tativ e matrices’ principal eigen v ectors; singular- ities in the fi eld of orien tations corresp ond to p oin ts wh ere there is equalit y of th e t wo eigen vect ors. W e show how prop erties of the und erlying distrib ution of fi bres ca n b e estimated using Mont e Carlo tec hniques app lied to the spatial p oin t data. Our approac h has the adv ant age that it can b e used to qu an tify uncertain ty on a range of paramete rs and do es so effe ctiv ely for differen t types of curvi- linear structure. The us e of a field of orienta tions to iden tify fib res leads to a s trong p erform ance on data suc h as that sho w n in Figure 1 (d), wh ere there is noticeable alignmen t of p oin ts p erp end icular to the fi bres. 1.1. Potential applic ations. Poin t patterns with a latent curvilinear struc- ture arise in many different areas of study . In seismology , epicent ers of earthquak es are t ypically den sely clustered around seismic f aults. Th e earthquak e data f rom the New Madr id region as shown in Figure 1 (c) consists of one short dense cluster of p oin ts, one longer rather sparse cluster, b oth connected, and a relativ ely small num b er of “noise” points scattered o v er the win d o w. T he New Madrid earthqu ake data is considered in Stanf ord and Raftery’s ( 2000 ) app roac h to detect ing curvilinear features. In cosmology , gala xies app ear to cluster along in ter-connected filamen ts forming a three-dimensional web-li k e structure with large v oids b et wee n the filamen ts. There is in terest in iden tifying the nature of the filamen ts [see, e.g., S toica, Mart ´ ınez and Saar ( 2007 )]. Th ere is also evid en ce that these galaxies form surf aces or “w alls” in some regions. This suggests the exciting c hallenge of extending our mo d el to includ e t wo -dimensional s urfaces in three-dimensional s pace. A f u rther application is that of sweat p ore patterns on fingerprint ridges [see Figure 1 (d)]. Swe at p ores are tin y ap ertures along the ridges where the ducts of the sw eat glands op en. Robust inference of the ridge structure from the p ore p attern has p otenti al for aiding r econstruction of patc h y finger- 4 B. J. HILL, W . S. KENDALL A N D E. TH ¨ ONNES prints and ma y also allo w for more efficien t storage of fin gerprin ts in v ery large databases. The u nderlying curve s tr ucture is a d en se set of lo cally par- allel cur v es along whic h pores are located, usually v ery close to the center of the r idges. The noise arises mostly fr om artifacts in the automatic extraction of p ores from th e image. An issue with fingerprint p ore data is that p ores usually align across the r idges as w ell as along them. This can complicate the reconstruction of ridges, as the dominan t orien tation is less clear. W e ov ercome this issu e by constructing a smo oth tensor field whic h extrap olates dominant orien tation estimates ov er the r egions of directional ambiguit y . 1.2. Backgr ound. An existing metho d of estimati ng the curves in the underlying structure of a p oint p r o cess is Stanford and Raftery’s ( 2000 ) use of prin cipal curv es (a n onlinear generaliza tion of the fir st principal comp o- nen t line). An EM-algorithm is us ed to optimize the model o v er a v ariet y of c hoices of smo othness parameter and num b er of comp onent s. An optimal c hoice of smo othness and n umb er of comp onen ts is th en selected us ing Ba y es factors. This tec hniqu e generally p erform s very w ell; how ev er, it is sensitiv e to the initial c lustering of the d ata and therefore has difficulties reconstruct- ing fibres in some regions where fibres ma y b e expected but signal points are absent [e.g., the fin gerprint p ore data—Figure 1 (d)]. A piecewise linear “Candy m o del” (or “Bisous mo del” in three d imen- sions) is used b y Stoica, Mart ´ ınez and Saar ( 2007 ) to mo del fi lamen ts in galaxy data. Th ey compare the emp irical densities of galaxies within concen- tric cylinders and th u s d elineate these filamen ts. This approac h is restricted to piecewise linear fi bre mo dels w here the d eviation of p oin ts from fib res follo ws a uniform distribution o v er a thin cylinder cen tered along the fib re. Sufficient statistics of the mo del for data with filamen tary structure are then compared to sufficient statistics on structur eless d ata s ets; see Stoica et al. ( 2005 ) and Stoica, Mart ´ ınez and Saar ( 200 7 , 2010 ). Densit y estimates of the p oin t pattern can b e obtained u sing techniques suc h as kernel smo othing. Fibr es can b e directly estimated from th is density; an example of this can b e s een in Genov ese et al. ( 2009 ) wh ere steep est ascen t paths along the densit y estimate are constructed and the density of these paths is analyzed. A fu rther approac h discussed in Barro w, Bha vsar and Sono da ( 1985 ) is based on construction of the min imal spanning tree of the set of p oints. In three d imensions this giv es a useful in sigh t in to the o v erall c h aracteristics o f the fi lamen tary structure. The method presented in August and Z uc ker ( 2003 ) is based on a ran- dom curv e mo del in whic h curv ature is d efined as a Bro wnian motion. The resulting mo del is used to en h ance co n tours in the output of edge op erators applied to digital images and th us to d ata in whic h signal p oint s are d ense along cu rvilinear structur es. FIBERS, POINT PROCESSES, FIELDS OF ORI ENT A TIO NS 5 The tr eatmen t adv o cated h ere is also b ased on the formulatio n of a general mo del for families of curv es and the p oin t p atterns clustered around them. In cont rast to August and Zuc ke r ( 2003 ), cur ves are mo deled as segmen ts of streamlines in tegrating a smo oth field of orienta tions whic h encourages in terp olations o ver areas of missing data. Th e prior mo del for the orien tation field is deriv ed via an empirical Bay es step. T hen birth–death MCMC is used to sample f rom the p osterior distrib ution of the fibres. The mo del form u lation itself uses the initial explorato r y work of Su et al. ( 2008 ) [see also Su ( 2009 )], wh ic h focu sed on the fi ngerprint p ore data and describ ed the use of tensor fields for estimating dominant orien tations in spatial p oint data. 1.3. Pr oblem definition. In particular, w e are in terested in mo deling a ran- dom p oint pr o cess Π viewed in a planar windo w W ⊂ R 2 ; w e wr ite th e ob- serv ed part of the p oint p ro cess as W ∩ Π = { y 1 , . . . , y m } for some arbitrary ordering of p oin ts. The p oint pro cess arises from a mixture o f homogeneous bac kground noise and an unknown n umber of p oin t clusters, eac h clustered along a curve, henceforth called a fibre. Th u s a fibre is a one-dimensional ob ject, a s m o oth curv ed segmen t, em b edded in a higher-dimensional space (the space contai ning the p oint pro cess). Rand om sets of fibres or “fibr e pro- cesses” are discussed in Sto ya n , Kendall and Mec ke ( 1995 ) and Illian et al. ( 2008 ). Ha ving sp ecified an app ropriate mo del, we m ust identi fy a s u itable metho d of analysis of the p osterior distribution of fi b res giv en a d ata set of spatial p oin t lo cations { y 1 , . . . , y m } o v er the wind o w W . 1.4. Plan of p ap er. Th e p ap er is laid out as follo ws. The follo wing section giv es an o v erview of the model prop osed in this pap er . Deta ils of the under- lying probabilit y mo del are giv en in Section 3 . The emp irical Ba yes metho d of estimating an approp r iate field of orien tations is outlined in Section 4 . Section 5 presents a metho d of samp lin g from the p osterior distrib u tion of the fi bres giv en the p oin t pattern d ata using Mon te Carlo metho ds . This is implemen ted f or a n umb er of examples in Section 6 . In the final section we compare this mo del to other approac hes, discus s some kno wn issues of im- plemen tation and statistical analysis, and note p ossible directions in w hic h this mo del migh t b e extended. 2. Basic co nsiderations. W e use a Ba y esian hierarc hical mo del to de- scrib e the relationship b et ween the p oin ts and the fib res. 2.1. Points. A n atural c h oice is to mo del the spatial p oin t pro cess as a mixed P oisson pro cess or “Co x pro cess” driv en b y a random fibre pro cess. By this w e mean that the p oints arise in dep endently and are asso ciated in some w ay with a random fibre—t yp ically clustered around it. Su c h a p oin t pro cess is called a “fibre-pro cess generated Cox pr o cess;” see Illian et al. ( 2008 ). 6 B. J. HILL, W . S. KENDALL A N D E. TH ¨ ONNES Fig. 2. An orientation field is depicte d as thin gr ey lines. A fibr e F ( ω, l 1 , l 2 ) is define d as the curve se gment that inte gr ates the orientation field fr om r efer enc e p oint ω ∈ W in one dir e ction to a distanc e l 1 and in the other dir e ction to a di stanc e l 2 . R e c al l, a curve se gment is said t o i nte gr ate the orientation field i f at any p oint of the se gment its tangent agr e es with th e orientation field. In our mo del w e do associate p oin ts with particular fibr es b ut w e remo ve the P oissonian c haracter of the distrib u tion of p oints alo ng fibres, replacing this b y a renew al pro cess based on Gamma d istributions for in terp oin t dis- tances. This allo ws us to model a tendency to regularit y in the w ay in which p oin ts are distributed along a fibre but includes the Po issonian case with exp onent ially d istributed inte rp oint distances. 2.2. Fibr es. In co n trast to previous w ork, in w h ic h curv es are often con- structed as splines fitted to the d ata, we defin e them as in tegral curves of a field of orienta tions. This means that at any p oin t on a fib r e, the tangent to the fibre agrees with the fi eld of orientat ions at that p oin t. Note that a field of orien tations is equiv alen t to a vec tor field except that eac h p oin t in the field is assigned a dir e ctionless orientati on. An instance of a rand om fi eld of orien tations Υ FO is written as υ FO : W → [0 , π ) , w here [0 , π ) represen ts the space of planar d irections (with 0 and π id en tified). The simplest w a y to determine a fibre F is to c ho ose a reference p oin t ω ∈ W on the fibre and sp ecify the tw o arc lengths l 1 , l 2 ∈ R + of F \ { ω } ; see Figure 2 . F or a fixed field of orien tations this will charac terize a fi- bre, although the parametrization by reference p oin t an d lengt h is eviden tly not u nique. W e mo del the fibres in terms of these parameters (the refer- ence p oints, arc lengths an d field of orien tations). Note that an alternativ e construction can b e based on random selecti on of a finite num b er of fi- bres generated by decomp osing the streamlines according to Po isson p oint pro cesses distributed along th e streamlines; ho wev er , this construction in - tro duces int riguing measure-theoretic issues w h ic h are out of place in the present treatmen t. FIBERS, POINT PROCESSES, FIELDS OF ORI ENT A TIO NS 7 W e note that taking the reference p oin ts to b e uniformly d istributed ov er the windo w W will lea d to a bias in the distribution of fi bres in that the mean length of fibr e p er u nit area is not constan t across W . T his issue has b een considered and a solution in vo lving an adjustment to the distribution of reference p oin ts h as b een identified. W e hav e not applied the bias correction to our examples, as there is sufficient data to mak e the b ias negligible. The field of orienta tions is a u seful intermediary in constru cting fi bres and, as such, is part of a usefu l deco mp osition of the construction problem. In practice, we seek to iden tify a suitable field of orienta tions by analysis of prop erties of the d ata. 2.3. Noise. Finally , we includ e bac kground noise in the form of an inde- p endent homogeneous P oisson pro cess sup erimp osed on to the fibr e-generated “signal” p oin t pro cess. 3. Probabilit y mo del. A d ir ected acycl ic graph (or D A G) sho win g the conditional dep endencies for the m o del is sho wn in Figure 3 . A go o d intro- duction to directed acyclic graphs is giv en by Pe arl ( 1988 ). 3.1. Fibr es. Henceforth let F = { F 1 , . . . , F k } denote k ran d om fibres. As outlined earlier and illustrated in Figure 2 , the fibre F j is determined b y a reference p oin t ω j and arc lengths l j, 1 , l j, 2 . It is also w ritten F j = F j ( ω j , l j , ν FO ) [where l j = ( l j, 1 , l j, 2 )] to indicate th at it is a deterministic func- tion of ω j and l j once ν FO is giv en . F or the list of reference p oin ts we write ω = { ω 1 , . . . , ω k } , and the arc length vecto rs are giv en b y l = { l 1 , . . . , l k } . W e use l j,T = l j, 1 + l j, 2 as a sh orth and for the total arc length of the j th fi- bre. No te that in general the orienta tion fi eld υ FO ma y p ossess singularities, whic h would constrain the c h oice of the lengt hs l j = ( l j, 1 , l j, 2 ); ho w ever, this do es not arise in our examples. 3.2. Signal p oints. P oints f rom the observe d pattern ma y b e either signal or noise. Signal p oints are typica lly clustered around fi bres. The m o del we use assig ns an anc h or p oin t p i on s ome fib r e to eac h data p oin t y i . T h e data p oin t is then displaced fr om p i b y an iso tropic biv ariate normal d istribution [i.e., y i ∼ MVN ( p i , σ 2 disp I 2 ), where I 2 is the 2 × 2 iden tity matrix]. The fibre on wh ic h p i is lo cated is d etermined b y an auxiliary v ariable X i , so X i = j if and only if p i ∈ F j . Th e p i ’s on th e j th fi bre are spaced such that the ve ctor of arc-length distances betw een adj acent p oint s is prop ortional to a Diric hlet distributed random v ariable. S etting an appropriate parameter for the Diric hlet d istribution will encourage p oin ts to b e either ev enly sp read, clustered along the fi bre, or placed indep end en tly at rand om along the fibre. The probabilit y that p oin t y i is a llo cated to the j th fibre ( X i = j ) is prop ortional to the to tal length of fibre F j . This ensures that the mean p oin ts p er unit streamline remains appro ximately constan t. 8 B. J. HILL, W . S. KENDALL A N D E. TH ¨ ONNES Fig. 3. Dir e cte d acyclic gr aph (D A G) of mo del: arr ows indic ate c onditional dep endencies, elements in squar es ar e deterministic al ly c alculate d or c onstant, while those i n cir cles ar e r andom variables. F or simplicity we have not include d r ef er enc e to hyp erp ar ameters λ , κ , η , α signal and β signal . 3.3. Noise p oints. Noise is then added as a homoge neous P oisson pro- cess. Th is is in cluded in the mo del by first allocating eac h p oint y i to noise or s ignal (stored in auxiliary v ariable Z i = 1 or 0 for signal or noise, resp.). P oint y i is allo cated to signal ind ep endently of the allocations of all other p oin ts. The prior probabilit y that y i is allocated to signal is give n by ε i . If the p oin t is signal, then its lo cation is distributed as outlined in the p revious subsection. Otherw ise, if the p oin t is n oise, it is distributed uniformly across the w indo w W . 3.4. T otal numb er of p oints. The total num b er of p oint s m is assumed to b e Poisson distributed. The m ean to tal n umb er of p oints µ total is defined to b e equal to some fu nction of µ signal , the mean num b er of signal p oin ts, and ρ , a parameter go v ern ing the num b er of noise p oin ts. F or the sak e of simplicit y w e set ρ to be the prior assump tion on the prop ortion of the to tal p oin ts th at are n oise p oin ts and define µ total = µ signal / (1 − ρ ). The mean FIBERS, POINT PROCESSES, FIELDS OF ORI ENT A TIO NS 9 n u m b er of s ignal p oint s µ signal is assumed to b e prop ortional to the total sum of the fibre arc lengths. Hence, m is assumed to b e P oisson distribu ted with mean µ total = k X j = 1 ( l j,T ) ! η 1 − ρ , (1) where ρ = β signal / ( α signal + β signal ) is th e prior estimate of the prop ortion of p oin ts th at are signal and η is a densit y parameter. The assumption that the mean num b er of noise p oints is p rop ortional to the mean total num b er of p oints (and the fib re length) is particularly w ell suited to the fingerprin t example [see Section 6.3 ], where n oise p oin ts arise as artifacts of the p ore detection pro cess along the fin gerprint ridges. Implemen tation of alternativ e relationships b et ween the mean num b er of signal and noise p oin ts w ould b e a straigh tforward m atter. 3.5. Priors. In the examples given in the n ext Section 6 w e use the follo wing priors: P ( l | k , λ ) = k Y j = 1 P ( l j, 1 | λ ) P ( l j, 2 | λ ) where l j, · ∼ Exp(1 /λ ) , P ( ω | k ) = k Y j = 1 P ( ω j ) where ω j ∼ Uniform( W ) , P ( k | κ ) ∼ Po iss on( κ ) , P ( ǫ | α signal , β signal ) = m Y i =1 P ( ǫ i | α signal , β signal ) where ǫ i ∼ Beta ( α signal , β signal ) . Here m is the total num b er of p oints in { y 1 , . . . , y m } . The ab ov e prior mo dels are common, parsimonious choic es that app ear flexible enough for a range of applicatio ns includ ing the examples consid- ered in Section 6 . Ho w ever, if application-sp ecific prior information su ggests alternativ e prior mo dels, then these can b e accommo dated in the pr esen ted framew ork . 3.6. Posterior. W e are int erested in the p osterior distribution of fib res (and v arious other parameters) giv en a particular instance of the p oin t pro- cess. Th is p osterior is give n by π ( F , l , ω , k , υ FO , ǫ , Z , X , p ) = P ( F , l , ω , k , υ FO , ǫ , Z , X , p | y ) 10 B. J. HILL, W . S. KENDALL A N D E. TH ¨ ONNES ∝ P ( F , l , ω , k , υ FO , ǫ , Z , X , p ) (2) × L ( F , l , ω , k , υ FO , ǫ , Z , X , p | y ) = P ( l | k ) P ( ω | k ) P ( k ) P ( υ FO ) P ( ǫ ) P ( Z | ǫ ) × P ( X | Z , l ) P ( p | F , X ) L ( F , l , ω , k , υ FO , ǫ , Z , X , p | y ) . Here P ( · ) in dicates a pr ior d istr ibution. W e omit P ( F | l 1 , l 2 , ω , υ FO ), as it is deterministically calc ulated. Section 5 describ es h o w to sample from this p osterior distrib u tion using Mark o v c hain Mon te Carlo tec hniqu es. 3.7. Computational simplific ations. Comp uter implemen tation makes it necessary to r ep resen t th e field of orientati ons b y a discrete stru cture. W e adopt the s im p le approac h of estimating the field of orientat ions at a dense regular grid of p oints o ver W . In tegral curve s are calculated step wise b y estimating the orien tation at a p oin t by its v alue at the nearest ev aluated grid p oin t and extending the cur v e a small distance in that d irection. Note that the choic e of direction (fr om the tw o av ailable for eac h orient ation) is made so that the angle b et wee n adjacent linear segmen ts is greater than π / 2. Consequent ly , fib res a re stored a s piecewise-li near curves and further cal- culations are p erformed on these approxi mations. Of cour se, this d iscr etiza- tion can b e arbitrarily redu ced (at a compu tational cost) to impro ve the accuracy of the ap p ro ximation. 4. Construction of field of orien tations. W e m ust of course iden tify a m eth- o d for calculating the field of orien tations. It is compu tationally adv an ta- geous to generate a field of orien tations wh ic h is lik ely to con tain (b e int e- grated by) fibr es that fit the data w ell (pro d uce a high lik eliho o d ). The most natural w a y to do this is to base the calculatio n of the field of orien tations on the data, using an empirical Ba ye s tec hniqu e. The use of empirical Ba yes to find the prior for the field of orien tations d istribution means that asp ects of th e prior, or parameters of the prior, are estimated from the data. An alternativ e approac h would b e to u se a fully Ba yesian mo d el, w here w e wo uld treat the field of orien tations as an indep endent random v ari- able Υ FO . W e wo uld then need to iden tify its state space and a corresp ond- ing σ -algebra, transition k ernel and prior on this state space. These could b e deriv ed from r andom field th eory [see, e.g., Adler and T aylo r ( 2007 )], u s ing an appropriate co v ariance function to mainta in smo othn ess in the field of orien tations, ho wev er, there are a n um b er of issues with th is appr oac h. In practice, one ma y exp ect the task of sampling a r an d om field of orien tations to b e computationally exp ensive, particularly if the co v ariance fun ction do es not ha ve a s im p le form (as is likely in this mo del). C alculatio ns relating to the conditional distribution of the field of orientat ions giv en th e fibres are FIBERS, POINT PROCESSES, FIELDS OF ORI ENT A TIO NS 11 lik ely to lead to unfeasible computational complexit y . A further iss u e is that this approac h lea d s to a huge space of p ossible fi bres, resulting in corre- sp ondin g difficulties in ensu ring this space is prop erly explored. Use of the information giv en in the data will help to limit th is space to a m ore easily explorable r estricted class of suitable fields of orien tations. Here we u s e the data to make lo cal orienta tion estimates and smo oth these to prod uce a field of orienta tions estimat or. As we are specifically in terested in orienta tion estimates arising from the signal d ata, we can c ho ose to weigh t the con tribu tion of eac h p oint to the field of orien tations estimator by how lik ely it is to b e noise or signal. Estimation of a fi eld of orien tations giv en that y 1 , . . . , y m are all signal p oin ts is outlined in the follo wing section. Section 4.2 shows how to extend this to tak e acco unt of the information given in the v ector of probabilities that p oin ts are signal ( ε 1 , ε 2 , . . . , ε m ). 4.1. Estimation for al l signal p oints. The mapp ing and tensor metho d describ ed in S u et al. ( 2008 ) [and fu rther d iscussed in Su ( 2009 )] is applied to the p oint pattern to construct a tensor at eac h p oint. T o this we apply a Gaussian k ernel smo othing in th e log-Euclidean metric to construct a ten- sor field. Th e tensor fi eld is r epresen ted by an assignation to eac h p oin t of a 2 × 2 nonnegativ e d efinite matrix whose p rincipal eigenv ector indicates the dominan t orien tation at that p oint; the relativ e magnitude of the eigen v alues indicates the strength of the dominant orie n tation. The field of orien tations assigns th e orienta tion of this prin cipal eigen v ector to eac h resp ectiv e p oin t. If the pr incipal eigen v ector is not un iqu e at a certain p oint (whic h is to sa y that the eigen v alues are equ al there), th en that indicates a singularity in the field of orien tations. Three-dimensional tensor fi elds of this kind are commonly u sed in d iffu- sion tensor imag in g (DTI) to unders tand brain pathologies suc h as m ultiple sclerosis, sc h izophrenia and strok es. DTI is u sed to analyze imag es of the brain collect ed from magnetic resonance imaging (MRI) mac hines. Th e MRI scan detects diffusion of w ater molecules in the brain and u ses the data to infer the tissue s tr ucture that limits water flo w. The three-dimensional dif- fusion tensor describ es the orien tation dep enden ce of the diffusion. Rou gh ly sp eaking, the eigen v alues indicate a measure of the pr op ortion of w ater molecules flo w ing in the associated eigen vec tor direction. F or more infor- mation on DTI see, f or example, Le Bihan et al. ( 2001 ) and Li et al. ( 2007 ). Let y 1 , . . . , y m denote the spatial data p oin ts. A tensor is constructed at a p oint y j using a n onlinear transformation applied to th e v ectors v i = ( v i 1 , v i 2 ) = − − → y j y i for i 6 = j [Su et al. ( 2008 ), S u ( 2009 )]. Sp ecifically , ˜ v i = ( ˜ v i 1 , ˜ v i 2 ) = exp − (( v i 1 ) 2 + ( v i 2 ) 2 ) 2 σ 2 FO ( v i 1 , v i 2 ) q ( v i 1 ) 2 + ( v i 2 ) 2 , (3) where σ FO is a scaling p arameter. 12 B. J. HILL, W . S. KENDALL A N D E. TH ¨ ONNES The tensor at y j is th en repr esented b y T 0 ( y j ) = X i 6 = j ( ˜ v i 1 , ˜ v i 2 ) T ( ˜ v i 1 , ˜ v i 2 ) . (4) The r esult of the ab o v e m etho d is to pro duce a set of 2 × 2 matrices lo cated o ve r a sparse set of locations. In ord er to create a field of orien tations, we m u st then in terp olate to get a tensor field. Thus, we u se the orien tation of the principal eig en vec tor, wh ere d efined, to construct a field of orien tations. In terp olation of tensors inevitably requires a n otion of tensor metric. W e elect to w ork in the log-Euclidean metric [see Arsigny et al. ( 2006 )]. F or an extended accoun t of tensor metrics see Dryden, Kolo ydenko and Zhou ( 2009 ). Log- Euclidean calculatio ns are simply Euclidean calculations on th e tensor loga rithms whic h are transformed bac k to tensor s pace b y taki ng the exp onential. The tensors arising in this study can all b e represente d b y p ositiv e definite matrices. T ensor logarithms are therefore w ell defined as logarithms of these matrices. How ev er, the m atrix calcula ted in ( 4 ) will ha ve a zero-eigen v alue if the p oin ts are collinear, and therefore not b e p ositiv e definite. If all p oin ts are truly collinear, then our approac h breaks do w n— and indeed the metho d is not in tended for suc h noise-free d ata sets. Th e more common situation is that on e vect or ˜ v i dominates the tensor repr e- sen tation as calculated in ( 4 ) due to the relativ e distances b et ween p oin ts. T yp ically this o ccurs if t wo p oints are close wh ile other p oin ts are f ar from the pair. Due to rounding errors, the con tribu tion of other p oin ts to the matrix b ecomes zero, and the t wo remaining p oin ts are collinear b y defin i- tion. In order to a voi d an error in the log-Euclidean calculatio n , if a tensor has at least one zero-eigen v alue, then it is replaced b y the “un informativ e” iden tity matrix, suggesting a lac k of directional information. T h u s, w e tak e a conserv ativ e approac h that excludes an y p oten tially misleading directional information. W e calculate the int erp olated tensor field T h F O ( x ) for ( x ∈ W ) as a k er- nel sm o othing pro cedure, usin g a Gaussian ke rnel f with v ariance p aram- eter h 2 FO in the log-Euclidean metric. Hence, wh en the s mo othing parame- ter h FO is p ositiv e, h FO > 0 , T h F O ( x ) = exp P y i ∈{ y 1 ,...,y m } f (dist( x, y i )) log ( T 0 ( y i )) P y i ∈{ y 1 ,...,y m } f (dist( x, y i )) . (5) The field of orienta tions υ F O ( y 1 , . . . , y m ; h FO )( x ) for x ∈ W is th en d e- fined to b e equal to tan − 1 ( v 1 ( x ) /v 2 ( x )), w here ( v 1 ( x ) , v 2 ( x )) is the principal eigen v ector of th e matrix represen tation of T h F O ( x ). In most instances this pro cedure will giv e a go o d estimation of a suit- able field of orien tations for mo deling the p oin t pro cess with in tegral fibres. The sm o othin g metho d has the dra wbac k that it can create a bias around areas of high curv ature (rapidly v arying orienta tion) in the fi eld of orien- tations. Po ten tial solutions ha ve b een analyzed and foun d to p erf orm w ell. FIBERS, POINT PROCESSES, FIELDS OF ORI ENT A TIO NS 13 The magnitude of the bias was foun d to b e prop ortional to the smo oth- ing parameter h FO , h ence, these solutions t ypically in v olve comp ensating for h FO : we giv e t wo examples: (A) W e allo w the smo othing parameter to v ary o ve r the windo w , suc h that lo wer v alues are u sed in areas of high point in tensit y . This ensures that less in formation is extrap olated to r egions wh er e ther e is already su fficien t data, and therefore less bias o ccur s in those regions. (B) W e consider tw o instances of the fi eld of orien tations with differen t v alues of smo othin g parameter h ′ FO and h ′′ FO ; th e un biased estima te can b e foun d by extrap olating bac k to estimate th e field of orien tations with h FO = 0 . W e do not go in to further detail here b ecause doing so w ould distract from the m ain ideas in this pap er, but we do n otice a m inor effect of this bias in the examples in Section 6 . Details of these bias corrections can b e found in Hill ( 201 1 ). 4.2. Estimation using signal pr ob abilities. W e extend this fi eld of orien- tations estimati on to tak e account of the ve ctor of probabilities that p oint s are signal ( ε 1 , ε 2 , . . . , ε m ) by w eigh ting the construction of the initial ten- sor and also wei gh ting the con tribu tion of eac h initia l tensor to the k ernel smo othing. Sp ecifically , the initial tensors are r epresen ted b y T 0 ( y j ) = X i 6 = j ( ˜ v i 1 , ˜ v i 2 ) T ( ˜ v i 1 , ˜ v i 2 ) ǫ i (6) for eac h p oin t y j , and the tensor field b ecomes T h F O ( x ) = exp P y i ∈{ y 1 ,...,y m } ǫ i f (dist( x, y i )) log ( T 0 ( y i )) P y i ∈{ y 1 ,...,y m } ǫ i f (dist( x, y i )) . (7) This weigh ting allo ws p oin ts that are more lik ely to b e signal p oints to ha ve a greater effect on the field of orien tations estimation. As ε i → 0 the ef- fect of th e p oin t y i on th e field of orien tations tends to zero, w h ereas if ε i = 1 for all i w e would b e p erforming the calculation describ ed in S ection 4.1 . 5. Sampling from the p osterior distribution. W e seek to infer some char- acteristics of the fib r e pro cess when only the p oint p attern is kn o wn. Typ- ical attributes of interest in clude the num b er of fibr es, where they are lo - cated/orien tated, w hic h p oin ts arose from whic h fib re and which p oints arose from b ackg round noise. Direct in ference fr om th e mo d el is hind ered b y th e complexit y of its h i- erarc hical structure. Hence, we choose to dr a w samples fr om the p osterior distribution of the fibr es and other v ariables u s ing Mark ov c h ain Mon te C arlo metho ds. C h aracteristics of in terest can b e estimated from these samples. 14 B. J. HILL, W . S. KENDALL A N D E. TH ¨ ONNES 5.1. Hyp erp ar ameters. As a rough guideline, hyp erparameters can b e c hosen as follo ws. The p r ior mean num b er of fib res κ and the prior mean length of fibres λ can b e estimated fr om an y prior knowle dge or exp ectatio ns of the fibres. Th e deviation of points from fibres σ 2 disp can b e estimated usin g prior kno wledge of fibre widths and the appr o ximation that 95% of p oin ts should lie within 2 . 45 σ disp of the cente r of a fib re. The dens it y of p oin ts p er unit length of fibre η can b e similarly estimated. Orien tation field parameters h FO and σ FO should b e c hosen to ensure the orien tation field is smo oth. These can b e estimate d by ev aluating the orien tation fields for differen t selections of h FO , σ FO and c ho osing from this set. If the p rop ortion of noise p oin ts is app r o ximately kno wn , then the hy- p erparameters α Signal and β Signal can b e su itably estimated, ho w ever, we suggest c h o osing the parameters su c h that α Signal , β Signal > 1 to ensure go o d mixing prop erties of the Marko v c hain Mon te Carlo sampling algorithm. Otherwise the noise hyp erparameters can b e set equal to 1, indicating no prior kn o wledge. Alternativ ely , if little pr ior information is kn o wn ab out the nature of the laten t curv ilinear structure, then it would b e feasible to extend the empir ical Ba y es step to include th e estimation of furth er prior parameters. 5.2. Birth–de ath M onte Carlo. The starting p oin t for our algorithm is a cont in u ous time birth–death Marko v c hain Monte Carlo (BDMCMC) in whic h fibr es are created and die at random times con trolled by predeter- mined or calc u lated rates. This enables exploration of a wide r ange of mod - els with differen t n umb er s of fibres, and is su ited to this t yp e of clustered data. See Møller and W aagep etersen ( 2004 ) for an in tr o d uction to s p atial birth–death pro cesses. F or the sake of b revit y we present in the follo w ing the k ey p oin ts of the algo r ithm. F urther details can b e f ound in Hil l ( 2011 ). Here w e choose to fix the birth rate and calculate an app ropriate d eath rate at eac h step to mainta in detailed balance. F ollo win g a birth or death we up date the follo wing auxiliary v ariables: Z to Z ′ , the indicato rs of the comp onen ts (sig nal/noise) to whic h the p oint s are asso ciated; X to X ′ , the ind icators of th e fibres to which the signal p oin ts are asso ciated; p to p ′ , the vecto r ( p 1 , . . . , p m ) where p i is the p oin t on the fibre to which the data p oin t y i is asso ciated. 5.3. Births of fibr es. Recall th at the parameteriza tion of fibres is de- scrib ed in Section 2.2 . Birth ev ents o ccur randomly at rate β . Up on the o ccurrence of a birth, the num b er of fibres is u p dated f r om k to k + 1 , and a new fibre is in tro duced by s amp ling a r eference p oin t ω k +1 and lengths l k +1 , 1 , l k +1 , 2 from the prior distributions P ( ω ) , P ( l ), resp ectiv ely . The new FIBERS, POINT PROCESSES, FIELDS OF ORI ENT A TIO NS 15 fibre F k +1 is then calculat ed b y inte grating the field of orien tations accord- ing to these parameters, and th e set of fibres F = F 1 , . . . , F k is up dated to F ′ = F 1 , . . . , F k , F k +1 . In order to ensu re th at the d istribution of the lengt hs l k +1 , 1 , l k +1 , 2 is indep endent of the resp ectiv e directions in whic h the field of orien tations is in tegrated, we c ho ose them to b e indep end en tly and identi- cally d istributed. Data p oints whic h are curr en tly assigned to the noise comp onent are reassigned to noise or signal with prop osal probabilit y dep endent on the new fi b re Q birth ( Z 7→ Z ′ | Z , ε , F k +1 ). Finally , new v alues are p rop osed for all of X , p according to a prop osal densit y Q ( X , p 7→ X ′ , p ′ ). F or simplicit y , we c ho ose not to sample from the full conditional distribu tion of p and X , but rather from a densit y p rop or- tional to the lik eliho o d L ( p , X | y ) . In fu ll, the birth densit y of fib re F k +1 including up dates of auxiliary v ari- ables to Z ′ , X ′ , p ′ is giv en b y b ( F k +1 , ω k +1 , l 1 ,k +1 , l 2 ,k +1 , Z ′ , X ′ , p ′ ) = β P ( ω k +1 ) P ( l 1 ,k +1 ) P ( l 2 ,k +1 ) Q birth ( Z 7→ Z ′ | Z , ǫ , F k +1 ) (8) × Q ( X , p 7→ X ′ , p ′ ) . 5.4. De aths of fibr es. W e m ust calculate the death rate δ j for eac h fibre to ensure detailed balance holds. F ollo win g the death of fibr e F j , th e v ari- ables F , ω and l are u p dated by omitting the j th term. F urther, auxiliary v ariables Z , X and p are all up d ated. All p oints allo cated to fibre F j are now allocated to noise. W e call th is trivial prop osal densit y Q death ( Z ′ | Z , X , j ). Again the fi nal step is to p rop ose new v alues f or all of X an d p according to pr op osal density Q ( X , p 7→ X ′ , p ′ ). Hence, th e death rate that sati sfies detailed balance for the j th fibr e is giv en by δ j = P ( l 1 \ l 1 ,j , l 2 \ l 2 ,j | k − 1) P ( L 1 , L 2 | k ) P ( ω \ ω j | k − 1) P ( ω | k ) P ( k − 1) P ( k ) × b ( F j , ω j , l 1 ,j , l 2 ,j , Z ′ , X ′ , p ′ ) Q death ( Z ′ | Z , X , j ) Q ( X , p 7→ X ′ , p ′ ) (9) = P ( k − 1) P ( k ) β Q birth ( Z ′ 7→ Z | ǫ , F j ) Q ( X ′ , p ′ 7→ X , p ) Q death ( Z ′ | Z , X , j ) Q ( X , p 7→ X ′ , p ′ ) . 5.5. A dditional moves. I t can b e desirable to ad d extra mo v es to the BDMCMC pro cess to improv e mixing. Some p ossible mo ves wh ic h we re all utilized in the examp les in Section 6 includ e the follo wing: • mo ving a fibre by a small amount (b y p ertu rbing the r eferen ce p oint), • resampling the lengths of a fibre (while k eeping the reference p oint fixed). 16 B. J. HILL, W . S. KENDALL A N D E. TH ¨ ONNES Eac h of these ev en ts o ccur at some predefined rate, whence they are pro- p osed and either accepted or r ejected according to the Metrop olis Hastings probabilit y . W e ma y also wish to u p date other mo d el v ariables, giving more flexi- bilit y and improving the al gorithm’s exploratio n of the samp le space. The additional v ariable up dates used in the examples in Section 6 in clude the follo wing: • prop osing new signal-noise allocations of the d ata ( Z ), • prop osing new s ignal pr obabilities ( ε ) according to nondegenerate Beta distributions whose parameters depen d on the cur ren t signal- n oise al- lo cations Z . This mo v e leads to an up date in the pr ior for the field of orien tations du e to the emp irical Ba y es step, hen ce, all fib res are resam- pled. Details of all mov es can b e found in Hill ( 2011 ). Hyp erprior parameters, such as the constan t of prop ortionalit y η in the prior for the P oisson-distributed num b er of p oin ts or σ disp go v erning the deviation of p oin ts f rom fibr es, ma y also b e u p dated. W e ha ve c hosen not to up date any h yp erprior parameters to redu ce complexit y of the mo del. 5.6. Conver genc e and output analysis. First recall that the signal prob- abilities ε are up dated according to nonsingular Beta distribu tions. Hence, the und erlying tensor field as defined in ( 7 ) will n ot b ecome degenerate ev en when Z allocates all p oin ts to noise. Consider th e set A of states in whic h the fib re configuration is empty and all p oin ts are allocated to noise. In the follo wing d iscussion we exclude an y degenerate states of equilibrium probability zero. Insp ection of the algorithm sho w s that the set A can b e reac h ed f rom an y nondegenerate state in finite time and so the birth–death pro cess is φ -irreducible. Recurrence can b e deduced by n oting that th e set A is v isited infinitely often; see Kaspi and Mandelbaum ( 1994 ). W e motiv ate a heuristic lo w er b ound on a suitable burn-in time by consid- ering asp ects of the pr ior deriv ed after ins p ection of the d ata (e.g., σ disp , λ, κ — see Section 5.1 ), and estimating the n umb er of fib r e births that must o ccur b efore a fibre has b een created around eac h p oten tial fibre cluster. W e ap- pro x im ate the lo w er b ound by considering the num b er of fibr e births r equ ired for this to h app en around the smal lest s u itable cluster of p oin ts. A low er b ound on half the length of the shortest suitable cluster is derived from the 10% quan tile of an exp onen tially distribu ted rand om v ariable of rate κ/λ . Th en the probabilit y that a p oint c hosen at random from W lies in a region co rresp ond ing to an actual fibre of this length (up to 2 σ disp from the fi bre) is appro ximated b y 8 λ log (10 / 9) σ disp κ | W | . (10) FIBERS, POINT PROCESSES, FIELDS OF ORI ENT A TIO NS 17 It f ollo ws that, with probabilit y 0 . 99, a fibr e will b e pr op osed in the r egion corresp onding to the sh ortest fib re within th e fir st log(0 . 01) log(1 − 8 λ log(10 / 9) σ disp / ( κ | W | )) (11) births. Hence, w e choose a bu rn-in time of T burn = m ax 1500 , log(0 . 01) β log (1 − 8 λ log (10 / 9) σ disp / ( κ | W | )) , (12) taking 1500 as a lo w er b oun d to ensure the b urn-in time remains substanti al. Con vergence w as assessed b y considering v ariables such as the n um b er of fibres k or the num b er of noise p oin ts and using Gewe k e’s sp ectral densit y diagnostic; see Brooks and Rob erts ( 1998 ). Con vergence of a sequence of n samples is r ejected if th e mean v alue of th e v ariable in the fi r st n/ 10 samples is n ot sufficient ly sim ilar to the mean v alue o ve r the last n/ 2 samples. W e also tested conv ergence by assessing whether the mean sum of the death rates is appro ximately equal to the birth rate β . Consider δ k total t k where δ k total is th e su m of the d eath rates of fi bres after the k th ev ent (e.g., birth, death, etc.) and t k is the length of algorithmic time b efore the next ev ent. If the MCMC has reac h ed statio narit y , then Z m = P m k =1 δ k total t k − m β / (2 β + r add ) σ δ total t √ m D → N (0 , 1) , (13) where σ δ total t is an estimate of the stand ard deviation of δ k total t k , β is the birth rate of fibres, and r add is the s u m of the rates of an y additional mo v es implemen ted (as suggested in S ection 5.5 ). W e used this result to test the con verge n ce of 1 /m P m k =1 δ k total t k to β / (2 β + r add ). Bearing in mind the complexitie s of the underlying mo del, output analysis sho wed no evidence for a lac k of con vergence. Outputs of v arious v ariables are recorded at r andom times at some con- stan t rate. T h e rate of this sampling (effectiv ely the recipro cal of the thinn ing of the Mon te Carlo pro cess) is c hosen su c h th at there is a lo w probabilit y that an y of the fibres remain u nc h anged b et wee n samples. T h e in clus ion of the extra mo ves designed to impro v e mixing also helps to decrease the thinning required. The thinning is c hosen app r o ximately prop ortional to the num b er of fibr es (estimated based on asp ects of priors deriv ed f rom insp ection of the data). 6. Simulati on stud ies and applications. The implement ed algorithm ru ns on a con tinuous time scale. Ev ents o ccur at a determined rate, either fixed or calculated to ensu re that detail ed b alance h olds. The u nits for the rate of an ev ent are “p er unit of algorithm time.” T he BDMCMC is then allo wed to r un for a large num b er of time units an d samples are tak en at random 18 B. J. HILL, W . S. KENDALL A N D E. TH ¨ ONNES times (at some fixed rate). Of course, the relationship of algorithm time to actual pro cessing time dep en ds on h ardw are and implemen tation details. Hardw are details are d escrib ed b elo w . In eac h of the follo wing examples, the b irth rate and the rate of other mo ves (mo vin g a fibre, adjusting lengths of a fibre, prop osing a split or a join, v ariable up dates) w ere all unit rate. The only exceptions w ere the signal probabilit y ( ε ) up dates whic h w er e p rop osed at a rate of 0 . 1 p er u nit of time, and the r ecordin g of outpu t v ariables at rand om times wh ose rate v aried for differen t data sets. W e ev aluate the field of orien tations o v er a square grid of p oin ts, eac h one unit lengt h from its four n earest n eigh b ors. The total size o f this grid is giv en by the d imensions of the window W . All th ree examples w ere ru n on the cluster o wned by the S tatistics Depart- men t in th e Univ ersit y of W arwic k using a Dell Po w er E dge 19 50 server with a 3.1 6 GHz I ntel Xeon Harp erto wn (X5460) pro cessor a nd 1 6 GB fu lly- buffered RAM. The algorithm was implemented in Octa ve version 3.2.4. 1 The total run-times on the cluster ranged fr om 34.7 h ours for the fi ngerprint p ore data (32,300 un its of algorithm time) to 61.3 hour s for the earthquak e data set (30,00 0 un its of alg orith m time). Due to the limitatio ns of the cur- ren t v ersion of Octa v e, th e ben efits of a parallel implementa tion ha v e not y et b een exp lored. Analysis has b een p erf orm ed on all four of the data sets sho wn in Figure 1 . Ho we v er, for the sake of brevit y , w e omit discussion of results for the fi rst sim u lated p oin t pattern [Figure 1 (a)] from this pap er. 6.1. Simulate d exam ple. Figure 4 (a) sh o ws the simulate d data set used in Stanford and Raftery ( 2000 ). W e include it here to facilitate comparison with the m etho d s prop osed b y Stanford and Raftery . The data co nsists of 200 signal p oin ts and 200 n oise p oint s o ve r a 200 × 150 windo w, and is based on a family of t wo fibr es eac h of length 157. The birth–death MCMC was r un f or 60,000 units of algorithm time, the first 30,000 of whic h were discarded. Samples w ere tak en at a rate of 0 . 033 p er unit of time. The initial state was a randomly sampled set of κ = 2 fi- bres. Other h yp erparameters were c h osen as follo ws: disp ersion parameter σ disp = 3; signal probabilit y h yp erp arameters α signal = 1 and β signal = 1 ; den- sit y p arameter η = 0 . 64; mean half-fib re length λ = 78 . 5; and th e Diric hlet parameter α Dir = 1 . 5. Figure 4 (b)–(d) s h o ws that our mo del fits the data very w ell, alb eit with a slight extrap olatio n of fib res b ey ond the curv es used to generate the d ata set. The t w o fi bres in th e sample in Figure 4 (b) compare fa v orably with the principal cur v es fitted in Stanford and Raftery ( 2000 ). 1 The Octa ve cod e for this algorithm is av ailable at UR L http://w ww2.w arwic k .ac.uk/ go/ethonnes/fibres . FIBERS, POINT PROCESSES, FIELDS OF ORI ENT A TIO NS 19 (a) (b) (c) (d) Fig. 4. Simulate d example fr om Stanfor d and R aftery ( 2000 ). (a) Si m ulate d data. (b) A r andom sample fr om the BDMCMC output. Fibr es ar e r epr esente d by curves, pluses indic ate p oi nts al lo c ate d to signal and cr osses indic ate p oints al lo c ate d to noise i n this sample. (c) Estimate of the density of signal p oi nts f ound by smo othing a series of samples of fibr es (darke r ar e as indic ate higher densities). Pluses indic ate p oints al lo c ate d to signal and cr osses indic ate p oints al lo c ate d to noise in at le ast 50% of samples. The si ze of p oi nts r epr esenting the data has b e en r e duc e d to enhanc e the clarity of the density estimate. (d) Estimate of the clustering of the signal p oints—differ ent symb ols i ndic ate differ ent clusters, cr osses indic ate noise. Estimate d by c onsidering how often p airs of p oints ar e asso ci ate d with the same fibr e acr oss a numb er of samples. T able 1 give s the p osterior probabilities of the num b er of fibres and the means and highest p osterior densit y in terv als of a v ariet y of p rop erties con- ditional on the num b er of fibres. The n umb er of fibres is s im p ly a count of th e fib res pr esen t in eac h sample; in this example we exp ect it to b e around 2. Th e num b er of p oin ts assigned to the noise comp onen t will t yp i- cally b e closely correlated with the num b er of fi bres. With more fibres comes a greater c hance of there being a fibre close to a g iv en p oin t and hence a greater c h ance that it is a signal p oin t. W e tak e the 95th p ercen tile of the distances of signal p oin ts fr om their asso ciated p oints on fibres for eac h sample. This summarizes the disp ersion of p oin ts from the fibres. It is com- parable to 2 . 45 σ disp , where σ disp is the disp ersion parameter (set to 3 in this 20 B. J. HILL, W . S. KENDALL A N D E. TH ¨ ONNES T able 1 R esults for Stanfor d and R aftery’s simulate d example: first sub- table gives p osterior pr ob abili ties on the numb er of fibr es, whil e the se c ond gives p osterior me ans and 50% and 95% HPD (highest p osterior density) intervals for a sele ction of pr op erties of the p osterior distribution c onditional on the numb er of fibr es. The simulate d data c onsists of 200 si gnal p oi nts and 200 noise p oints over a 200 × 150 window, and is b ase d on a fami ly of two fibr es e ach of length 157. The disp ersion p ar ameter σ disp is se t to 3 and t he prior me an pr ob ability that a p oint is noise is 0 . 5 . Posterior pr ob abilities only given i f nonzer o to r ounding err or Po sterior probabilities for n u mb er of fibre s Number of fibres 2 3 4 P osterior probability 0 . 73 0.23 0.04 Other prop erties conditioned on the num b er of fibres Number of Po sterior 50% HPD 95% H PD fibres mean interv al interv al Number of noise points 2 181 . 85 [176 , 193 ] [156 , 205 ] 3 180 . 81 [179 , 197 ] [149 , 201 ] 4 178 . 78 [167 , 184 ] [155 , 197 ] 95th p ercentile of the distances 2 8 . 16 [7 . 17 , 8 . 32] [6 . 64 , 9 . 66] from signal p oints to fibres 3 8 . 06 [7 . 28 , 8 . 27] [6 . 61 , 9 . 53] 4 7 . 95 [7 . 20 , 7 . 91] [6 . 75 , 9 . 50] T otal length of fibres 2 317 . 68 [319 , 325 ] [301 , 325 ] 3 319 . 60 [315 , 322 ] [300 , 342 ] 4 320 . 10 [325 , 303 ] [303 , 325 ] example). The constant 2 . 45 arises as the 95th p ercen tile of the Euclidean distance from the origin to a biv ariate standard-normal distributed random v ariable. The curv ature b ias in the field of orien tations r esults in a mild bias on the 95th p ercen tile of distances from s ignal p oints to anchor p oints. In this example, less p oin ts are asso ciated to n oise than were simulate d as noise p oin ts in the d ata generation. This is partly du e to the h igh in- tensit y of noise p oints, and also explained by a sligh t b ias in the length of the fib r es. The p osterior statistics on the lengths of th e fibres su ggest that the extension of fibres b ey ond their kno w n length (of 157) is supp orted b y the high in tensit y of noise p oin ts. This ext rap olation is someti mes b enefi- cial, particularly f or fibre reconstruction in areas of m issing data. Here the extrap olation is less desirable, as it suggests there is evidence for fibres in the b ac kground noise. The extrap olation of fibres into less dense regions of p oint s can b e reduced b y c ho osing a higher Di ric hlet parameter α Dir for the distribution of anchor p oin ts along the fibres. This decreases th e p osterior dens ity of fibr es lyin g through p oint clusters of nonconstan t in tensity . T h e dra w b ac k of in cr eas- FIBERS, POINT PROCESSES, FIELDS OF ORI ENT A TIO NS 21 ing α Dir is that a large v alue of α Dir leads to a m u ltimo d al anc hor p oin t distribution with most of the pr obabilit y mass concent rated at the mo des. As the p rop osal of a birth /change of a fibre does not tak e accoun t of the shap e of anchor p oin t distribution, the prop osal of a state with lo w p osterior densit y is more lik ely for larger α Dir . 6.2. Applic ation: Earthquakes on th e new M adrid fault line. Th e epicen- ters of earthquak es along seismic f au lts are a goo d example of p oin t data clustered around a system of fibres with additional b ac kground noise. Here the fi bres are the un kno wn fault lines. S tanford and Raftery ( 2000 ) consid er the structure of the data set of earthquak es around the New Madrid fault line in cen tral USA. W e use d ata on earthquak es in the New Madrid region b e- t wee n 1st Jan 2006 and 3rd Aug 200 8 (inclusiv e) tak en from the CERI (Cen- ter for Earthquake Researc h and I nformation) found at h ttp://www.ceri. memphis.edu/seismic/catalog s/cat nm.ht ml . The birth–death MCMC was r un f or 40,000 units of algorithm time, the first 10,000 of whic h w ere d iscard ed. Samples w ere tak en at a rate of 0 . 01 67 p er un it of time. The initial state w as a randomly sampled set o f κ = 4 fibres. Other hyp erparameters were c hosen as follo ws: disp ersion parame- ter σ disp = 2; signal p robabilit y h y p erparameters α signal = 4 and β signal = 1; densit y parameter η = 1 . 06; mean half-fibr e length λ = 30; and the Diric hlet parameter α Dir = 1 . 5. T able 2 giv es some numerical prop erties of th e p osterior distribution of fibres. Our method has the adv antag e ov er Stanford and Raftery ( 2000 ), in that it do es n ot try to o v er-fit the fibres where there is less data. Rather it uses information from surroun d ing data to extrap olate fib res as required. O ne limitation of our mo del is that ev ery fib r e is assu med to share a num b er of prop erties. In p articular, the disp lacemen t of p oint s from fi bres (effec- tiv ely the width of influence of a fibr e) and the in tensity o f sig nal p oin ts p er unit length of fibre are assumed to b e co nstan t, indep en den t of the fibre. These assum ptions are n ot reasonable for this data as the “thic kness” and densit y of p oin ts v aries considerably . T his is apparen t in Figure 5 (b) wh ere the cen tral dense cluster is describ ed by multiple parallel fibres. The disp er- sion parameter σ disp w as c h osen b y considering the apparent “width” of the longer thinner fibr e, hence, p oin ts around th e sh orter, wider fib re effectiv ely increase the 95th p ercen tile of the p oin t to fibr e distances, as giv en in T a- ble 2 . T o o v ercome this issu e, one could extend the mo del to allo w differen t h y p erparameters for eac h fib r e. While multiple fibres in the central cluster is a common feature in samples from this BDMCMC, Figure 5 (d) indicates that the agglomerativ e clustering algorithm iden tifies the p oin ts as arising from the same cluster. In terestingly , the to tal length of fibres d o es not app ear to b e p ositiv ely correlated to the num b er of fibres, suggesting that the additional fib res arise 22 B. J. HILL, W . S. KENDALL A N D E. TH ¨ ONNES T able 2 R esults for e arthquake data: first sub -table gives po sterior pr ob abili ties on the numb er of fibr es, while the se c ond gives p osterior me ans and 50% and 95% HPD (highest p osterior density) interv als for a sele ction of pr op erties of the p osterior distr ibution c onditional on the numb er of fibr es. The data ar e al l the r e c or de d e arthquakes in the New Madrid r e gion b etwe en 1st Jan 2006 and 3r d Aug 2008; the data wer e ac quir e d fr om the CERI (Center for Earthq uake R ese ar ch and Information) f ound at http://www.c eri.memphis.e du/ seismic/c atalo gs/c at nm.html . In total ther e ar e 317 p oints in a 300 × 300 window, the disp ersion p ar ameter σ disp is se t to 2 and t he prior me an pr ob ability that a p oint is noise is 0 . 2 . Posterior pr ob abilities only given i f nonzer o to r ounding err or Po sterior probabilities for n u mb er of fibre s Number of fibres 6 7 8 P osterior probability 0 . 56 0.36 0.07 Other prop erties conditioned on the num b er of fibres Number of Po sterior 50% HPD 95% H PD fibres mean interv al interv al Number of noise points 6 42 . 99 [41 , 44] [38 , 48] 7 40 . 65 [38 , 41] [36 , 45] 8 42 . 06 [42 , 44] [35 , 45] 95th p ercentile of the distances 6 5 . 25 [4 . 94 , 5 . 19] [4 . 96 , 5 . 60] from signal p oints to fibres 7 5 . 29 [5 . 12 , 5 . 40] [4 . 85 , 5 . 89] 8 5 . 17 [4 . 94 , 5 . 22] [4 . 74 , 5 . 65] T otal length of fibres 6 257 . 24 [247 , 257 ] [246 , 269 ] 7 257 . 43 [257 , 262 ] [249 , 264 ] 8 252 . 89 [250 , 252 ] [248 , 265 ] from sp litting a fibre in to m ultiple p arts while preserving the tot al fibre length. 6.3. Applic ation: Fingerp rint data. The second application w e consider is that of p ores lying along ridge lines in fingerprin ts. Fingerprint p ore data is consid ered in some depth in Su et al. ( 2008 ) and Su ( 2009 ). W e used a p ortion of the data set extrac ted from fi ngerprint a002–05 from the NIST ( National Institute of Standar ds and T e chnolo g y ) Sp e cial Datab ase 30 [W atson ( 2001 )]. The birth–death MCMC was r un f or 40,000 units of algorithm time, the first 8000 of which were discarded. Samples we re tak en at a rate of 0 . 007 p er unit of time. T he initial state was a r andomly sampled set of κ = 10 fi b res. The fingerprint p ore data will t ypically cause breakdo w n of nearest neigh- b or clustering metho d s . Th is is b ecause, wh ile the fibrous structure of the p oin t pattern is clear when viewing the global picture, it is not so apparent on a small scale. This phen omena is partly due to the apparent in ter-rid ge FIBERS, POINT PROCESSES, FIELDS OF ORI ENT A TIO NS 23 (a) (b) (c) (d) Fig. 5. N ew Madrid f ault e arthquake data. (a) Earthquake data. (b) A r andom sample fr om the BDMCMC output . Fibr es ar e r epr esente d by curves, pluses i ndic ate p oints al lo- c ate d to signal and cr osses i ndic ate p oints al lo c ate d to noise in this sample. (c) Estimate of the density of signal p oints found by smo othing a series of samples of fibr es (da rker ar e as i ndic ate higher densities). Pluses i ndic ate p oints al lo c ate d to signal in at le ast 50% of samples. The size of p oints r epr esenting the data has b e en r e duc e d to enhanc e the clar- ity of the density estimate. (d) Estimate of the cl ustering of the signal p oints—differ ent symb ols i ndic ate differ ent clusters, cr osses i ndi c ate noise. Estimate d by c onsidering how often p airs of p oints ar e asso ciate d with the same fibr e acr oss a numb er of samples. alignmen t of p oints [from left to righ t in Figure 6 (a)]. By wa y of con trast, our field of orien tations mo del tak es any information a v ailable on a small scale and uses it across the window, thanks to the smoothing step in th e field of orien tations. As Figure 6 sho w s, our m o d el succeeds in fitting many of the fibres (or fingerprint ridges) to the p ore data. Figure 6 (c) indicates areas of doubt in 24 B. J. HILL, W . S. KENDALL A N D E. TH ¨ ONNES (a) (b) (c) (d) Fig. 6. Por es f r om p ortion of fingerpr int a002–05 f r om the NIS T Special Database 30 [Watson ( 2001 )]. (a) Por e data. (b) A r andom sample fr om the BDMCM C output. Fibr es ar e r epr esente d by curves, pluses indic ate p oi nts al lo c ate d to signal and cr osses indic ate p oints al lo c ate d to noise in this sample. (c) Estimate of th e density of signal p oints found by smo othing a series of samples of fibr es (darker ar e as i ndic ate higher densities). The size of p oi nts r epr esenting the data has b e en r e duc e d to enhanc e the clarity of the density estimate. (d) Estimate of the clust ering of the signal p oi nts—differ ent symb ols indic ate differ ent cl usters, cr osses indic ate noise. Estimate d by c onsidering how often p ai rs of p oints ar e asso ci ate d wi th the same fibr e acr oss a numb er of samples. the fibre lo cations where the shading is ligh ter near th e edges of the window, sho w in g that fibre samples w ere more disp ersed. This d ata set is a n ideal candidate for r econstru ction of missing data . W e w ork un d er the assumptions that p ores lie at fairly r egularly in terv als along ridges, but some are not ident ified durin g the p ore extraction pro cess. Our metho d uses inf orm ation f rom nearb y ridges to complete fi bres where data is miss ing. In this example this is particularly eviden t in the region b elo w the center of the window. Kno wledge of the p osterior d istr ibution of fib res could lead to a “filling in th e gaps” approac h to reconstructing the miss ing p ore d ata. FIBERS, POINT PROCESSES, FIELDS OF ORI ENT A TIO NS 25 T able 3 Fingerprint Por e Data Set: Post erior me ans and 50% and 95% cr e dible intervals of a sele ction of pr op erties of the p osterior distr ibution c onditional on t he numb er of fibr es. The dat a was ex tr acte d fr om a p ortion of fingerprint a002–05 fr om the NIS T ( National In stitute of Standards and T echnology ) Sp ecial Database 30 [Watson ( 2001 )]. I t c onsists of 123 p oints on a 10 0 × 100 window. A disp ersion p ar ameter of σ disp = 1 . 5 is use d, and the me an prior pr ob abili ty a p oint is noise is 0 . 091 . Posterior pr ob abilities only given i f nonz er o to r ounding err or Po sterior probabilities for number of fibres Number of fibres 13 14 15 16 17 18 19 20 P osterior probability 0 . 03 0 . 11 0 . 17 0 . 17 0 . 25 0 . 11 0 . 09 0 . 05 Other prop erties conditioned on the num b er of fibres Number of P osterior 50% HPD 95% HPD fibres k mean interv al interv al Number of noise points 14 14 . 45 [14 , 16] [9 , 18] 15 15 . 71 [12 , 15] [12 , 21] 16 15 . 00 [12 , 17] [8 , 21] 17 18 . 86 [16 , 19] [16 , 23] 18 16 . 08 [15 , 18] [10 , 25] 95th p ercentile 14 3 . 76 [3 . 74 , 3 . 82] [3 . 25 , 4 . 22] of the distances 15 3 . 68 [3 . 52 , 3 . 69] [3 . 32 , 4 . 77] from signal p oints 16 3 . 56 [2 . 34 , 3 . 52] [3 . 34 , 3 . 89] to fibres 17 3 . 58 [3 . 38 , 3 . 64] [3 . 23 , 3 . 95] 18 3 . 67 [3 . 44 , 3 . 75] [3 . 24 , 4 . 38] T otal length of fibres 14 862 . 18 [861 , 883 ] [785 , 964 ] 15 882 . 38 [872 , 933 ] [818 , 966 ] 16 864 . 75 [836 , 886 ] [784 , 927 ] 17 814 . 43 [788 , 804 ] [788 , 878 ] 18 861 . 76 [821 , 876 ] [761 , 941 ] T able 3 giv es some numerical pr op erties of th e p osterior distribu tion of fibres. 7. Discussion. In this pap er w e ha v e iden tified a new m o del for fib re pro cesses and for p oint pro cesses generat ed f r om a fibre pro cess. W e ha v e sho w n ho w Mon te Carlo metho ds can b e used to samp le fr om the p osterior distribution of a fibre pro cess that is instr umen tal in ge nerating a p oint pro cess. Man y different data sets of this t yp e arise in nature. W e in vest igated earthquak es that cluster around fault lines and p ores in fingerprints that are situated along the fi ngerprint ridges. Other d ata can b e found in cata- logues of gala xies in the visible univ erse. Galaxies are kno w n to alig n them- selv es along “cosmic” filamen ts whic h, in tur n, connect to form a web-lik e 26 B. J. HILL, W . S. KENDALL A N D E. TH ¨ ONNES structure. Understand ing these fibr es and ident ifying where they lie is of great interest to cosmologists; see, for example, Ma rt ´ ınez and S aar ( 2002 ) for a statistical ov erview of some cur ren t ideas and also Stoica, Mart ´ ın ez and Saar ( 2007 ) for a differen t approac h to mo deling the filament structure. Other data sets f or whic h this mo del may b e suitable include the lo cations of land mines, often p laced in straigh t lines. Id en tifying these lines may aid in the disco ve ry of currently und etecte d mines. Similar metho d s of detect- ing s tr ucture in n oisy pictures are a prominent area of researc h in image recognition. This pro cess ca n b e used to fit nonparametric cu r v es to p oint patterns with just tw o limitations on th e nature of the cur v es. The limita tions are that the curv es must n ot in tersect, and that they must b e “su fficien tly” smo oth (i.e., there m u st b e no acute angles in the d iscr etization of the fi bres). The smo othness prop ert y is d esirable to id en tify smo oth curves rather than complex stru ctures. The nonintersectio n prop ert y may b e less d esirable but, at some co mputational co st, the mo del could b e generalized to allo w eac h fibre to int egrate a differen t fi eld of orient ations. W e d o not make use of a deterministic algorithm (suc h as the EM- algorithm) to fit th e fibres, and our ap p roac h is not highly sensitive to the c hoice of starting p arameters. Therefore, it can b e u sed to pro vide in terv al estimates for v arious p arameters. One of the most sensitiv e parameters fixed in the algorithm is σ 2 disp whic h go verns the deviation of p oin ts from the fi- bres. If c hosen to o large, the result will b e to o few fibr es with a sizeable error in their lo cations. If c hosen to o small, fi bre clusters ma y b e sp lit in to m u ltiple parallel smaller clusters. Our exp erience is that the algorithm is reasonably r obust to c hanges in other parameters. One strength of our mo d el is that it fi ts th e noise-signal and cluster allo- cations implicitly , in cont rast to other cases wh ere the clustering ma y need to b e predetermined. The adv anta ge is that we can pr o duce reliabilit y esti- mates for these clustering and noise allocations and explore more p otent ial clustering confi gurations, and hence more fibre stru ctures. A limitation of our mo d el arises fr om th e constrain ts on th e similarity of fibr es. Fibres are assumed to b e of the same width (the displacemen t of p oin ts from the fibr es is indep endent of the fi b re), and ha ve the same mean p oin ts p er unit fibre length. These are n ot alw a ys reasonable assumptions, as is evidenced by the earthquak e d ata set. W e could extend the mo del to allo w p arameters σ 2 disp and η to tak e different v alues for eac h fib re in order to eliminate this issue. A f urther extension would b e to include isotropic clusters of p oint s whic h do not fit wel l to the “fibre” mo del. The complexity of the m o del, consid ering the infinite dimensionalit y of the field of orien tations, raises the question of whether or n ot the Mark o v c hain adequately explores the sample sp ace. Our examples indicate that, w hile the samp le space of fields of orien tations is not explored particularly w ell, the sp ace of fibr e configur ations is w ell explored and the field of orien tations FIBERS, POINT PROCESSES, FIELDS OF ORI ENT A TIO NS 27 v aries enough to exp lore a wide sp ace of fibre configur ations. Ho wev er , as the densit y of fibres increases, so the MCMC algorithm requir es longer run time in order to ov er come these issu es. Note that wh ile our mo del p erforms as well as other a v ailable tec hniques on the basic d ata sets, it demons trates significan tly b etter p erf ormance on the fi ngerprint data where a large n u mb er of dense fibre clusters account for most of the d ata. It is necessary to b ear in m in d the ramifications of edge effects in the mo del and subsequently the MCMC algorithm. As w e are sampling from a b ound ed subset W ⊆ R 2 , the omission of p oten tial p oin ts just outside W induces a bias on distance-related measur es. The field of orien tations will ha ve a bias at the edge fav orin g orien tations parallel to the sides of a rectan- gular windo w W . Fibres are created b y sampling a r andom reference p oin t from the field and in tegrating th e field of orienta tions fr om that p oint. Ho w- ev er, the reference p oin t cannot b e samp led from outside W , and fib res th at extend past the b ou n dary of W are t ypically terminated on the b order as no field of orien tations is a v ailable past that p oin t. Also, the mo del for the displacemen t of points from fibres do es n ot accoun t f or edge effects. Most of these algorithmic biases wo u ld b e significantl y decreased b y creating a b or- der around W and completing the analysis o ver the whole area. Ho we v er, this w ould come at an additional computational cost. W e ha ve commen ted in p assing on the phenomenon o f c urv ature bias and its effects on th e estimation of parameters, and w e n ote this as a fruitfu l area for futur e researc h. F urther r esearc h p ossib ilities include the fitting of t wo- dimensional s u rfaces in 3 d im en sions. Then n ew geometric issues n eed to b e tak en into accoun t; for example, it is not the case that a generic field of tangen t planes can b e dev elop ed int o a fibration by su rfaces. It is hop ed to inv estigate this pr oblem in further work. REFERENCES Adler, R. J. and T a ylor, J. E. (2007). R andom Fiel ds and Ge ometry . Springer, New Y ork. MR2319516 Arsigny, V. , Fillard, P. , Pennec, X. and A y ache, N. (2006). Log-Euclidean metrics for fast and simple calculus on diffusion tensors. Magn. R eson. Me d. 56 411–421. August, J. and Zucker, S. W. (2003). Sketches with curv atu re: The curve indicator random field and Marko v processes. IEEE T r ans. Pattern Anal. Mach. Intel l. 25 387– 400. Barro w, J. D. , B ha vsar, S. P. and Sonod a, D. H. (1985). Minimal spanning trees, filaments and galaxy clusteri ng. R oyal Astr onomic al So ciety, Monthly Notic es 216 17– 35. Broo ks, S. P. and Rob er ts, G. O. (1998). Con verg ence assessment t ec h niques for Mark o v c h ain Mon te Carl o. St atist. Comput. 8 319–335. Dr y den, I. L. , Kolo ydenko, A. and Zhou, D. (2009). Non-Euclidean statistics for co vari ance matrices, with applications to diffusion tensor imaging. A nn. Appl. Stat . 3 1102–11 23. MR2750388 28 B. J. HILL, W . S. KENDALL A N D E. TH ¨ ONNES Genovese, C. R. , Per one-P acifico, M. , Verdinelli, I. and W asserm an, L. (2009). On the p ath density of a gradien t fi eld. Ann. Statist. 37 3236–3271. Hill, B . J. (2011). An orientation fi eld approach to mo delling fibre-generated spatial p oint processes. Ph.D. thesis, U niv. W arwic k . A v ailable at h ttp://www2. w arwick.ac.uk/go/ ethonnes/fibres/Hill.pd f . Illian, J. , Penttinen, A. , Stoy an, H. and Sto y an, D. (2008). Statistic al A nalysis and Mo del l ing of Sp atial Point Patt erns . Wiley , New Y ork. Kaspi, H. and Mandelbaum, A. (1994). On H arris recu rren ce in contin uous time. Math. Op er. R es. 19 211–222. MR1290020 Le Bihan, D. L. , Ma ngin, J. F. , Poupon, C. , Clark, C. A. , P app a t a, S. , Molko , N . and Chabria t, H. ( 2001). Diffusion tensor imaging: Concepts and applications. J. Magn. R eson. Imaging 13 53 4–546. Li, C. , Sun, X. , Zou, K. , Y ang, H. , Huang, X. , W ang, Y. , Lui, S. , Li, D. , Zou, L. and Chen, H. (2007). V oxel based analysis of DTI in depression patients. I nternat ional Journal of M agnetic R esonanc e Imaging 1 43–48. Mar t ´ ınez, V. J. and Saar, E. (2002). Statistics of the Galaxy Distribution . Chapman & Hall/CR C, Boca Raton, FL. Møller, J. and W a a gepetersen, R. P. ( 2004). Statistic al Infer enc e and Si mulation for Sp atial Point Pr o c esses . Mono gr aphs on Statistics and Applie d Pr ob ability 100 . Chap- man & Hall, London. MR2004226 Pearl, J. (1988). Pr ob abilistic R e asoning in Intel l i gent Systems: Networks of Pl ausible Infer enc e . Morgan Kaufmann, San Mateo. MR0965765 St anfo rd, D. C. and R after y, A. E. (2000). Findin g curv ilinear features in spatial p oin t patterns: Principal curve clustering with noise. IEEE T r ansactions on Pattern Ana lysis and Machine Intel l igenc e 22 601–609. Stoica, R. S . , Mar t ´ ınez, V. J. and Saa r, E. (2007). A three-dimensional ob ject point process for detection of cosmic filamen ts. Appl . St atist. 56 459–477. Stoica, R. S. , Mar t ´ ınez, V. J. an d Saar, E. (2010). Filamen ts in observed and mock galaxy catalogues. Astr onomy and Astr ophysics 510 1–12 . Stoica, R. S. , Mar t ´ ınez, V. J. , Ma teu, J. and Saar, E. (2005). Detection of cosmic filaments u sing the Candy model. Astr onomy and Ast r ophysics 434 423. Sto y a n , D. , Kendall , W. S . and Mecke, J. (1995). Sto chastic Ge ometry and Its Ap- plic ations , 2nd ed. Wiley , New Y ork. Su, J. (2009). A ten sor approac h to fi ngerprint analysis. Ph .D. thesis, Univ. W arwic k. Su, J. , Hill, B . J. , Ke ndall , W. S. and Th ¨ onnes, E. (2008). I nference fo r point pro- cesses with un observ ed one-dimensional reference structure. CRiSM W orking P aper 8-10, Univ . W arwic k . W a tson, C. (2001). NIST special database 30: Dual resolution images from p aired fin- gerprint cards. National Institute of Stand ard s and T ec h nology , Gaithersburg. Dep ar tment of St a tistics University of W ar wick Coventr y , CV4 7AL United Kingdom E-mail: Bryon y .Hi ll@gmail.com W.S.Kendall@warwic k.ac.uk E.Thonnes@w arwick.ac .uk
Original Paper
Loading high-quality paper...
Comments & Academic Discussion
Loading comments...
Leave a Comment