Automated Image Analysis of Hodgkin lymphoma
Hodgkin lymphoma is an unusual type of lymphoma, arising from malignant B-cells. Morphological and immunohistochemical features of malignant cells and their distribution differ from other cancer types. Based on systematic tissue image analysis, computer-aided exploration can provide new insights into Hodgkin lymphoma pathology. In this paper, we report results from an image analysis of CD30 immunostained Hodgkin lymphoma tissue section images. To the best of our knowledge, this is the first systematic application of image analysis to a set of tissue sections of Hodgkin lymphoma. We have implemented an automatic procedure to handle and explore image data in Aperio’s SVS format. We use pre-processing approaches on a down-scaled image to separate the image objects from the background. Then, we apply a supervised classification method to assign pixels to predefined classes. Our pre-processing method is able to separate the tissue content of images from the image background. We analyzed three immunohistologically defined groups, non-lymphoma and the two most common forms of Hodgkin lymphoma, nodular sclerosis and mixed cellularity type. We found that nodular sclerosis and non-lymphoma images exhibit different amounts of CD30 stain, whereas mixed cellularity type exhibits a large variance and overlaps with the other groups. The results can be seen as a first step to computationally identify tumor regions in the images. This allows us to focus on these regions when performing computationally expensive tasks like object detection in the high-resolution image.
💡 Research Summary
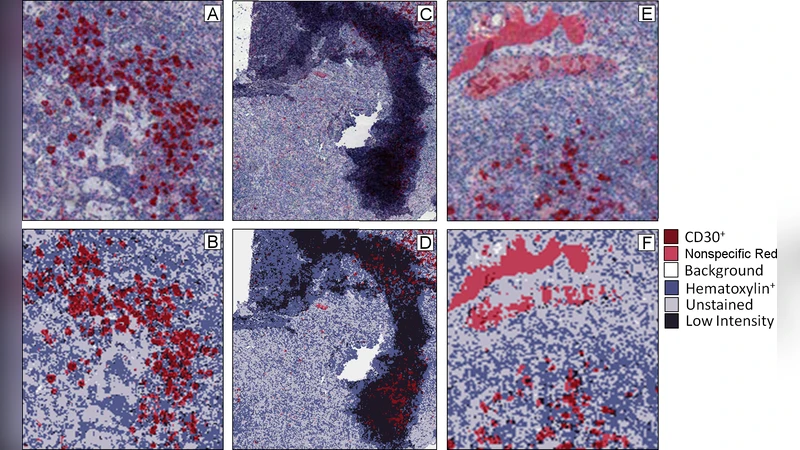
This paper presents the first systematic application of automated image analysis to a collection of Hodgkin lymphoma (HL) tissue sections stained for the CD30 antigen. The authors address a key challenge in modern pathology: the sheer size and complexity of whole‑slide images (WSIs) stored in Aperio’s SVS format, which makes manual, pixel‑by‑pixel evaluation impractical. Their workflow consists of three main stages: (1) down‑sampling of the high‑resolution slide to a manageable size, (2) background removal and tissue segmentation using color‑space conversion and morphological operations, and (3) supervised pixel‑level classification into four predefined categories (CD30‑positive, CD30‑negative, non‑specific stain, and background).
For the classification step the authors assembled a modest training set that was manually annotated by expert pathologists. Each pixel was described by a feature vector comprising RGB and HSV color values, texture descriptors derived from Laplacian and Gabor filters, and local neighborhood statistics. Two conventional machine‑learning algorithms—linear Support Vector Machines and Random Forests—were evaluated; Random Forests were selected for their balance of accuracy and computational speed. The trained classifier was then applied to the down‑scaled images, producing a probability map that was subsequently thresholded to assign each pixel to one of the four classes.
The study cohort included three histologically defined groups: non‑lymphoma (benign lymph node tissue), nodular sclerosis (NS) HL, and mixed cellularity (MC) HL. For each slide the authors calculated the proportion of tissue area occupied by CD30‑positive pixels. Statistical analysis (ANOVA with Tukey post‑hoc tests) revealed that NS cases have a significantly higher mean CD30‑positive area (≈18 % of tissue) compared with non‑lymphoma samples (≈5 %). MC cases displayed a broad distribution (mean ≈12 % but with a standard deviation of ±8 %), indicating substantial intra‑group heterogeneity and overlap with both NS and non‑lymphoma groups. These findings suggest that CD30 staining intensity alone can discriminate NS from benign tissue, while MC requires additional biomarkers or morphological cues for reliable classification.
A notable contribution of the work is the demonstration that a low‑resolution pre‑processing pipeline can reliably delineate tissue from background, thereby enabling the generation of a coarse tumor mask. This mask can be up‑sampled and overlaid on the original gigapixel image, focusing subsequent computationally intensive tasks—such as high‑resolution object detection of Reed‑Sternberg cells—on a limited region of interest. This strategy dramatically reduces processing time and memory requirements, making large‑scale analyses of WSIs feasible on standard laboratory hardware.
The authors acknowledge several limitations. First, the training set is relatively small, raising concerns about the classifier’s robustness to variations in staining intensity, slide preparation artifacts, and scanner differences. Second, the analysis is restricted to a single immunohistochemical marker; incorporating additional markers (e.g., CD15, PAX5) or multiplexed imaging could improve discrimination, especially for the heterogeneous MC subtype. Third, the use of conventional machine‑learning models may not capture the full complexity of tissue architecture; deep‑learning approaches such as fully convolutional networks or attention‑based models could provide more accurate segmentation and better generalization.
In conclusion, this study establishes a practical, end‑to‑end pipeline for automated processing of CD30‑stained HL WSIs, validates its ability to quantify staining differences among clinically relevant subtypes, and proposes a workflow that can be extended to more sophisticated analyses. The methodology lays groundwork for future computer‑aided diagnostic tools that can assist pathologists by automatically highlighting tumor‑rich regions, thereby streamlining the diagnostic workflow and enabling large‑scale quantitative pathology studies.
Comments & Academic Discussion
Loading comments...
Leave a Comment