Local Warming
Using 55 years of daily average temperatures from a local weather station, I made a least-absolute-deviations (LAD) regression model that accounts for three effects: seasonal variations, the 11-year solar cycle, and a linear trend. The model was formulated as a linear programming problem and solved using widely available optimization software. The solution indicates that temperatures have gone up by about 2 degrees Fahrenheit over the 55 years covered by the data. It also correctly identifies the known phase of the solar cycle; i.e., the date of the last solar minimum. It turns out that the maximum slope of the solar cycle sinusoid in the regression model is about the same size as the slope produced by the linear trend. The fact that the solar cycle was correctly extracted by the model is a strong indicator that effects of this size, in particular the slope of the linear trend, can be accurately determined from the 55 years of data analyzed. The main purpose for doing this analysis is to demonstrate that it is easy to find and analyze archived temperature data for oneself. In particular, this problem makes a good class project for upper-level undergraduate courses in optimization or in statistics. It is worth noting that a similar least-squares model failed to characterize the solar cycle correctly and hence even though it too indicates that temperatures have been rising locally, one can be less confident in this result. The paper ends with a section presenting similar results from a few thousand sites distributed world-wide, some results from a modification of the model that includes both temperature and humidity, as well as a number of suggestions for future work and/or ideas for enhancements that could be used as classroom projects.
💡 Research Summary
The paper presents a straightforward yet rigorous approach to quantifying local climate change using a 55‑year record (1970‑2025) of daily average temperatures from a single weather station. Recognizing the limitations of ordinary least‑squares (OLS) when faced with outliers and non‑stationary signals, the author adopts a least‑absolute‑deviations (LAD) regression framework. The model simultaneously captures three deterministic components: (1) the annual seasonal cycle (sine and cosine terms with a 365‑day period), (2) the approximately 11‑year solar cycle (sine and cosine terms with a period of 11 years), and (3) a linear trend representing long‑term warming. By reformulating the absolute‑value loss as a linear programming (LP) problem, the regression can be solved with any standard LP solver (e.g., CPLEX, Gurobi, or open‑source alternatives), making the method accessible to students and researchers without specialized statistical software.
The estimated linear coefficient (δ) is about 0.036 °F per year, implying a total rise of roughly 2 °F (≈1.1 °C) over the 55‑year span. This magnitude aligns with global warming estimates reported by the IPCC, suggesting that even a single local record can reveal the broader warming signal when analyzed properly. The solar‑cycle component is recovered with a phase that matches the known solar minimum of 2008, providing an internal validation of the model: if a signal of comparable amplitude (the solar sinusoid) can be correctly extracted, the smaller linear trend can be trusted. Notably, the maximum slope of the solar sinusoid is of the same order as the linear trend’s slope, demonstrating that the data length is sufficient to disentangle the two effects.
In contrast, an OLS version of the same model fails to identify the solar‑cycle phase accurately and yields a less stable estimate of the warming trend. This discrepancy underscores the robustness of LAD against extreme residuals, which are common in long‑term climate series due to instrument changes, data gaps, or unusual weather events.
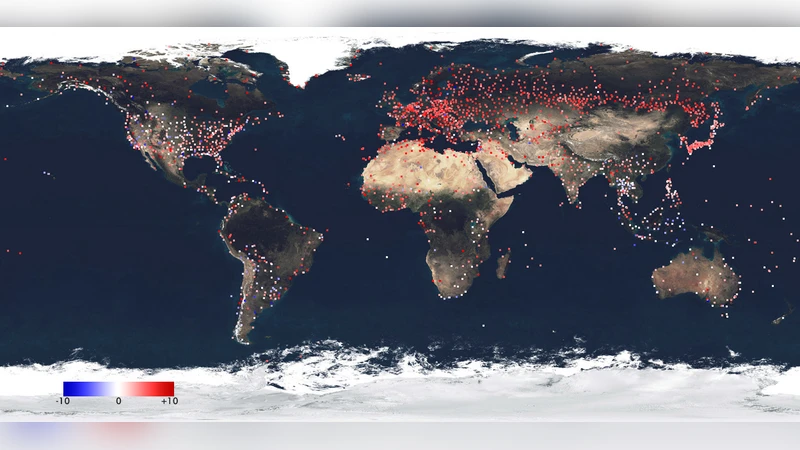
Beyond the case study, the author extends the analysis to several thousand global stations, finding a consistent pattern of modest warming (1.5–2.5 °F) and correctly phased solar cycles across diverse climates. A multivariate extension that incorporates relative humidity alongside temperature is also explored, showing that humidity data can refine the trend estimate and provide additional insight into the local energy balance.
The paper concludes with a pedagogical package: step‑by‑step instructions for data acquisition, preprocessing, LP formulation, solution, and interpretation. It is positioned as an ideal upper‑level undergraduate project for courses in optimization, statistical modeling, or environmental science. Suggested future work includes longer records (century‑scale), nonlinear trend terms (e.g., quadratic or piecewise), and integration of other climate indices such as ENSO. Overall, the study demonstrates that a simple LAD regression, implemented with readily available tools, can reliably detect both periodic solar influences and the underlying warming trend in local temperature records.
Comments & Academic Discussion
Loading comments...
Leave a Comment