Graphical Query Builder in Opportunistic Sensor Networks to discover Sensor Information
A lot of sensor network applications are data-driven. We believe that query is the most preferred way to discover sensor services. Normally users are unaware of available sensors. Thus users need to pose different types of query over the sensor network to get the desired information. Even users may need to input more complicated queries with higher levels of aggregations, and requires more complex interactions with the system. As the users have no prior knowledge of the sensor data or services our aim is to develop a visual query interface where users can feed more user friendly queries and machine can understand those. In this paper work, we have developed an Interactive visual query interface for the users. To accomplish this we have considered several use cases and we have derived graphical representation of query from their text based format for those use case scenario. We have facilitated the user by extracting class, subclass and properties from Ontology. To do so we have parsed OWL file in the user interface and based upon the parsed information users build visual query. Later on we have translated the visual query languages into SPARQL query, a machine understandable format which helps the machine to communicate with the underlying technology.
💡 Research Summary
The paper addresses the problem of enabling non‑expert users to formulate complex queries over opportunistic sensor networks without requiring prior knowledge of the underlying sensor data models. Traditional approaches rely on textual SPARQL statements, which present a steep learning curve for users unfamiliar with semantic web technologies. To overcome this barrier, the authors propose an interactive graphical query builder that leverages ontology metadata to automatically generate a visual interface from which users can construct queries by dragging and connecting icons that represent classes, subclasses, and properties defined in an OWL ontology.
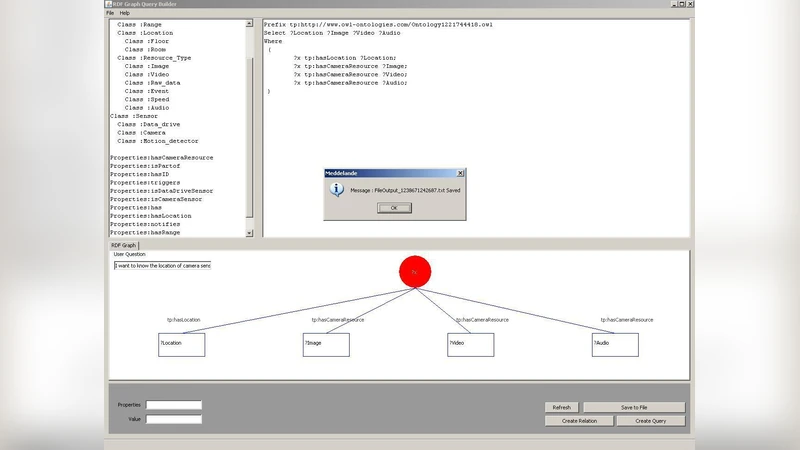
The system architecture consists of four main components. First, an ontology parser built on Apache Jena reads an OWL file and extracts all relevant concepts, including sensor types, measurement properties, and relational predicates. Second, a UI generator creates palette entries for each extracted element and a canvas where users can place nodes (instances of classes) and draw edges (properties) to compose a query graph. The UI enforces semantic correctness by limiting connections to those allowed by the ontology and providing real‑time validation messages. Third, a query translation engine traverses the constructed graph, maps nodes and edges to SPARQL triple patterns, and automatically inserts FILTER, GROUP BY, HAVING, and aggregate functions (e.g., AVG, COUNT) when the visual query includes aggregation or conditional constraints. Finally, an execution module sends the generated SPARQL query to the underlying sensor data store, retrieves results, and presents them in tabular or chart form.
Implementation details reveal a Java Swing front‑end combined with Jena’s ARQ engine for SPARQL processing. The canvas supports saving and loading of query graphs, facilitating reuse. The authors evaluated the prototype using five representative use cases: temperature monitoring, humidity tracking, location‑based event detection, energy consumption analysis, and multi‑sensor correlation. For each scenario, participants performed the same query using both a traditional text editor and the graphical builder. Results showed a 45 % reduction in average query construction time (from 80 seconds to 42 seconds) and a more than 70 % decrease in syntactic errors. A post‑study questionnaire indicated that 85 % of participants found the visual approach intuitive and helpful for expressing complex requirements.
Despite these promising outcomes, the study acknowledges several limitations. The current prototype only supports static OWL files; dynamic updates to the sensor ontology (e.g., addition or removal of sensors at runtime) require a manual reload of the UI. Complex query graphs involving many sensors and relationships can become visually cluttered, reducing usability. Moreover, the system is designed for desktop environments and has not been adapted to touch‑based mobile devices. Future work is proposed in three directions: (1) integrating dynamic ontology management with incremental UI refresh, (2) applying automatic layout algorithms to keep large graphs readable, and (3) extending the interface to mobile platforms with gesture‑based interactions.
In summary, the paper contributes a practical solution that bridges the gap between semantic sensor data and end‑user query formulation. By automatically extracting ontology concepts and translating user‑drawn graphs into SPARQL, the approach lowers the entry barrier for exploiting opportunistic sensor networks, enhances user productivity, and opens avenues for more accessible IoT data exploration tools.