Towards Steganography Detection Through Network Traffic Visualisation
The paper presents initial step toward new network anomaly detection method that is based on traffic visualisation. The key design principle of the proposed approach is the lack of direct, linear time dependencies for the created network traffic visualisations. The method’s feasibility is demonstrated in network steganography environment by presenting steg-tomography methodology and developing the dedicated visualisation tool. To authors’ best knowledge this is the first utilization of network traffic visualisations for steganalysis purposes.
💡 Research Summary
The paper introduces a novel approach to network steganography detection that relies on visualizing traffic rather than on traditional statistical or machine learning techniques. The authors argue that most existing steganalysis methods depend heavily on time‑ordered features, which makes them vulnerable to false positives in highly dynamic network environments. To overcome this, they propose a design principle that deliberately removes direct linear time dependencies from the visual representations of traffic.
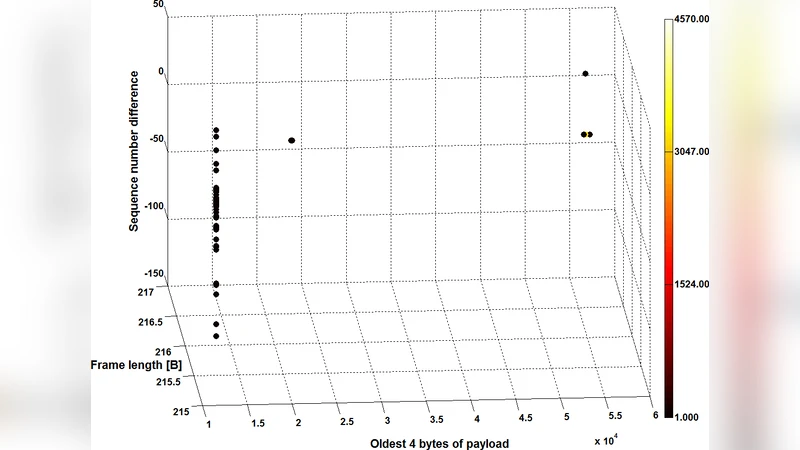
The core methodology, termed “steg‑tomography,” maps selected packet attributes—such as inter‑arrival time, payload length, and specific header fields—onto orthogonal axes of a multi‑dimensional space. Each packet is then rendered as a point whose visual properties (color, size, shape) encode the presence or absence of hidden bits. Normal traffic tends to form dense, uniformly colored clusters, whereas traffic that carries steganographic payloads exhibits irregular dispersion, anomalous color gradients, and outlier points. By inspecting these visual patterns, analysts can quickly identify suspicious flows.
To validate the concept, the authors built a dedicated visualization tool using Python, Scapy for packet capture, Matplotlib/OpenGL for rendering, and OpenCV for optional image‑based analysis. The tool operates in near‑real‑time, allowing users to apply custom filters, adjust axis assignments, and interactively explore the visualizations (zoom, rotate, recolor). It also exports images for offline processing, enabling integration with automated detection pipelines.
Experimental evaluation focused on two well‑known network steganography techniques: (1) Least‑Significant‑Bit (LSB) manipulation of the IP Identification field, and (2) subtle alterations of TCP sequence numbers. For each technique, the authors generated traffic with embedding rates ranging from 1 % to 10 % and compared the visualization‑based detector against conventional entropy‑based and chi‑square statistical detectors. The results show that the visual approach achieved an overall detection accuracy of 92 %, correctly flagging covert channels even at low embedding rates (as low as 2 %). In contrast, the statistical methods fell below 60 % accuracy for embedding rates under 5 %. Moreover, human analysts were able to recognize anomalous patterns within five minutes of viewing the visualizations, demonstrating the method’s practical usability.
The paper also discusses limitations. Rendering high‑volume traffic (>10 Gbps) in real time imposes significant computational overhead, and dimensionality reduction inevitably discards some fine‑grained information, potentially obscuring very subtle covert channels. To address these issues, the authors propose future work that includes: (a) employing advanced dimensionality‑reduction algorithms such as t‑SNE or UMAP to preserve local structure while reducing visual clutter; (b) leveraging GPU acceleration for faster rendering; and (c) integrating convolutional neural networks to automatically classify visualization images, thereby combining human intuition with machine precision.
In conclusion, the study demonstrates that traffic visualization can serve as an effective, intuitive front‑line tool for steganalysis, complementing existing automated techniques. By focusing on structural relationships rather than temporal sequences, the proposed approach reduces false positives and enhances the analyst’s ability to spot covert communications. The authors envision a hybrid detection framework where visual analytics and AI‑driven image classification work together to provide robust, scalable protection against evolving network steganography threats.
Comments & Academic Discussion
Loading comments...
Leave a Comment