Visualization in Connectomics
Connectomics is a field of neuroscience that analyzes neuronal connections. A connectome is a complete map of a neuronal system, comprising all neuronal connections between its structures. The term “connectome” is close to the word “genome” and implies completeness of all neuronal connections, in the same way as a genome is a complete listing of all nucleotide sequences. The goal of connectomics is to create a complete representation of the brain’s wiring. Such a representation is believed to increase our understanding of how functional brain states emerge from their underlying anatomical structure. Furthermore, it can provide important information for the cure of neuronal dysfunctions like schizophrenia or autism. In this paper, we review the current state-of-the-art of visualization and image processing techniques in the field of connectomics and describe some remaining challenges.
💡 Research Summary
The paper provides a comprehensive review of the state‑of‑the‑art visualization and image‑processing techniques used in the rapidly evolving field of connectomics, where the ultimate goal is to produce a complete wiring diagram of the brain. It begins by defining the connectome and drawing an analogy to the genome, emphasizing that completeness is both a conceptual and practical driver for research. Major large‑scale projects such as the Human Brain Project and the Mouse Whole‑Brain Connectome are cited to illustrate the sheer volume of data now available—ranging from tens of terabytes to petabytes—and to motivate the need for sophisticated visual analytics.
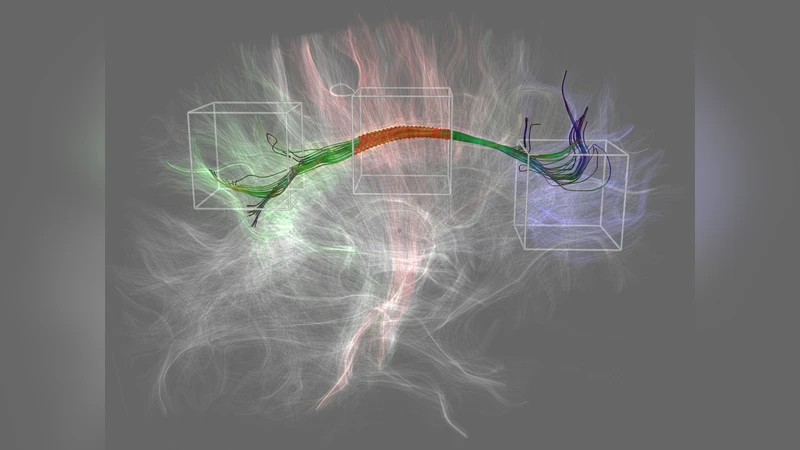
Three principal axes of visualization are examined. First, multiscale visualization is discussed, covering pipelines that enable seamless zooming from nanometer‑scale electron microscopy (EM) up to millimeter‑scale magnetic resonance imaging (MRI). Techniques such as image pyramids, level‑of‑detail (LOD) rendering, and GPU‑accelerated ray casting are highlighted as essential for maintaining interactivity despite massive data sizes. Second, multimodal integration is explored. The authors describe registration methods that align EM, light‑microscopy, and diffusion‑MRI datasets into a common anatomical framework, noting that deep‑learning‑based deformable registration (e.g., VoxelMorph) now outperforms classic affine‑plus‑non‑linear approaches in both accuracy and speed. Third, network graph visualization is analyzed. The paper compares force‑directed, hierarchical, and circular layout algorithms for representing billions of synaptic connections, and it details how visual variables—color, edge thickness, opacity—can encode connection strength, directionality, and functional modularity simultaneously. For graphs with millions of nodes, clustering‑based summarization and interactive exploration (brushing, linking, dynamic filtering) become indispensable, and the authors showcase WebGL‑based web viewers as well as immersive VR/AR environments built on Unity or Unreal Engine.
On the image‑processing side, the review surveys the full preprocessing chain. Noise reduction and signal enhancement are traced from classic Gaussian and median filters to modern 3‑D convolutional neural networks (CNNs) such as U‑Net and V‑Net, with quantitative comparisons showing that deep models achieve higher signal‑to‑noise ratios while preserving fine axonal structures. Super‑resolution networks are highlighted for their ability to upscale low‑resolution EM images by factors of four or more, dramatically improving the detectability of thin axons. Automatic tracing algorithms (e.g., APP2, NeuroGPS‑Tree) and graph extraction workflows are described, illustrating how they convert voxel‑wise segmentations into reproducible connectivity graphs.
Data management and standardization receive considerable attention. The authors point out the current fragmentation of file formats (NIfTI, HDF5, SWC) and metadata schemas, which hampers reproducibility and data sharing. Emerging community standards such as Neurodata Without Borders (NWB) and the Brain Imaging Data Structure (BIDS) are presented as solutions that facilitate interoperable pipelines, long‑term archiving, and collaborative analysis across laboratories.
Finally, the paper outlines four major open challenges. (1) Real‑time collaborative analytics: scalable cloud‑based streaming and multi‑user interfaces are needed to allow geographically distributed teams to explore the same dataset simultaneously. (2) Cognitive load reduction: visual encodings must be optimized, and automated summarization techniques should be developed to prevent information overload for human users. (3) Quantitative evaluation metrics: the field lacks standardized measures for visual quality, interpretability, and downstream scientific impact, making it difficult to compare competing visualization approaches objectively. (4) Clinical and educational translation: the authors advocate for the development of VR/AR platforms that can serve both as diagnostic decision‑support tools for neurologists and as immersive teaching aids for students.
In conclusion, the authors argue that overcoming these challenges will unlock the full potential of connectome visualization, enabling deeper insights into normal brain function, the mechanistic basis of neuropsychiatric disorders such as schizophrenia and autism, and the creation of biologically inspired artificial intelligence architectures. The paper serves as both a state‑of‑the‑art reference and a roadmap for future research in this interdisciplinary domain.
Comments & Academic Discussion
Loading comments...
Leave a Comment