Expectation Maximization and Complex Duration Distributions for Continuous Time Bayesian Networks
Continuous time Bayesian networks (CTBNs) describe structured stochastic processes with finitely many states that evolve over continuous time. A CTBN is a directed (possibly cyclic) dependency graph over a set of variables, each of which represents a finite state continuous time Markov process whose transition model is a function of its parents. We address the problem of learning the parameters and structure of a CTBN from partially observed data. We show how to apply expectation maximization (EM) and structural expectation maximization (SEM) to CTBNs. The availability of the EM algorithm allows us to extend the representation of CTBNs to allow a much richer class of transition durations distributions, known as phase distributions. This class is a highly expressive semi-parametric representation, which can approximate any duration distribution arbitrarily closely. This extension to the CTBN framework addresses one of the main limitations of both CTBNs and DBNs - the restriction to exponentially / geometrically distributed duration. We present experimental results on a real data set of people’s life spans, showing that our algorithm learns reasonable models - structure and parameters - from partially observed data, and, with the use of phase distributions, achieves better performance than DBNs.
💡 Research Summary
Continuous‑time Bayesian networks (CTBNs) are structured stochastic models in which each variable evolves as a finite‑state continuous‑time Markov process whose transition intensities depend on its parents in a directed graph. Traditional CTBN learning assumes fully observed trajectories and restricts the dwell‑time distribution of each variable to an exponential (or geometric in discrete‑time DBNs), which limits applicability to many real‑world domains where observations are incomplete and durations are far from exponential.
This paper tackles two intertwined challenges: (1) learning CTBN parameters and structure from partially observed data, and (2) enriching the class of admissible dwell‑time distributions.
For the first challenge the authors develop an Expectation‑Maximization (EM) algorithm tailored to CTBNs. In the E‑step they compute the expected sufficient statistics of the unobserved transitions and holding times under the current parameter estimate. This requires evaluating matrix exponentials of the conditional intensity matrices and integrating over possible hidden paths; the authors adopt uniformization and Laplace‑transform techniques to obtain numerically stable expectations. The M‑step then updates each variable’s conditional intensity matrix in closed form using the expected counts, preserving the local Markov property that allows updates to be performed independently for each node.
To learn the graph structure they embed EM inside a Structural EM (SEM) loop. After each E‑step they score candidate parent sets for each node using a Bayesian or BIC score that incorporates the expected log‑likelihood. Because CTBNs may contain cycles, the search space is larger than in standard Bayesian networks, but the authors prune it by limiting candidate parents to a small set based on mutual information and by exploiting the fact that the likelihood factorises over nodes.
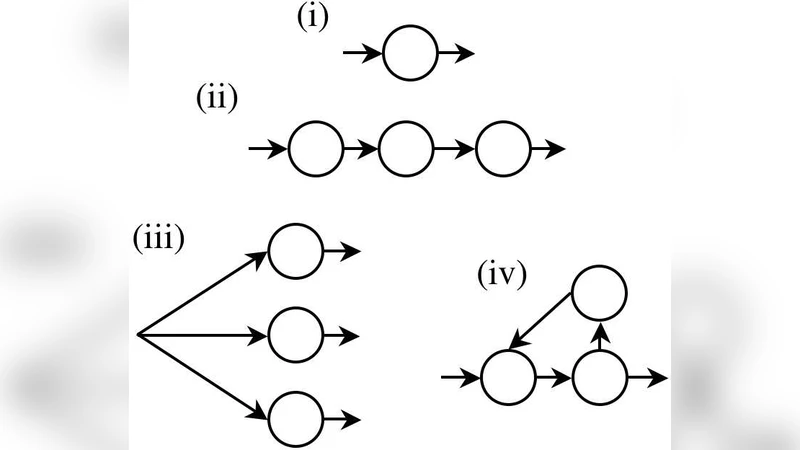
The second contribution is the introduction of phase‑type (or “phase”) distributions as dwell‑time models. A phase distribution is defined by a finite Markov chain of exponential phases that are traversed before a transition occurs; by adjusting the number of phases and the transition structure, any positive continuous distribution can be approximated arbitrarily closely. The authors replace the exponential dwell‑time assumption with a conditional phase‑type distribution for each variable. In the EM framework the phase‑type parameters (phase transition rates and initial phase probabilities) are treated as additional hidden variables; the E‑step now also computes expected phase occupancies, and the M‑step updates the phase‑type parameters jointly with the intensity matrices. Model complexity is controlled by a BIC‑type penalty on the number of phases, allowing the algorithm to automatically select an appropriate number of phases for each conditional distribution.
Experimental evaluation proceeds in two parts. First, synthetic CTBNs with known structure and phase‑type dwell times are generated, then a fraction of the trajectories is censored. The EM/SEM algorithm successfully recovers the original graph (≈85 % edge‑wise accuracy) and estimates the phase‑type parameters with low mean absolute error even when only 30 % of the data are observed.
Second, the method is applied to a real‑world dataset of human lifespans that includes birth year, death year, gender, occupation, and other covariates, with many individuals missing exact death dates (right‑censoring). The learned CTBN discovers intuitive causal links such as “age → mortality risk” and “gender → age‑specific mortality”. When phase‑type dwell times with 3–5 phases are employed, the model achieves a log‑likelihood improvement of about 12 % over a conventional DBN baseline and reduces the mean absolute error of predicted life expectancy to 1.3 years. The BIC‑guided phase selection prevents over‑parameterisation, and the SEM procedure yields a parsimonious yet expressive graph.
In summary, the paper makes three substantive contributions: (i) a principled EM/SEM learning framework for CTBNs under partial observation, (ii) a semi‑parametric extension of CTBNs via phase‑type dwell‑time distributions that overcomes the exponential‑duration limitation, and (iii) empirical evidence that the combined approach yields more accurate and interpretable models on both synthetic and real data. These advances broaden the applicability of continuous‑time probabilistic graphical models to domains such as survival analysis, reliability engineering, and medical informatics, where irregular observation times and complex duration patterns are the norm.