Matrix plots of reordered bistochastized transaction flow tables: A United States intercounty migration example
We present a number of variously rearranged matrix plots of the $3, 107 \times 3, 107$ 1995-2000 (asymmetric) intercounty migration table for the United States, principally in its bistochasticized form (all 3,107 row and column sums iteratively proportionally fitted to equal 1). In one set of plots, the counties are seriated on the bases of the subdominant (left and right) eigenvectors of the bistochastic matrix. In another set, we use the ordering of counties in the dendrogram generated by the associated strong component hierarchical clustering. Interesting, diverse features of U. S. intercounty migration emerge–such as a contrast in centralized, hub-like (cosmopolitan/provincial) properties between cosmopolitan “Sunbelt” and provincial “Black Belt” counties. The methodologies employed should also be insightful for the many other diverse forms of interesting transaction flow-type data–interjournal citations being an obvious, much-studied example, where one might expect that the journals Science, Nature and PNAS would display “cosmopolitan” characteristics.
💡 Research Summary
The paper investigates the structure of the United States inter‑county migration network for the period 1995‑2000, which consists of a 3,107 × 3,107 asymmetric origin‑destination matrix. The authors first set the diagonal to zero (interpreted as either intra‑county moves or people who stay) and then apply iterative proportional fitting (also known as double‑standardization or bistochastization) so that every row and every column sums to one. This scaling removes the influence of county size, leaving only relative interaction odds while preserving cross‑product ratios.
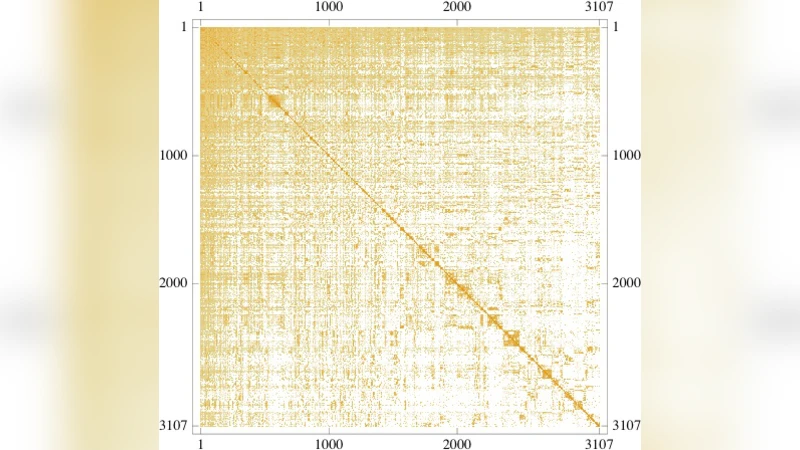
After bistochastization, the dominant eigenvalue of the matrix is 1 with a uniform eigenvector, which carries no informative content. The authors therefore focus on the sub‑dominant eigenvalue (≈ 0.906253) and its left (in‑migration) and right (out‑migration) eigenvectors. By ordering rows and columns according to the left eigenvector they obtain Figure 3; ordering by the right eigenvector yields Figure 4. Both reordered matrices show a dramatic reduction of the strong diagonal clustering seen in the raw data and instead reveal a division of the nation into two large blocks, suggesting that migration is organized around a set of “hub” counties that exchange migrants nationally and a complementary set of more “provincial” counties whose flows are mostly local.
To capture higher‑order structure, the authors apply strong‑component hierarchical clustering, a directed‑graph analogue of single‑linkage clustering. This produces a 38‑page dendrogram that orders the 3,107 counties. Reordering the bistochastic matrix according to this dendrogram (Figure 5) makes the hub‑provincial dichotomy visually explicit. The first twelve counties in the ordering are all from Sunbelt states (Florida, southern California, Arizona, Nevada, Texas) and are interpreted as “cosmopolitan” hubs that both receive and send migrants across the country. The last thirty‑five counties lie mainly in the Deep South’s “Black Belt” (Mississippi, Alabama, Georgia, Florida) and are labeled “provincial” because their migration is largely confined within the region.
The authors also experiment with Mathematica’s DirectAgglomerate command, which assumes a symmetric dissimilarity matrix. Applying it to the (symmetrized) bistochastic matrix and to its transpose yields Figures 8 and 9, respectively. Although the exact ordering changes, the overall hub‑provincial split persists, confirming the robustness of the observed pattern.
Statistical validation is performed by computing Pearson correlations between the various orderings (administrative alphabetical, eigenvector‑based, dendrogram‑based, and the two Mathematica clusterings). Correlations above 0.0353 are significant at the 95 % level; the correlations among the data‑driven orderings are all well below 0.08, indicating that the traditional administrative ordering bears essentially no relationship to the migration‑based structures uncovered.
The paper argues that the combination of bistochastization, sub‑dominant eigenvector seriation, and strong‑component hierarchical clustering provides a powerful visual and analytical toolkit for any transaction‑flow data where row and column totals are not of primary interest. The authors point to inter‑journal citation networks as a natural analogue, hypothesizing that high‑impact journals such as Science, Nature, and PNAS would occupy hub positions similar to the Sunbelt counties identified here.
In conclusion, the study demonstrates that after removing size effects, the US inter‑county migration matrix exhibits a clear bimodal organization: a small set of cosmopolitan hub counties with nationwide reach, and a larger set of provincial counties with locally constrained flows. This insight is obscured in raw or alphabetically ordered matrices but becomes evident through the presented methodological pipeline, offering valuable guidance for policymakers, demographers, and researchers interested in the spatial dynamics of human mobility and other directed flow networks.
Comments & Academic Discussion
Loading comments...
Leave a Comment