Visualizing dimensionality reduction of systems biology data
One of the challenges in analyzing high-dimensional expression data is the detection of important biological signals. A common approach is to apply a dimension reduction method, such as principal component analysis. Typically, after application of such a method the data is projected and visualized in the new coordinate system, using scatter plots or profile plots. These methods provide good results if the data have certain properties which become visible in the new coordinate system and which were hard to detect in the original coordinate system. Often however, the application of only one method does not suffice to capture all important signals. Therefore several methods addressing different aspects of the data need to be applied. We have developed a framework for linear and non-linear dimension reduction methods within our visual analytics pipeline SpRay. This includes measures that assist the interpretation of the factorization result. Different visualizations of these measures can be combined with functional annotations that support the interpretation of the results. We show an application to high-resolution time series microarray data in the antibiotic-producing organism Streptomyces coelicolor as well as to microarray data measuring expression of cells with normal karyotype and cells with trisomies of human chromosomes 13 and 21.
💡 Research Summary
The paper addresses the difficulty of extracting biologically meaningful signals from high‑dimensional expression data, a problem that often limits the utility of single dimension‑reduction techniques such as principal component analysis (PCA). To overcome this limitation, the authors present SpRay, a visual‑analytics pipeline that integrates a suite of linear (PCA, ICA) and non‑linear (MDS, t‑SNE, Isomap) dimensionality‑reduction methods within a unified framework.
SpRay’s distinguishing feature is its systematic quantification of each reduction result. It automatically computes reconstruction error, explained variance, and clustering quality metrics (silhouette score, Davies‑Bouldin index, etc.) and visualizes these measures through heat‑maps, bar charts, and scatter plots. In addition, functional annotations (Gene Ontology, KEGG, Reactome) are linked to the reduced coordinates, allowing users to see which biological pathways dominate particular components or clusters.
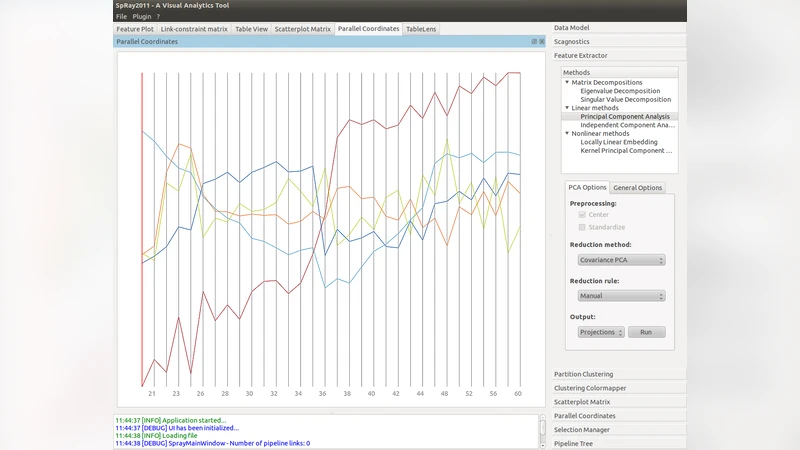
The authors demonstrate the system on two biologically distinct data sets. The first is a high‑resolution time‑series microarray of the antibiotic‑producing bacterium Streptomyces coelicolor. While PCA alone captures about 60 % of the total variance, it fails to separate subtle transcriptional transitions associated with antibiotic biosynthesis. Adding ICA reveals independent signals that highlight specific metabolic pathways, and a non‑linear t‑SNE projection uncovers distinct clusters of biosynthetic genes that are invisible in the linear space. This multi‑method approach clarifies the temporal progression of the transcriptional program and identifies gene groups that drive antibiotic production.
The second case study compares normal human cells with cells carrying trisomies of chromosomes 13 and 21. PCA readily detects the global up‑regulation caused by the extra chromosome 21, with the first component explaining over 30 % of variance. However, chromosome 13‑related effects are not evident in the PCA space. ICA and MDS expose a separate dimension where genes affected by trisomy 13 form a coherent cluster, enabling the authors to link this cluster to specific metabolic and developmental pathways.
SpRay’s interactive user interface lets analysts adjust algorithmic parameters (e.g., t‑SNE perplexity, distance metrics for MDS) on the fly, select individual points to view detailed metadata, and instantly see how functional annotations change with the projection. Results can be exported in vector formats (SVG, PDF) for seamless inclusion in publications or presentations.
In summary, SpRay transforms dimensionality reduction from a purely exploratory compression step into a comprehensive analytical platform that couples quantitative evaluation with biological interpretation. By facilitating the parallel use of multiple reduction techniques, it captures both linear and non‑linear structures in the data, mitigates the risk of missing important signals, and accelerates hypothesis generation in systems biology.
Comments & Academic Discussion
Loading comments...
Leave a Comment