Spectral mixture analysis of EELS spectrum-images
Recent advances in detectors and computer science have enabled the acquisition and the processing of multidimensional datasets, in particular in the field of spectral imaging. Benefiting from these new developments, earth scientists try to recover the reflectance spectra of macroscopic materials (e.g., water, grass, mineral types…) present in an observed scene and to estimate their respective proportions in each mixed pixel of the acquired image. This task is usually referred to as spectral mixture analysis or spectral unmixing (SU). SU aims at decomposing the measured pixel spectrum into a collection of constituent spectra, called endmembers, and a set of corresponding fractions (abundances) that indicate the proportion of each endmember present in the pixel. Similarly, when processing spectrum-images, microscopists usually try to map elemental, physical and chemical state information of a given material. This paper reports how a SU algorithm dedicated to remote sensing hyperspectral images can be successfully applied to analyze spectrum-image resulting from electron energy-loss spectroscopy (EELS). SU generally overcomes standard limitations inherent to other multivariate statistical analysis methods, such as principal component analysis (PCA) or independent component analysis (ICA), that have been previously used to analyze EELS maps. Indeed, ICA and PCA may perform poorly for linear spectral mixture analysis due to the strong dependence between the abundances of the different materials. One example is presented here to demonstrate the potential of this technique for EELS analysis.
💡 Research Summary
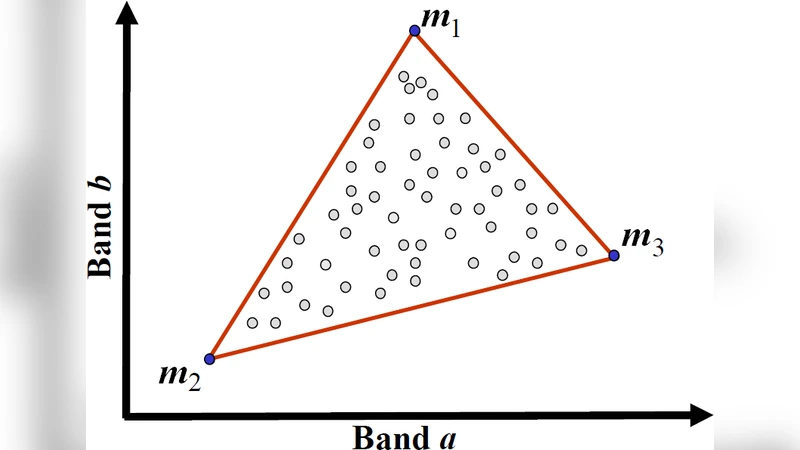
The paper demonstrates that a spectral unmixing (SU) algorithm, originally developed for remote‑sensing hyperspectral imagery, can be transferred effectively to the analysis of electron energy‑loss spectroscopy (EELS) spectrum‑images. The authors begin by outlining the linear mixing model that underpins most unmixing techniques: each observed pixel spectrum S(λ) is expressed as a weighted sum of a small set of pure component spectra (endmembers) E_i(λ) plus noise, with the weights (abundances or “abundances”) constrained to be non‑negative and to sum to one. These constraints give the solution a clear physical interpretation, something that is lacking in more generic multivariate methods such as principal component analysis (PCA) or independent component analysis (ICA).
In the context of EELS, a pixel records the energy‑loss distribution of electrons that have traversed a nanometer‑scale region of the specimen. Because the beam interacts with all atoms present, the resulting spectrum is naturally a mixture of the loss signatures of several elements, oxidation states, and bonding environments. Traditional EELS data reduction has relied on PCA to reduce dimensionality or ICA to separate statistically independent sources. However, PCA components are orthogonal linear combinations that rarely correspond to actual material spectra, making quantitative interpretation difficult. ICA assumes statistical independence among sources, an assumption that breaks down when the abundances of different phases are correlated—as is common in mixed nanostructures.
The authors therefore adopt a two‑stage SU workflow. First, endmember extraction is performed using geometrical algorithms such as Vertex Component Analysis (VCA) or N‑FINDR, which locate the extreme points of the data cloud in the high‑dimensional spectral space. These extreme points are taken as initial estimates of the pure material spectra. Second, the abundances for every pixel are estimated by solving a fully constrained least‑squares (FCLS) problem that minimizes the reconstruction error while enforcing the non‑negativity and sum‑to‑one constraints. The FCLS problem is solved efficiently using Lagrange multipliers or projection onto the feasible simplex.
To validate the method, the authors acquire a high‑resolution EELS spectrum‑image of a composite nanomaterial consisting of metallic cores, oxide shells, and an organic coating. The dataset comprises several thousand pixels and a few hundred energy channels. SU identifies three endmembers that correspond closely to the known loss edges of the metal, the oxide, and the organic component. The resulting abundance maps clearly delineate pure regions, mixed interfaces, and gradual compositional gradients. In contrast, PCA yields only two or three principal components that are linear mixtures without direct physical meaning, while ICA suffers from instability and produces components that are either overly sparse or contaminated by other phases. Moreover, the SU approach proves robust to the relatively high noise level typical of EELS, automatically driving the abundances of irrelevant endmembers toward zero.
The paper also discusses the limitations of the linear mixing assumption. In cases where non‑linear interactions such as plasmon coupling, multiple scattering, or strong energy‑dependent cross‑sections dominate, the linear model may misrepresent the true physics. The authors suggest extensions such as kernel‑based non‑linear unmixing, Bayesian abundance estimation, or deep‑learning‑driven endmember discovery to address these scenarios. Computational scalability is another concern; the authors note that GPU acceleration and parallel processing can make SU tractable for the large datasets now common in modern electron microscopes.
In conclusion, the study provides a compelling proof‑of‑concept that spectral unmixing, a staple of remote‑sensing analytics, can be repurposed for nanoscale chemical imaging with EELS. By delivering physically interpretable endmember spectra and quantitative abundance maps, SU overcomes the interpretational ambiguities of PCA and ICA and opens new avenues for precise compositional mapping in materials science, nanotechnology, and related fields.
Comments & Academic Discussion
Loading comments...
Leave a Comment