The Simulation and Mapping of Building Performance Indicators based on European Weather Stations
Due to the climate change debate, a lot of research and maps of external climate parameters are available. However, maps of indoor climate performance parameters are still lacking. This paper presents a methodology for obtaining maps of performances of similar buildings that are virtually spread over whole Europe. The produced maps are useful for analyzing regional climate influence on building performance indicators such as energy use and indoor climate. This is shown using the Bestest building as a reference benchmark. An important application of the mapping tool is the visualization of potential building measures over the EU. Also the performances of single building components can be simulated and mapped. It is concluded that the presented method is efficient as it takes less than 15 minutes to simulate and produce the maps on a 2.6GHz/4GB computer. Moreover, the approach is applicable for any type of building.
💡 Research Summary
The paper addresses a notable gap in the current body of climate‑related research: while extensive maps exist for external climate variables across Europe, comparable spatial visualizations of indoor building performance indicators are largely absent. To fill this void, the authors develop a rapid, scalable methodology that virtually places a standardized reference building—the “Bestest” benchmark—at every European weather station and then simulates its annual energy consumption, heating and cooling loads, and indoor temperature and humidity characteristics.
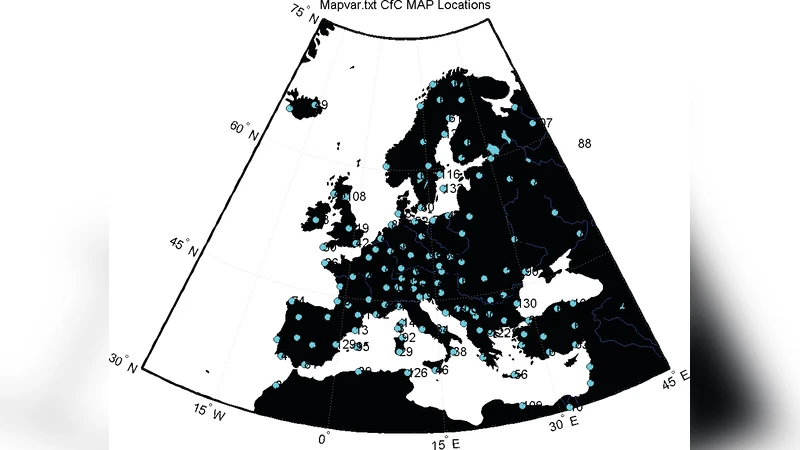
Data acquisition begins with the extraction of long‑term (typically 30‑year) climatological records (outdoor temperature, relative humidity, solar radiation, wind speed, etc.) from publicly available sources such as the European Climate Assessment & Dataset (ECA&D) and the European Centre for Medium‑Range Weather Forecasts (ECMWF). These datasets are pre‑processed to align with the input format required by EnergyPlus, a widely used dynamic building simulation engine. The Bestest building model, which conforms to the International Energy Agency’s (IEA) BESTEST protocol, is configured with a fixed envelope, HVAC system, internal loads, and occupancy schedule. By keeping the building definition constant, the only variable influencing simulation outcomes is the local climate data supplied for each station.
The simulation pipeline runs each weather file through EnergyPlus, producing a suite of performance metrics: annual heating energy demand (kWh), annual cooling energy demand (kWh), mean indoor temperature, temperature deviation from comfort bands, and indoor relative humidity statistics. The authors emphasize computational efficiency: on a modest 2.6 GHz processor with 4 GB RAM, the entire workflow—data ingestion, 5,000+ individual EnergyPlus runs, and post‑processing—completes in under 15 minutes. This speed is achieved by parallelizing the runs and by limiting the model to the essential Bestest parameters, thereby avoiding the extensive calibration steps typical of detailed building simulations.
Post‑simulation, the results are imported into a Geographic Information System (GIS) environment. Each performance indicator is rendered as a thematic layer using a color gradient that reflects magnitude (e.g., darker blues for higher heating demand). Users can toggle layers, overlay multiple indicators, or query specific stations for detailed numeric outputs. The resulting maps clearly illustrate regional trends: northern and central Europe exhibit higher heating loads, while southern Mediterranean locations show elevated cooling demands. Moreover, the maps reveal zones where indoor temperature stability is poor, suggesting that the default HVAC sizing in the Bestest model may be sub‑optimal for those climates.
A key contribution of the study is the demonstration of “component‑level mapping.” By modifying a single building element—such as increasing wall insulation thickness, upgrading to high‑performance glazing, or altering ventilation rates—the authors rerun the simulations and generate new maps that visualize the spatial distribution of potential energy savings or comfort improvements. This capability enables stakeholders to evaluate the geographic efficacy of retrofit measures before committing resources, supporting evidence‑based policy making at the EU level.
The authors acknowledge several limitations. First, the use of a single, generic building archetype does not capture the diversity of real‑world building typologies, occupancy behaviors, or construction practices across Europe. Second, the reliance on long‑term average climate data overlooks extreme weather events (heatwaves, cold snaps) that can dominate peak loads and affect resilience assessments. Third, the study does not incorporate future climate projections, which would be essential for long‑term planning. The paper suggests future work should integrate multiple building prototypes, stochastic weather generators, and climate change scenarios to enhance realism and predictive power.
In conclusion, the paper presents an efficient, reproducible framework for mapping indoor building performance across a continental scale. By coupling a standardized building model with high‑resolution weather data and rapid simulation tools, the authors produce actionable visualizations that can guide regional energy‑efficiency strategies, retrofit prioritization, and climate‑adaptation policies. The methodology’s low computational demands and adaptability to any building type make it a valuable addition to the toolbox of architects, engineers, policymakers, and researchers concerned with sustainable built environments in a changing climate.