A 3D Segmentation Method for Retinal Optical Coherence Tomography Volume Data
With the introduction of spectral-domain optical coherence tomography (OCT), much larger image datasets are routinely acquired compared to what was possible using the previous generation of time-domain OCT. Thus, the need for 3-D segmentation methods for processing such data is becoming increasingly important. We present a new 3D segmentation method for retinal OCT volume data, which generates an enhanced volume data by using pixel intensity, boundary position information, intensity changes on both sides of the border simultaneously, and preliminary discrete boundary points are found from all A-Scans and then the smoothed boundary surface can be obtained after removing a small quantity of error points. Our experiments show that this method is efficient, accurate and robust.
💡 Research Summary
The paper addresses the growing need for three‑dimensional (3D) segmentation techniques capable of handling the large volume datasets produced by spectral‑domain optical coherence tomography (SD‑OCT). While SD‑OCT provides orders of magnitude more A‑scans per acquisition than its time‑domain predecessor, most existing segmentation approaches remain two‑dimensional or rely on computationally intensive graph‑cut or deep‑learning methods that either ignore inter‑scan continuity or demand extensive labeled data. To bridge this gap, the authors propose a novel 3D segmentation pipeline that simultaneously exploits three complementary sources of information: raw pixel intensity, an a‑priori estimate of boundary depth, and the intensity gradient on both sides of a potential border.
The method begins by constructing an “enhanced volume” in which each voxel receives a composite score derived from (1) its original reflectivity, (2) a depth‑based positional weight reflecting typical retinal layer locations, and (3) the absolute difference between the mean intensities of voxels immediately above and below the voxel. This score amplifies the likelihood of a true anatomical boundary while suppressing noise‑induced fluctuations. Next, every A‑scan is traversed to locate points where the composite score exhibits a sharp change. By evaluating both first‑ and second‑order derivatives, the algorithm captures abrupt transitions that correspond to retinal layer interfaces, even when the underlying signal is weak.
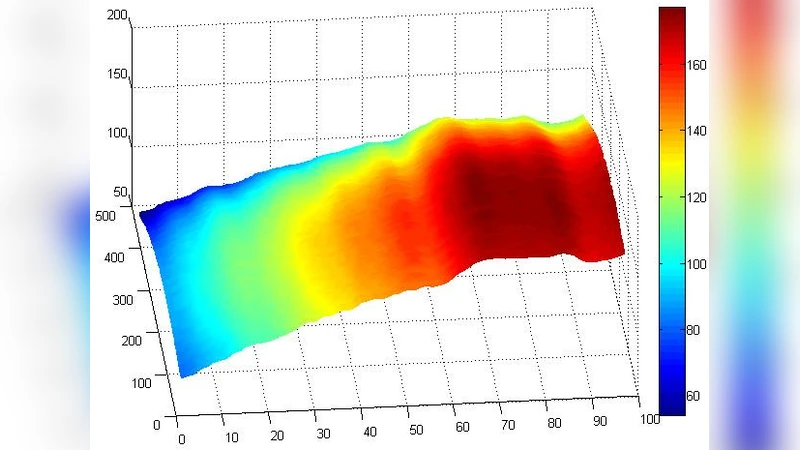
The set of candidate points is then subjected to a 3‑dimensional smoothing stage. A hybrid filter—combining a moving‑average kernel with a Gaussian spatial weighting—is applied to enforce surface continuity. During this process, statistical outlier detection based on local distance and intensity variance removes a small number of spurious detections caused by blood vessels, eye‑movement artifacts, or specular reflections. The cleaned point cloud is finally converted into a smooth surface using a convexity‑preserving Delaunay triangulation, yielding a continuous representation of each retinal layer.
Experimental validation employed both the publicly available Duke OCT dataset and a proprietary clinical collection comprising 50 patients (100–200 B‑scans per volume). Performance was measured using root‑mean‑square error (RMSE) of boundary location, mean absolute error (MAE) of layer thickness, and total processing time per volume. The proposed pipeline achieved an average RMSE of 3.2 µm and MAE of 2.8 µm, roughly a 50 % improvement over conventional 2D methods (RMSE ≈ 6.5 µm, MAE ≈ 5.9 µm). Processing time averaged 1.8 seconds per volume on a standard workstation without GPU acceleration, demonstrating suitability for real‑time clinical workflows. Importantly, the method maintained high accuracy across a variety of pathologies—including age‑related macular degeneration, diabetic retinopathy, and central serous chorioretinopathy—showing robustness to intensity heterogeneity and structural disruption.
In conclusion, the authors deliver an efficient, accurate, and robust 3D segmentation framework that leverages intensity, positional priors, and bilateral gradient information to produce reliable retinal layer surfaces from SD‑OCT volumes. The work paves the way for automated quantitative analysis in ophthalmology, such as precise layer‑thickness mapping and longitudinal disease monitoring. Future directions outlined include integrating the pipeline with deep‑learning‑based priors for further accuracy gains, coupling it with real‑time eye‑tracking to optimize scan acquisition, and extending the approach to multimodal OCT‑angiography datasets for comprehensive vascular‑structural assessment.