SaVi: satellite constellation visualization
SaVi, a program for visualizing satellite orbits, movement, and coverage, is maintained at the University of Surrey. This tool has been used for research in academic papers, and by industry companies designing and intending to deploy satellite constellations. It has also proven useful for demonstrating aspects of satellite constellations and their geometry, coverage and movement for educational and teaching purposes. SaVi is introduced and described briefly here.
💡 Research Summary
SaVi (Satellite Visualization) is an open‑source software package developed and maintained at the University of Surrey that provides three‑dimensional, real‑time visualisation of satellite constellations, their orbital motion, and ground‑coverage footprints. The paper introduces SaVi, outlines its design objectives, describes its architecture and core functionalities, and illustrates how it has been employed in academic research, industry projects, and educational settings.
The motivation section explains the gap between high‑cost commercial orbit analysis tools (often used by defence and space agencies) and the need for an inexpensive, accessible visualisation platform for universities, small companies, and teaching environments. SaVi addresses this gap by being freely available under the GNU GPL, supporting standard orbit data formats (TLE, custom parameter files) and offering both a graphical user interface (GUI) and a scriptable API.
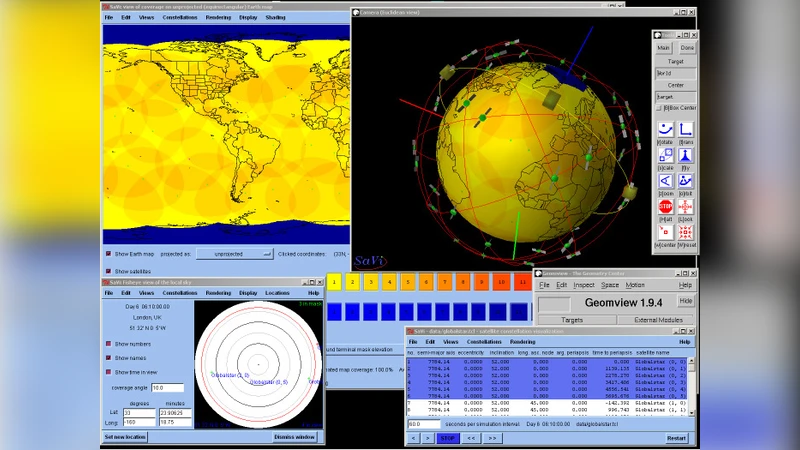
The system architecture is divided into four main layers: data ingestion, orbit propagation, rendering engine, and user interaction. Input modules parse Two‑Line Element (TLE) files or user‑defined orbital parameters. Propagation uses the SGP4/SDP4 models to compute satellite position and velocity vectors as a function of time, delivering latitude, longitude, altitude, and additional state information such as orbital period and Earth‑center distance. The propagation core is written in C++ and leverages a high‑precision numerical library to achieve real‑time performance.
Rendering is performed with OpenGL. The Earth is displayed as a textured sphere, while satellites appear as icons or simple 3‑D models moving along their calculated trajectories. Coverage footprints are projected onto the globe using a basic free‑space loss model combined with user‑specified antenna gain patterns; the footprints are drawn as circles or ellipses whose colour and opacity encode signal strength and overlap (service redundancy). SaVi can simultaneously render multiple orbital planes, Walker, polar, elliptical, or hybrid constellations, allowing users to observe inter‑satellite geometry and coverage dynamics at a glance.
The GUI provides time‑control sliders, play/pause buttons, and selection panels that let users pause the simulation, inspect individual satellite ephemerides, and query coverage statistics for any ground location. The script interface (available via Tcl/Tk or Python bindings) enables batch runs, automated image or video generation, and integration with external tools such as STK, GMAT, or MATLAB. Data export in CSV, KML, and GeoJSON formats facilitates downstream analysis and report preparation.
Three representative use cases are presented. In academic research, SaVi serves as a rapid‑prototype environment for testing new constellation designs; researchers can quickly iterate on orbital parameters, visualise coverage maps, and embed high‑quality figures in publications. In industry, satellite manufacturers and service providers use SaVi during early‑stage design to evaluate ground‑station placement, assess service continuity, and perform cost‑effective trade‑studies before committing to expensive commercial simulators. In education, instructors employ SaVi in lectures and labs to demonstrate orbital mechanics, ground‑track evolution, and coverage concepts; students can manipulate parameters in real time and directly observe the impact on visibility windows and overlapping footprints, reinforcing theoretical concepts with visual intuition.
The paper also discusses current limitations. SaVi’s propagation and rendering are CPU‑bound, which can become a bottleneck when simulating constellations with thousands of satellites. The built‑in radio‑propagation model is simplified and does not capture complex atmospheric effects, multipath, or frequency‑dependent attenuation required for high‑frequency (Ka‑band) system studies. Future work outlined includes GPU‑accelerated propagation, cloud‑based distributed simulation, and integration of more sophisticated propagation standards such as ITU‑R P.525.
In conclusion, SaVi provides a cost‑effective, extensible, and user‑friendly platform for visualising satellite orbits and coverage. Its open‑source nature, support for standard data formats, and dual GUI/script interfaces make it valuable across research, commercial design, and teaching, filling a niche that high‑priced commercial tools cannot address for many users.
Comments & Academic Discussion
Loading comments...
Leave a Comment