On the Influence of the Data Sampling Interval on Computer-Derived K-Indices
The K index was devised by Bartels et al. (1939) to provide an objective monitoring of irregular geomagnetic activity. The K index was then routinely used to monitor the magnetic activity at permanent magnetic observatories as well as at temporary stations. The increasing number of digital and sometimes unmanned observatories and the creation of INTERMAGNET put the question of computer production of K at the centre of the debate. Four algorithms were selected during the Vienna meeting (1991) and endorsed by IAGA for the computer production of K indices. We used one of them (FMI algorithm) to investigate the impact of the geomagnetic data sampling interval on computer produced K values through the comparison of the computer derived K values for the period 2009, January 1st to 2010, May 31st at the Port-aux-Francais magnetic observatory using magnetic data series with different sampling rates (the smaller: 1 second; the larger: 1 minute). The impact is investigated on both 3-hour range values and K indices data series, as a function of the activity level for low and moderate geomagnetic activity.
💡 Research Summary
The paper investigates how the temporal resolution of geomagnetic observations influences computer‑derived K‑indices, which are the standard quantitative measure of irregular geomagnetic activity originally introduced by Bartels et al. (1939). With the proliferation of digital, often unattended observatories and the establishment of the INTERMAGNET network, the production of K‑indices by automated algorithms has become a central issue. In 1991, during the Vienna meeting, the International Association of Geomagnetism and Aeronomy (IAGA) endorsed four algorithms for this purpose; the authors selected the FMI (Frederiksberg Magnetic Institute) algorithm, one of the most widely used, to conduct a systematic study of sampling‑interval effects.
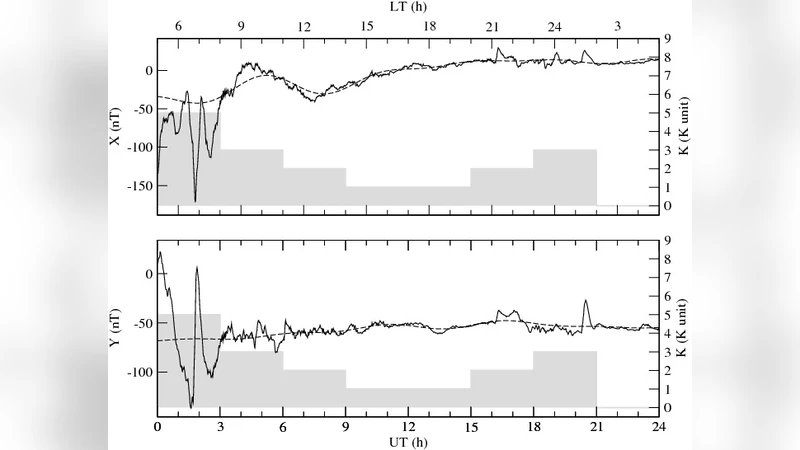
Data were taken from the Port‑aux‑Français magnetic observatory for the period 1 January 2009 – 31 May 2010. Two parallel time series were prepared: a high‑resolution series sampled at 1 second and a down‑sampled series at 1 minute. Both series underwent identical preprocessing (baseline removal, secular variation correction, coordinate transformation) to ensure that any differences in the derived K‑indices could be attributed solely to the sampling interval.
The FMI algorithm proceeds by dividing each 3‑hour window into eight 20‑minute blocks, determining the maximum and minimum values of the horizontal components (H and D) within each block, and selecting the largest range among the blocks as the representative 3‑hour range. This range is then mapped onto a predefined set of class boundaries (e.g., 0–5 nT → K0, 5–10 nT → K1, …, 500–600 nT → K9). The authors applied this procedure to both the 1‑second and 1‑minute data sets, generating parallel K‑index time series.
The analysis was stratified by geomagnetic activity level. During low‑activity periods (K ≤ 2), the 1‑second and 1‑minute series produced virtually identical K‑indices; the agreement rate exceeded 98 % and the mean 3‑hour range differed by less than 5 %. This reflects the fact that, when variations are modest, the loss of high‑frequency information does not materially affect the computed range. In contrast, during moderate activity (K = 3–5) the differences became pronounced. The 1‑second data yielded average 3‑hour ranges about 12 % larger than those derived from 1‑minute data, and the K‑indices diverged in roughly 15 % of the intervals. Notably, during rapid storm‑onset phases the 1‑second series captured transient spikes that were smoothed out in the 1‑minute series, leading to K‑index upgrades of up to one full level (e.g., K4 in the high‑resolution series versus K3 in the low‑resolution series).
Statistical correlation between the two K‑index series was high (r ≈ 0.96), yet residual analysis revealed a systematic, activity‑dependent bias: the discrepancy grew non‑linearly with increasing range. This is consistent with the logarithmic mapping of range to K‑class, whereby small absolute differences in range can translate into whole‑class jumps at higher activity levels.
The authors discuss the practical implications of these findings. For real‑time space‑weather monitoring and alert generation, a 1‑second sampling interval is clearly advantageous, as it improves sensitivity to sudden geomagnetic disturbances that may have operational consequences for power grids, navigation, and satellite systems. For long‑term climatological studies, however, 1‑minute data have historically been sufficient, and the existing historical K‑index archives are based on such resolutions. Transitioning to high‑resolution derived K‑indices would therefore require careful re‑calibration to maintain continuity with legacy records.
In conclusion, the study demonstrates that the sampling interval is a critical parameter in the automated computation of K‑indices, especially during periods of moderate to high geomagnetic activity. The authors recommend adopting at least a 1‑second sampling rate for new observatories and suggest that the INTERMAGNET community consider revising its standard sampling protocol accordingly. They also call for the development of correction models that can reconcile high‑resolution K‑indices with the extensive historical 1‑minute‑based datasets, ensuring both forward‑looking accuracy and backward compatibility.
Comments & Academic Discussion
Loading comments...
Leave a Comment