Empirical estimation of entropy functionals with confidence
This paper introduces a class of k-nearest neighbor ($k$-NN) estimators called bipartite plug-in (BPI) estimators for estimating integrals of non-linear functions of a probability density, such as Shannon entropy and R\'enyi entropy. The density is a…
Authors: Kumar Sricharan, Raviv Raich, Alfred O. Hero III
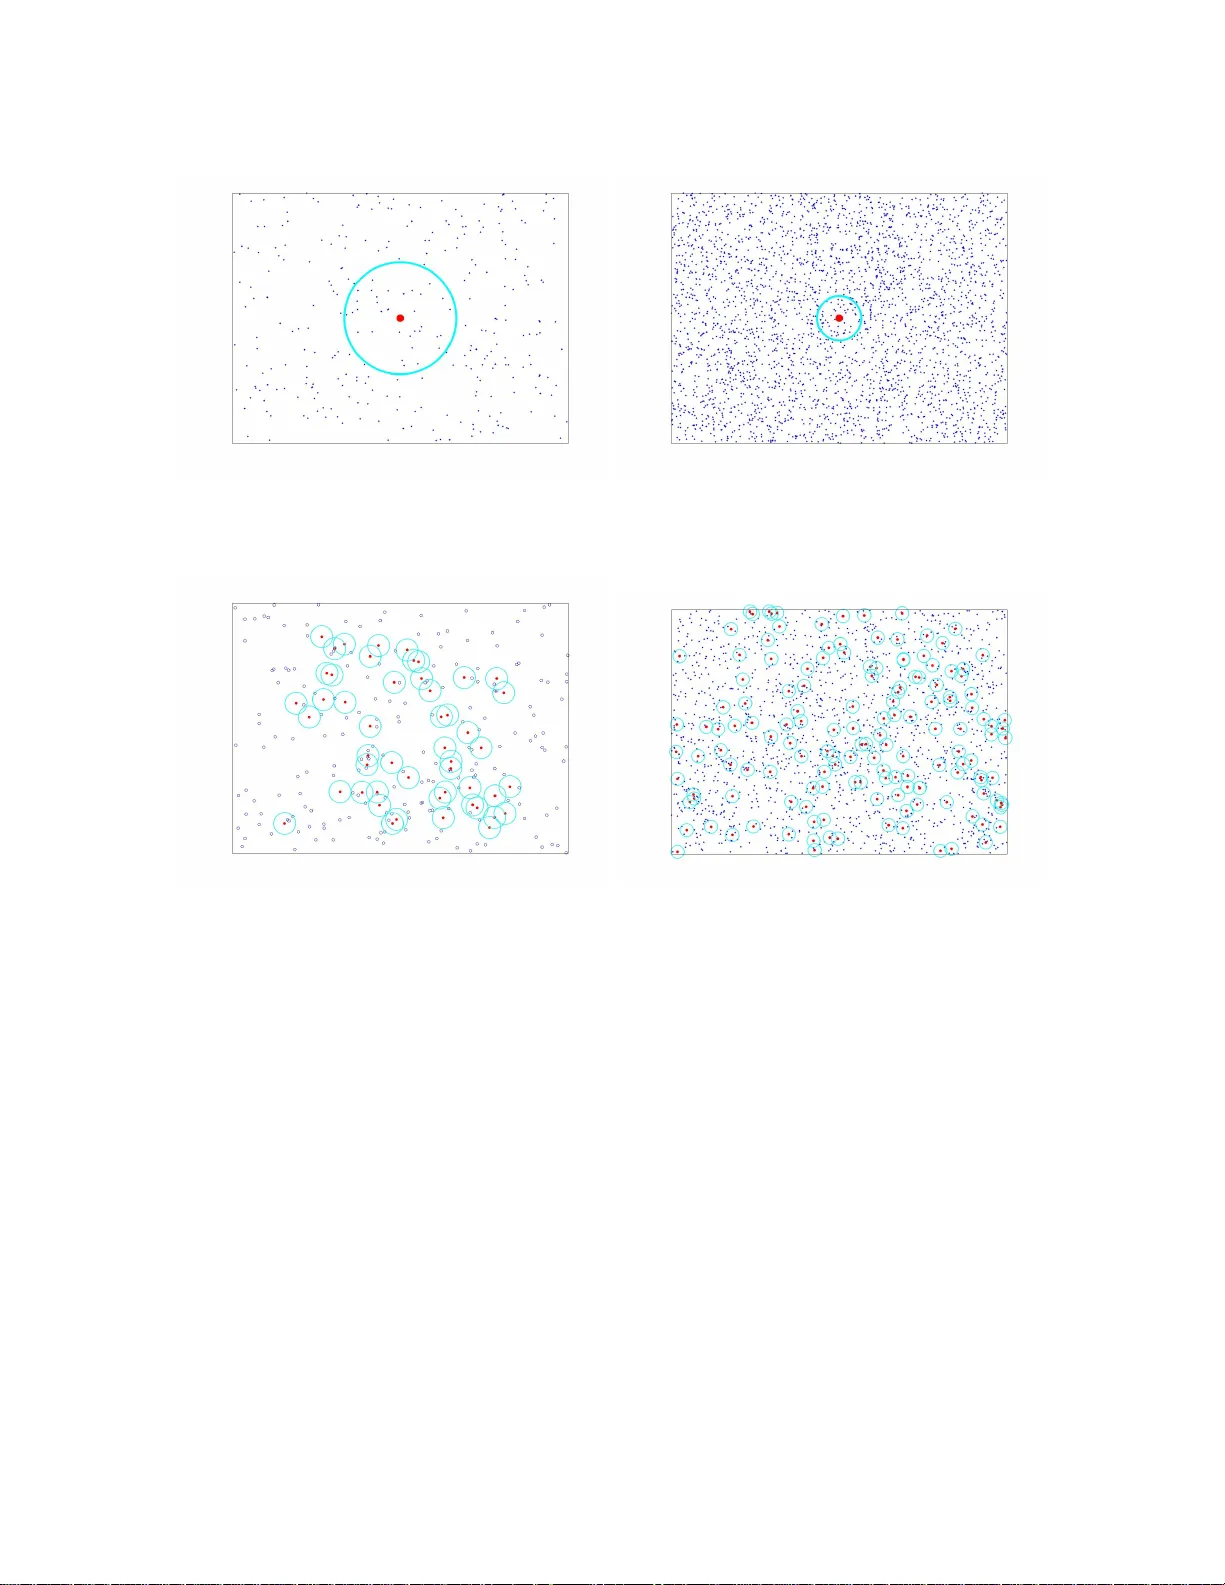
Empirical estimation of en trop y functionals with confidence Kumar Sric haran , Departmen t of EECS, Univ ersit y of Mic higan Ra viv Raic h , Sc ho ol of EECS, Oregon State Universit y Alfred O. Hero I I I , Department of EECS, Universit y of Michigan F ebruary 25, 2011 Abstract This pap er introduces a class of k-nearest neigh b or ( k -NN) estimators called bi- partite plug-in (BPI) estimators for estimating in tegrals of non-linear functions of a probabilit y density , such as Shannon en tropy and R ´ en yi entrop y . The density is as- sumed to b e smo oth, ha v e b ounded supp ort, and b e uniformly b ounded from b elow on this set. Unlik e previous k -NN estimators of non-linear density functionals, the prop osed estimator uses data-splitting and boundary correction to achiev e lo w er mean square error. Sp ecifically , we assume that T i.i.d. samples X i ∈ R d from the densit y are split in to tw o pieces of cardinality M and N respectively , with M samples used for computing a k-nearest-neighbor densit y estimate and the remaining N samples used for empirical estimation of the integral of the density functional. By studying the statistical prop erties of k-NN balls, explicit rates for the bias and v ariance of the BPI estimator are derived in terms of the sample size, the dimension of the samples and the underlying probability distribution. Based on these results, it is p ossible to sp ecify optimal c hoice of tuning parameters M /T , k for maximizing the rate of decrease of the mean square error (MSE). The resultan t optimized BPI estimator con v erges faster and ac hieves lo wer mean squared error than previous k -NN entrop y estimators. In addition, a central limit theorem is established for the BPI estimator that allo ws us to sp ecify tigh t asymptotic confidence interv als. 1 In tro duction Non-linear functionals of a m ultiv ariate density f of the form R g ( f ( x ) , x ) f ( x ) dx arise in applications including machine learning, signal pro cessing, mathematical statistics, and stat- istical communication theory . Imp ortant examples of such functionals include Shannon and R ´ en yi entrop y . En trop y based applications for image matc hing, image registration and tex- ture classification are dev elop ed in [20, 34]. Entrop y functional estimation is fundamen tal 1 to indep enden t comp onen t analysis in signal pro cessing [32]. En tropy has also b een used in Internet anomaly detection [24] and data and image compression applications [23]. Sev- eral entrop y based nonparametric statistical tests ha v e b een developed for testing statistical mo dels including uniformity and normality [44, 10]. P arameter estimation metho ds based on entrop y ha ve b een dev elop ed in [7, 37]. F or further applications, see, for example, Leon- enk o etal [26]. In these applications, the functional of interest m ust b e estimated empirically from sample realizations of the underlying densities. Sev eral estimators of entrop y measures ha ve b een prop osed for general m ultiv ariate densities f . These include consistent estimators based on en tropic graphs [19, 36], gap estimators [43], nearest neigh b or distances [17, 26, 29, 45], k ernel densit y plug-in estimators [1, 11, 3, 18, 4, 16], Edgew orth appro ximations [21], conv ex risk minimization [35] and orthogonal pro jections [25]. The class of densit y-plug-in estimators considered in this pap er are based on k -nearest neigh- b or ( k -NN) distances and, more sp ecifically , bipartite k-nearest neighbor graphs ov er the random sample. The basic construction of the prop osed bipartite plug-in (BPI) estimator is as follows (see Sec. I I.A for a precise definition). Giv en a total of T data samples w e split the data in to t w o parts of size N and size M , N + M = T . On the part of size M a k -NN densit y estimate is constructed. The densit y functional is then estimated b y plugging the k -NN densit y estimate into the functional and approximating the in tegral by an empirical a verage ov er the remaining N samples. This can b e thought of as computing the estimator o ver a bipartite graph with the M density estimation no des connected to the N integral ap- pro ximating no des. The BPI estimator exploits a close relation b etw een densit y estimation and the geometry of proximit y neigh b orho o ds in the data sample. The BPI estimator is de- signed to automatically incorp orate b oundary correction, without requiring prior knowledge of the supp ort of the density . Boundary correction comp ensates for bias due to distorted k -NN neigh b orho o ds that o ccur for p oin ts near the b oundary of the densit y supp ort set. F urthermore, this b oundary correction is adaptive in that we ac hiev e the same MSE rate of con vergence that can b e attained using an oracle BPI estimator having knowledge of b ound- ary of the supp ort. Since the rate of con v ergence relates the num b er of samples T = N + M to the p erformance of the estimator, con v ergence rates hav e great practical utility . A statistical analysis of the bias and v ariance, including rates of conv ergence, is presen ted for this class of b oundary comp ensated BPI estimators. In addition, results on weak conv ergence (CL T) of BPI estimators are established. These results are applied to optimally select estimator tun- ing parameters M /T , k and to deriv e confidence in terv als. F or arbitrary smo oth functions g , we sho w that by choosing k increasing in T with order O ( T − 2 / (2+ d ) ), an optimal MSE rate of order O ( T − 4 / (2+ d ) ) is attained by the BPI estimator. F or certain sp ecific functions g including Shannon en tropy ( g ( u ) = log( u )) and R´ en yi entrop y ( g ( u ) = u α − 1 ), a faster MSE rate of order O (((log T ) 6 /T ) 4 /d ) is achiev ed by BPI estimators by correcting for bias. 2 1.1 Previous w ork on k -NN functional estimation The authors of [40, 17, 26, 29] prop ose k -NN estimators for Shannon entrop y ( g ( u ) = log ( u )) and R´ en yi entrop y( g ( u ) = u α − 1 ). Ev ans etal [13] consider p ositive moments of the k -NN dis- tances ( g ( u ) = u k , k ∈ N ). Recently , Baryshniko v etal [2] prop osed k -NN estimators for estim- ating f -div ergence R φ ( f 0 ( x ) /f ( x )) f ( x ) dx b etw een an unknown density f , from whic h sample realizations are a v ailable, and a known density f 0 . Because f 0 is kno wn, the f -divergence R φ ( f 0 ( x ) /f ( x )) f ( x ) dx is equiv alent to a entrop y functional R g ( f ( x ) , x ) dx for a suitable c hoice of g . W ang etal [45] dev elop ed a k -NN based estimator of R g ( f 1 ( x ) /f 2 ( x ) , x ) f 2 ( x ) dx when b oth f 1 and f 2 are unknown. The authors of these w orks [40, 17, 13, 45] sestablish that the estimators they prop ose are asymptotically unbiased and consistent. The authors of [29] analyze estimator bias for k -NN estimation of Shannon and R ´ en yi entrop y . F or smo oth functions g ( . ), Ev ans etal [12] sho w that the v ariance of the sums of these functionals of k -NN distances is b ounded by the rate O ( k 5 /T ). Baryshnik ov etal [2] impro ved on the results of Ev ans etal by determining the exact v ariance up to the leading term ( c k /T for some constant c k whic h is a function of k ). F urthermore, Baryshnik o v etal show that the entrop y estimator they prop ose conv erges weakly to a normal distribution. How ever, Baryshnik ov etal do not analyze the bias of the estimators, nor do they sho w that the estimators they prop ose are consisten t. Using the results obtained in this pap er, w e provide an expression for this bias in Section 4.4 and show that the optimal MSE for Baryshnik o v’s estimators is O ( T − 2 / (1+ d ) ). In con trast, the main contribution of this pap er is the analysis of a general class of BPI es- timators of smooth densit y functionals. W e pro vide asymptotic bias and v ariance expressions and a central limit theorem. The bipartite nature of the BPI estimator enables us to correct for bias due to truncation of k -NN neigh b orhoo ds near the b oundary of the supp ort set; a correction that do es not app ear straightforw ard for previous k -NN based entrop y estimat- ors. W e show that the BPI estimator is MSE consisten t and that the MSE is guaranteed to con verge to zero as T → ∞ and k → ∞ with a rate that is minimized for a sp ecific choice of k , M and N as a function of T . Therefore, the th us optimized BPI estimator can b e implemen ted without an y tuning parameters. In addition a CL T is established that can b e used to construct confidence in terv als to empirically assess the quality of the BPI estimator. Finally , our metho d of pro of is very general and it is likely that it can b e extended to kernel densit y plug-in estimators, f -divergence estimation and m utual information estimation. Another imp ortan t distinction b et ween the BPI estimator and the k -NN estimators of Shan- non and R´ en yi en trop y prop osed by the authors of [40, 17, 26] is that these latter estimators are consistent for finite k , while the prop osed BPI estimator requires the condition that k → ∞ for MSE conv ergence. By allowing k → ∞ , the BPI estimators of Shannon and R ´ en yi entrop y ac hieve MSE rate of order O (((log T ) 6 /T ) 4 /d ). This asymptotic rate is faster than the O ( T − 2 /d ) MSE con vergence rate [29] of the previous k -NN estimators [40, 17, 26] that use a fixed v alue of k . It is sho wn by sim ulation that BPI’s asymptotic p erformance adv an tages, predicted by our theory , also hold for small sample regimes. 3 1.2 Organization The remainder of the pap er is organized as follo ws. Section 2 form ulates the entrop y es- timation problem and in tro duces the BPI estimator. The main results concerning the bias, v ariance and asymptotic distribution of these estimators are stated in Section 3 and the con- sequences of these results are discussed. The proofs are given in the App endix. The MSE is analyzed in Section 4. W e discuss bias correction of the BPI estimator for the case of Shannon and R ´ enyi entrop y estimation in Section 5. Estimation of Shannon MI is briefly discussed in Section 6. W e n umerically v alidate our theory by simulation in Section 7. Applications to structure disco v ery and dimension estimation are discussed in Sections 8 and 9 resp ectiv ely . A conclusion is given in Section 10. Notation Bold face type will indicate random v ariables and random v ectors and regular t yp e face will b e used for non-random quantities. Denote the exp ectation op erator by the sym b ol E and conditional exp ectation giv en Z b y E Z . Also define the v ariance op erator as V [ X ] = E [( X − E [ X ]) 2 ] and the co v ariance operator as C ov [ X , Y ] = E [( X − E [ X ])( Y − E [ Y ])]. Denote the bias of an estimator b y B . 2 Preliminaries W e are in terested in estimating non-linear functionals G ( f ) of d -dimensional m ultiv ariate densities f with supp ort S , where G ( f ) has the form G ( f ) = Z g ( f ( x ) , x ) f ( x ) dµ ( x ) = E [ g ( f ( x ) , x )] , for some smooth function g ( f ( x ) , x ). Let B denote the b oundary of S . Here, µ denotes the Leb esgue measure and E denotes statistical exp ectation w.r.t density f . W e assume that i.i.d realizations { X 1 , . . . , X N , X N +1 , . . . , X N + M } are a v ailable from the density f . Neither f nor its supp ort set are known. The plug-in estimator is constructed using a data splitting approach as follo ws. The data is randomly sub divided into tw o parts X N = { X 1 , . . . , X N } and X M = { X N +1 , . . . , X N + M } of N and M p oints resp ectively . In the first stage, a b oundary comp ensated k -NN densit y estim- ator ˜ f k is estimated at the N p oints { X 1 , . . . , X N } using the M realizations { X N +1 , . . . , X N + M } . Subsequen tly , the N samples { X 1 , . . . , X N } are used to appro ximate the functional G ( f ) to obtain the basic Bipartite Plug-In (BPI) estimator: ˆ G N ( ˜ f k ) = 1 N N X i =1 g ( ˜ f k ( X i ) , X i ) . (1) 4 As the ab o v e estimator p erforms an av erage o ver the N v ariables X i of the function g ( ˜ f ( X i ) , X i ), whic h is estimated from the other M v ariables, this estimator can b e view ed as av eraging o ver the edges of a bipartite graph with N and M no des on its left and righ t parts. 2.1 Boundary comp ensated k -NN densit y estimator Since the probability densit y f is b ounded ab o v e, the observ ations will lie strictly on the in terior of the supp ort set S . Ho wev er, some observ ations that o ccur close to the b oundary of S will hav e k -NN balls that in tersect the b oundary . This leads to significant bias in the k -NN density estimator. In this section w e describ e a metho d that comp ensates for this bias. The metho d can b e interpreted as extrap olating the lo cation of the b oundary from extreme p oin ts in the sample and suitably reducing the volumes of their k -NN balls. Let d ( X , Y ) denote the Euclidean distance b etw een p oin ts X and Y and d k ( X ) denote the Euclidean distance b etw een a p oin t X and its k -th nearest neighbor amongst the M realizations X N +1 , .., X N + M . Define a ball with radius r centered at X : S r ( X ) = { Y : d ( X , Y ) ≤ r } . The k -NN region is S k ( X ) = { Y : d ( X , Y ) ≤ d k ( X ) } and the volume of the k -NN region is V k ( X ) = R S k ( X ) d Z . The standard k -NN densit y estimator [30] is defined as ˆ f k ( X ) = k − 1 M V k ( X ) . If a probabilit y density function has b ounded supp ort, the k -NN balls S k ( X ) centered at p oin ts X close to the b oundary may intersect with the b oundary B , or equiv alen tly S k ( X ) ∩ S c 6 = φ , where S c is the complement of S . As a consequence, the k -NN ball v olume V k ( X ) will tend to b e higher for p oints X close to the b oundary leading to significant bias of the k -NN density estimator. Let R k ( X ) corresp ond to the cov erage v alue (1+ p k ) k / M , i. e. , R k ( X ) = inf { r : R S r ( X ) f ( Z ) d Z = (1 + p k ) k / M } , where p k = √ 6 / ( k δ / 2 ) for some fixed δ ∈ (2 / 3 , 1). Define B C = N exp( − 3 k (1 − δ ) ) . Define N k ( X ) as the region corresp onding to the cov erage v alue (1 + p k ) k / M , i.e. N k ( X ) = { Y : d ( X , Y ) ≤ R k ( X ) } . Finally , define the in terior region S I S I = { X ∈ S : N k ( X ) ∩ S c = φ } . (2) W e show in App endix B that the bias of the standard k -NN densit y estimate is of order O (( k / M ) (2 /d ) ) for p oints X ∈ S I and is of order O (1) at p oints X ∈ S − S I . This motiv ates the following metho d for comp ensating for this bias. This comp ensation is done in t wo stages: (i) the set of in terior p oints I N ⊂ X N are iden tified using v ariation in k -nearest neigh b or distances in Algorithm 1 (see App endix B for details) and it is sho w that I N / ∈ S − S I with probabilit y 1 − O ( B C ); and (ii) the densit y estimator at p oints in B N = X N − I N are 5 0 0.1 0.2 0.3 0.4 0.5 0.6 0.7 0.8 0.9 1 0 0.1 0.2 0.3 0.4 0.5 0.6 0.7 0.8 0.9 1 N samples Boundary points Boundary pairs Figure 1: Detection of b oundary p oints using Algorithm 1 for 2d b eta distribution. corrected by extrap olating to the densit y estimates at interior p oin ts I N that are close to the b oundary p oints. W e emphasize that this nonparametric correction strategy do es not assume kno wledge ab out the support of the density f . F or eac h b oundary p oint X i ∈ B N , let X n ( i ) ∈ I N b e the in terior sample p oin t that is closest to X i . The corrected densit y estimator ˜ f k is defined as follows. ˜ f k ( X i ) = ˆ f k ( X i ) { X i ∈ I N } ˆ f k ( X n ( i ) ) { X i ∈ B N } (3) 3 Main results Let Z denote an indep endent realization drawn from f . Also, define Z − 1 ∈ S I to b e Z − 1 = arg min x ∈ S I d ( x, Z ). Define h ( X ) = Γ (2 /d ) (( d + 2) / 2) f − 2 /d ( X ) tr [ ∇ 2 ( f ( X ))]. Denote the n -th partial deriv ativ e of g ( x, y ) wrt x b y g ( n ) ( x, y ). Also, let g 0 ( x, y ) := g (1) ( x, y ) and g 00 ( x, y ) := g (2) ( x, y ). F or some fixed 0 < < 1, define p l = (( k − 1) / M )(1 − ) 0 and p u = (( k − 1) / M )(1 + ) ∞ . Also define 1 = 1 / ( c d D d ), where D is the diameter of the b ounded set S and define q l = (( k − 1) / M ) 1 and q u = (1 + ) ∞ . Let p b e a b eta random v ariable with parameters k , M − k + 1. 3.1 Assumptions ( A . 0) : Assume that M , N and T are linearly related through the prop ortionalit y constant α f r ac with: 0 < α f r ac < 1, M = α f r ac T and N = (1 − α f r ac ) T . ( A . 1) : Let the densit y f b e uniformly b ounded aw a y from 0 and finite on the set S , i.e., there exist constants 0 , ∞ suc h 6 0 0.2 0.4 0.6 0.8 1 0 0.1 0.2 0.3 0.4 0.5 0.6 0.7 0.8 0.9 1 Partition samples X 1 ,..,X N Partition samples X N+1 ,..,X N+M Interior neighborhoods Original k−NN boundary neighborhoods Corrected boundary neighborhoods Figure 2: k -NN balls centered around a subsample of 2d uniformly distributed p oints. Note that the original k -NN balls centered at p oints close to b oundary (red) o ver spill the b oundary . The mo dified k -NN neigh b orho o ds (black) corresp onding to the corrected corrected density estimate ˜ f k comp ensate for the ov er spill. that 0 < 0 ≤ f ( x ) ≤ ∞ < ∞ ∀ x ∈ S . ( A . 2): Assume that the density f has contin uous partial deriv atives of order 2 ν in the in terior of the set S where ν satisfies the condition ( k / M ) 2 ν /d = o (1 / M ), and that these deriv atives are upp er b ounded. ( A . 3): Assume that the function g ( x, y ) has λ partial deriv atives w.r.t. x , where λ satisfies the conditions k − λ = o (1 / M ) and O (( λ 2 (( k / M ) 2 /d + 1 / M )) / M ) = o (1 / M ). ( A . 4): Assume that max { 6 , 2 λ } < k < = M . ( A . 5): Assume that the absolute v alue of the functional g ( x, y ) and its partial deriv ativ es are strictly b ounded aw ay from ∞ in the range 0 < x < ∞ for all y . ( A . 6): Assume that sup x ∈ ( q l ,q u ) | ( g ( r ) /r !) 2 ( x, y ) | e − 3 k (1 − δ ) < ∞ , E [sup x ∈ ( p l ,p u ) | ( g ( r ) /r !) 2 ( x/ p , y ) | ] < ∞ , for r = 3 , λ . 3.2 Bias and V ariance Belo w the asymptotic bias and v ariance of the BPI estimator of general functionals of the densit y f are sp ecified. These asymptotic forms will b e used to establish a form for the asymptotic MSE. 7 Theorem 3.1. The bias of the BPI estimator ˆ G k ( f ) is given by B [ ˆ G N ( ˜ f k )] = c 1 k M 2 /d + c 2 1 k + c 3 ( k , M , N ) + O ( B C ) + o 1 k + k M 2 /d ! , wher e c 3 ( k , M , N ) = E [1 { Z ∈ S − S I } ( g ( f ( Z − 1 ) , Z − 1 ) − g ( f ( Z ) , Z ))] = O ( k / M ) 2 /d , and the c on- stants c 1 = E [ g 0 ( f ( Z ) , Z ) h ( Z )] , c 2 = E [ f 2 ( Z ) g 00 ( f ( Z ) , Z ) / 2] . Theorem 3.2. The varianc e of the BPI estimator ˆ G N ( ˜ f k ) is given by V [ ˆ G N ( ˜ f k )] = c 4 1 N + c 5 1 M + O ( B C ) + o 1 M + 1 N , wher e the c onstants c 4 = V [ g ( f ( Z ) , Z )] and c 5 = V [ f ( Z ) g 0 ( f ( Z ) , Z )] . Pr o of. W e briefly sk etch the pro of here. The abov e theorems ha v e b een stated more generally and prov ed in App endix D. The principal idea here inv olv es T aylor series expansions of the functional g ( ˜ f k ( X ) , X ) ab out the true v alue g ( f ( X ) , X ), and subsequently (a) using the momen t prop erties of densit y estimates derived in App endix A to obtain the leading terms, and (b) b ounding the remainder term in the T aylor series and showing that it can b e ignored in comparison to the leading terms. The leading terms c 1 ( k / M ) 2 /d + c 2 /k arise due to the bias and v ariance of k -NN density estimates resp ectiv ely (see App endix A), while the term c 3 ( k , M , N ) arises due to b oundary correction (see App endix B). Henceforth, we will refer to c 3 ( k , M , N ) by c 3 . It is shown in App endix B that c 3 = O (( k / M ) 2 /d ) (130). The term O ( B C ) arises from a concentration inequalit y that giv es the probabilit y of the even t I N / ∈ S − S I as 1 − O ( B C ). Observ e that if k increases logarithmically in M , sp ecifically (log( M )) 2 / (1 − δ ) /k → 0, then O ( B C ) = o ( N / M 3 ) = o (1 /T ). The term c 4 / N is due to approximation of the in tegral R g ( f ( x ) , x ) f ( x ) dx by the sample mean (1 / N ) P N i =1 g ( f ( X i ) , X i ). The term c 5 / M on the other hand is due to the co v ariance b et w een densit y estimates ˜ f ( X i ) and ˜ f ( X j ), i 6 = j . The constants c 2 , c 4 and c 5 are once again functionals of the form R ˜ g ( f ( x ) , x ) f ( x ) dµ ( x ) and can b e estimated using the prop osed BPI estimator (1). On the other hand, the constan t c 1 requires estimation of second order partial deriv ativ es of f in addition to estimating the densit y f . The partial deriv ativ es migh t b e estimated using the metho ds describ ed in [38], c 1 could in principle b e estimated in this manner. T o estimate c 3 , w e observe that || Y − Y − 1 || = O (( k / M ) 1 /d ) with probability 1 − O ( N C ( k )), and that P r ( Y ∈ S − S I ) = O (( k / M ) 1 /d ). Let h = Y − Y − 1 . Then, c 3 = E [1 { Y ∈ S − S I } ( g ( f ( Y − 1 ) , Y − 1 ) − g ( f ( Y ) , Y ))] = E [1 { Y ∈ S − S I } g 0 ( f ( Y − 1 ) , Y − 1 )( f ( Y ) − f ( Y − 1 ))] + O (( k / M ) 3 /d ) + O ( C ( k )) = E [1 { X 1 ∈ S − S I } g 0 ( f ( Y − 1 ) , Y − 1 ) < ∇ f ( Y − 1 ) , h > ] + O (( k / M ) 3 /d ) + O ( C ( k )) . 8 The constan t c 3 can then b e estimated as ˆ c 3 = (1 / N ) X X i ∈ B N g 0 ( ˆ f k ( X n ( i ) ) , X n ( i ) ) < c ∇ f ( X n ( i ) ) , X i − X n ( i ) >, where the estimate c ∇ f of the gradien t ∇ f of f might once again b e estimated using the metho ds describ ed in [38]. 3.3 Cen tral limit theorem In addition to the results on bias and v ariance shown in the previous section, it is shown here that the BPI estimator, appropriately normalized, w eakly conv erges to the normal distribu- tion. The asymptotic b ehavior of the BPI estimator is studied under the following limiting conditions: (a) k / M → 0, (b) k → ∞ and (c) N → ∞ . As shorthand, the ab ov e limiting assumptions will b e collectiv ely denoted b y ∆ → 0. Theorem 3.3. The asymptotic distribution of the BPI estimator ˆ G N ( ˜ f k ) is given by lim ∆ → 0 P r ˆ G N ( ˜ f k ) − E [ ˆ G N ( ˜ f k )] q V [ ˆ G N ( ˜ f k )] ≤ α = P r ( S ≤ α ) , wher e S is a standar d normal r andom variable. Pr o of. Define the random v ariables { Y M ,i ; i = 1 , . . . , N } for any fixed M Y M ,i = g ( ˜ f k ( X i ) , X i ) − E [ g ( ˜ f k ( X i ) , X i )] q V [ g ( ˜ f k ( X i ) , X i )] , The k ey idea here is to recognize that Y M ,i are exc hangeable random v ariables. Blum et.al. [5] sho wed that for exc hangeable 0 mean, unit v ariance random v ariables Z i , the sum S N = 1 √ N P N i =1 Z i con verges in distribution to N (0 , 1) if and only if C ov ( Z 1 , Z 2 ) = 0 and C ov ( Z 2 1 , Z 2 2 ) = 0. In our case, C ov ( Y M ,i , Y M ,j ) = O (1 / M ) , C ov ( Y 2 M ,i , Y 2 M ,j ) = O (1 / M ) . As M gets large, we then hav e that C ov ( Y M ,i , Y M ,j ) → 0 and C ov ( Y 2 M ,i , Y 2 M ,j ) → 0. W e then extend the work b y Blum et.al. to show that conv ergence in distribution to N (0 , 1) holds in our case as b oth N and M get large. These ideas are rigorously treated in App endix E. The CL T for k -NN estimators of R´ en yi en tropy was alluded to b y Leonenk o et.al. [17] b y inferring from exp erimental results. Theorem 3.3 establishes the CL T for BPI estimators of arbitrary functionals, including R´ en yi en tropy . This result allo ws one to define approximate finite sample confidence interv als on the estimated v alues of the functionals and define p- v alues . 9 Figure 3: Asymptotics. V ariation of density estimate with increasing k and M Figure 4: Asymptotics. V ariation of plug-in estimate with increasing k , M and N 4 Analysis of M.S.E Theorem 3.1 implies that k → ∞ and k / M → 0 in order that the BPI estimator ˆ G N ( ˜ f k ) b e asymptotically un biased. Lik ewise, Theorem 3.2 implies that N → ∞ and M → ∞ in order that the v ariance of the estimator con verge to 0. It is clear from Theorem 3.1 that the MSE is minimized when k grows in polynomially in M . Throughout this section, we assume that k = k 0 M r for some r ∈ (0 , 1). This implies that O ( B C ) = O ( N C ( k )) = o (1 / M ) = o (1 /T ). Figures 3 and 4 illustrate the asymptotic b eha vior of the density estimate and the plug-in estimate with increasing sample size. 10 4.1 Assumptions Under the condition k = k 0 M r , the assumptions ( A . 2) and ( A . 3) reduce to the following equiv alen t conditions: ( A . 2): Let the density f ha v e contin uous partial deriv atives of order 2 r in the in terior of the set S where r satisfies the condition 2 r (1 − t ) /d > 1. ( A . 3): Let the functional g ( x, y ) hav e λ partial deriv ativ es w.r.t. x , where λ satisfies the conditions tλ > 1. 4.2 Optimal c hoice of parameters In this section, we obtain optimal v alues for k , M and N for minimum M.S.E. 4.2.1 Optimal c hoice of k Theorems I I I.1 and I I I.2 pro vide an optimal c hoice of k that minimizes asymptotic MSE. Minimizing the MSE o ver k is equiv alen t to minimizing the square of the bias ov er k . Define c o = c 1 + c 3 / ( k / M ) 2 /d . The optimal choice of k is given by k opt = arg min k B ( ˆ G N ( ˜ f k )) = b k 0 M 2 2+ d c , (4) where b x c is the closest integer to x , and the constant k 0 is defined as k 0 = ( | c 2 | d/ 2 | c 0 | ) d d +2 when c 0 c 2 > 0 and as k 0 = ( | c 2 | / | c 0 | ) d d +2 when c 0 c 2 < 0. Observ e that the constan ts c 0 and c 2 can p ossibly hav e opp osite signs. When c 0 c 2 > 0, the bias ev aluated at k opt is b + 0 M − 2 2+ d (1+ o (1)) where b + 0 = c 0 k 2 /d 0 + c 2 /k 0 . Let k f r ac = k 0 M 2 2+ d − k opt . When c 0 c 2 < 0, observe that c 0 (( k f r ac + k opt ) / M ) 2 /d + c 2 / ( k f r ac + k opt ) is equal to zero. When c 0 c 2 < 0, a higher order asymptotic analysis is required to sp ecify the bias at the optimal v alue of k . In particular, B ( ˆ G N ( ˜ f k )) = c 1 k M 2 /d + c 2 1 k + h 1 k M 4 /d + h 2 1 k 2 + h 3 k M 2 /d 1 k ! + o k M 4 /d + 1 k 2 + k M 2 /d 1 k ! where the constants are given by h 1 = E [(1 / 2) g 00 ( f ( Y )) h 2 ( X ) + g 0 ( f ( Y )) h o ( Y )] , h 2 = E [(2 / 3) g 000 ( f ( Y )) f 3 ( Y )] and h 3 = (1 − 2 /d ) E [ g 00 ( f ( Y )) f ( Y ) c ( Y )] . 11 The bias ev aluated at k opt is then giv en by b − 0 M − 4 2+ d (1 + o (1)) where the constan t b − 0 = h 1 k 4 /d 0 + ( h 2 + c 2 k f r ac ) /k 2 0 + ( h 3 + 2 c 1 k f r ac /d ) k 2 /d − 1 0 . Ev en though the optimal c hoice k opt dep ends on the unknown densit y f (via the constan t k 0 ), w e observ e from simulations that simply matching the rates, i.e. choosing k = ¯ k = M 2 / (2+ d ) , leads to significant MSE improv ement. This is illustrated in Section 7. 4.2.2 Choice of α f r ac = M /T Observ e that the MSE of ˆ G N ( ˜ f k ) is dominated by the squared bias ( O ( M − 4 / (2+ d ) )) as con- trasted to the v ariance ( O (1 / N + 1 / M )). This implies that the MSE rate of conv ergence is in v ariant to the c hoice of α f r ac . This is corrob orated by the exp erimental results sho wn in Fig. 12. 4.2.3 Discussion on optimal choice of k The optimal choice of k gro ws at a smaller rate as compared to the total num b er of samples M used for the densit y estimation step. F urthermore, the rate at which k / M grows decreases as the dimension d increases. This can b e explained by observing that the choice of k primarily con trols the bias of the en trop y estimator. F or a fixed choice of k and M ( k < M ), one expects the bias in the densit y estimates (and corresp ondingly in the estimates of the functional G ( f )) to increase as the dimension increases. F or increasing dimension an increasing num b er of the M p oin ts will b e near the b oundary of the supp ort set. This in turn requires choosing a smaller k relative to M as the dimension d gro ws. 4.3 Optimal rate of con v ergence Observ e that the optimal bias deca ys as b + 0 ( T − 2 2+ d )(1 + o (1)) when c 0 c 2 > 0 and b − o ( T − 4 2+ d )(1 + o (1)) when c 0 c 2 < 0. The v ariance decays as Θ(1 /T )(1 + o (1)). 4.4 Comparison with results b y Baryshnik o v etal Recen tly , Baryshniko v etal [2] ha ve developed asymptotic conv ergence results for estimators of f -div ergence G ( f 0 , f ) = R f ( x ) φ ( f 0 ( x ) /f ( x )) dx for the case where f 0 is known. Their estimators are based on sums of functionals of k -NN distances. They assume that they hav e T i.i.d realizations from the unknown density f , and that f and f 0 are b ounded a wa y from 0 and ∞ on their supp ort. The general form of the estimator of Baryshniko v etal is given by ˜ G N ( ˆ f kS ) = 1 T T X i =1 g ( ˆ f kS ( X i )) , 12 where ˆ f kS ( X i ) is the standard k -NN densit y estimator [31] estimated using the T − 1 s amples { X 1 , .., X T } − { X i } . Baryshnik ov etal do not sho w that their estimator is consistent and do not analyze the bias of their estimator. They show that the leading term in the v ariance is given b y c k /T for some constan t c k whic h is a function of the num b er of nearest neigh b ors k . Finally they show that their estimator, when suitably normalized, is asymptotically normal. In con trast, w e assume higher order conditions on contin uity of the densit y f and the functional g (see Section 3) as compared to Baryshnik o v etal and provide results on bias, v ariance and asymptotic distribution of data-split k -NN functional estimators of entropies of the form G ( f ) = R g ( f ( x )) f ( x ) dx . Note that we also require the assumption that f is b ounded a wa y from 0 and ∞ on its supp ort. Because w e are able to establish expressions on b oth the bias and v ariance of the BPI estimator, we are able to sp ecify optimal choice of free parameters k , N , M for minim um MSE. F or estimating the functional G ( f ) = R g ( f ( x )) f ( x ) dx , the estimator of Baryshnik ov can b e used by restricting f 0 to b e uniform. In App endix C it is shown that under the additional assumption that ( A . 6) is satisfied b y ˜ g = g , the bias of ˜ G N ( ˆ f kS ) is B ( ˜ G N ( ˆ f kS )) = O (( k /T ) 1 /d ) + O (1 /k ) . (5) In contrast, Theorem I I I. 1 establishes that the bias of the BPI estimator ˆ G N ( ˜ f k ) decays as Θ(( k / M ) 2 /d + 1 /k ) + O ( B C ) and the v ariance deca ys as Θ(1 /T ). The bias of the BPI estimator has a higher exp onent (2 /d as opp osed to 1 /d ) and this is a direct consequence of using the b oundary compensated densit y estimator ˜ f k in place of ˆ f k . It is clear from 5 that the estimator of Baryshnik ov will b e un biased iff k → ∞ as T → ∞ . F urthermore, the optimal rate of growth of k is giv en by k = T 1 / (1+ d ) . F urthermore, c k = Θ(1) and therefore the ov erall optimal bias and v ariance of ˜ G N ( ˆ f kS ) is given by Θ( T − 1 / (1+ d ) ) and Θ( T − 1 ) resp ectiv ely . On the other hand, the optimal bias of the BPI estimator decays as b + 0 ( T − 2 2+ d )(1 + o (1)) when c 1 c 2 > 0 and b − o ( T − 4 2+ d )(1 + o (1)) when c 1 c 2 < 0 and the optimal v ariance decays as Θ(1 /T ). The BPI estimator therefore has faster rate of MSE con ver- gence. Exp erimental MSE comparison of Baryshniko v’s estimator against the prop osed BPI estimator is shown in Fig. 12. 5 Bias correction factors When the density functional of interest is the Shannon en trop y ( g ( u ) = − log( u )) or the R ´ en yi - α entrop y( g ( u ) = u α − 1 ), a bias correction can b e added to the BPI estimator that accelerates rate of con v ergence. Goria et.al. [26] and Leonenko et.al. [17] developed consisten t Shannon and R ´ enyi estimators with bias correction. The authors of [29] analyzed the bias for these estimators. When combined with the results of Baryshniko v etal , one can easily deduce the v ariance of these estimators and establish a CL T. Let ˆ H S b e the Shannon en trop y estimate ˜ G N ( ˆ f kS ) with the c hoice of functional g ( x ) = 13 − log( x ). Let ˆ I α,S b e the estimate of the R ´ en yi α -integral estimate ˜ G N ( ˆ f kS ) with the c hoice of functional g ( x ) = x α − 1 . Define ˜ H S = ˆ H S + [log ( k − 1) − Ψ( k )], where ψ ( . ) is the digamma function, and ˜ I α,S = [(Γ( k + (1 − α )) / Γ( k ))( k − 1) α − 1 ] − 1 ˆ I α,S . Also define the R´ en yi en tropy estimator to b e ˜ H α,S = (1 − α ) − 1 log( ˜ I α,S ). The estimators ˜ H S and ˜ H α,S are the Shannon and R ´ en yi entrop y estimators of Goria etal [17] and Leonenk o etal [26] resp ectively . In [29], it is shown that the bias of ˜ H S and ˜ I α,S is given by Θ(( k /T ) 1 /d ), while the v ariance w as sho wn b y Baryshnik ov etal to b e O (1 /T ). In contrast, b y (5), the bias of ˆ H S and ˆ I α,S is given by Θ(( k /T ) 1 /d + (1 /k )) (5). This can b e understo o d as follo ws. F rom the results by [29], we ha ve E [ ˆ H S ] = I − [log( k − 1) − Ψ( k )] + c 0 , 0 ( k /T ) 1 /d + o (( k /T ) 1 /d ) (6) and E [ ˆ I α,S ] = [(Γ( k + (1 − α )) / Γ( k ))( k − 1) α − 1 ] I α + c 0 ,α ( k /T ) 1 /d + o (( k /T ) 1 /d ) (7) for some functionals of the densit y c 0 , 0 and c 0 ,α . Note that [(Γ( k + (1 − α )) / Γ( k ))( k − 1) α − 1 ] = 1 + O (1 /k ) and Ψ( k ) = log ( k − 1) + O (1 /k ) as k → ∞ . F rom the ab o ve equations, the scale factor [(Γ( k + (1 − α )) / Γ( k ))( k − 1) α − 1 ] and the additiv e factor [log ( k − 1) − Ψ( k )] accoun t for the O (1 /k ) terms in the expressions for bias of ˆ H S and ˆ I α,S , thereb y removing the requiremen t that k → ∞ for asymptotic unbiasedness. These bias corrections can b e incorp orated into the BPI estimator as follo ws. 5.1 Main results F or a general function g ( x, y ), if there exist functions g 1 ( k , M ) and g 2 ( k , M ), suc h that ( i ) E [ g (( k − 1) x/ M p , y )] = g ( x, y ) g 1 ( k , M ) + g 2 ( k , M ) + o (1 / M ) , ( ii ) (( k − 1) / M ) E [ g 0 (( k − 1) x/ M p , y ) p 2 /d − 1 ] = g 0 ( x, y )( k / M ) 2 /d + o (( k / M ) 2 /d ) , ( iii ) lim k →∞ g 1 ( k , M ) = 1 , ( iv ) lim k →∞ g 2 ( k , M ) = 0 , (8) then define the BPI estimator with bias correction as ˆ G N ,B C ( ˜ f k ) = ˆ G N ( ˜ f k ) − g 2 ( k , M ) g 1 ( k , M ) . (9) 5.1.1 Bias and V ariance In addition to the assumptions listed in section 3.1, assume that k = O ((log ( M )) 2 / (1 − δ ) ). Be- lo w the asymptotic bias and v ariance of the BPI estimator with bias correction are sp ecified. Theorem 5.1. The bias of the BPI estimator ˆ G N ,B C ( ˜ f k ) is given by B [ ˆ G N ,B C ( ˜ f k )] = c 1 k M 2 /d + c 3 ( k , M , N ) + o k M 2 /d ! . (10) 14 Theorem 5.2. The varianc e of the BPI estimator ˆ G N ,B C ( ˜ f k ) is given by V [ ˆ G N ,B C ( ˜ f k )] = c 4 1 N + c 5 1 M + o 1 M + 1 N . 5.1.2 CL T Theorem 5.3. The asymptotic distribution of the BPI estimator ˆ G N ,B C ( ˜ f k ) is given by lim ∆ → 0 P r ˆ G N ,B C ( ˜ f k ) − E [ ˆ G N ,B C ( ˜ f k )] q V [ ˆ G N ,B C ( ˜ f k )] ≤ α = P r ( S ≤ α ) , wher e S is a standar d normal r andom variable. 5.1.3 MSE Theorem IV. 1 sp ecifies the bias of the BPI estimator, ˆ G N ,B C ( ˜ f k ), as Θ(( k / M ) 2 /d ). Theorem IV. 2 sp ecifies the v ariance as Θ(1 / N + 1 / M ). By making k increase logarithmically in M , sp ecifically , k = O ((log ( M )) 2 / (1 − δ ) ) for an y v alue δ ∈ (2 / 3 , 1), the MSE is giv en by the rate Θ(((log( T )) 2 / (1 − δ ) /T ) 4 /d ). The BPI estimator therefore has a faster rate of con v ergence in comparison to b oth Baryshniko v etal ’s estimators ˆ H S and ˆ I α,S (MSE = Θ( T − 2 / (1+ d ) )) and Leonenk o etal ’s and Goria etal ’s estimators ˜ H S and ˜ I α,S (MSE = Θ( T − 2 /d )). Exp erimental MSE comparison of Leonenko’s estimator against the BPI estimator in Section V sho ws the MSE of the BPI estimator to b e significantly lo wer. Finally , note that suc h bias correction cannot b e applied for general en tropy functionals, and the bias correction factors cannot in general be incorp orated. In the next section, the application of BPI estimators for estimation of Shannon and R´ en yi en tropies is illustrated. 5.2 Shannon and R ´ en yi en trop y estimation F or the case of Shannon entrop y ( g ( u ) = − log ( u )), it can b e v erified that g 1 ( k , M ) = 1, g 2 ( k , M ) = ψ ( k ) − log( k − 1) satisfy (8). Similarly , for the case of R´ en yi entrop y ( g ( u ) = u α − 1 ), g 1 ( k , M ) = (Γ( k ) / Γ( k + 1 − α ))(1 / ( k − 1) α − 1 ), g 2 ( k , M ) = 0 satisfy (8). F or Shannon entrop y ( g ( u ) = − log ( u )) and R ´ enyi en trop y ( g ( u ) = u α − 1 ), the assumptions in Section 3.1 reduce to the follo wing under the condition k = O ((log( M )) 2 / (1 − δ ) ). Assumption ( A . 1) is unchanged. Assumption ( A . 2) holds for an y r suc h that 2 r > d . The assumption ( A . 3) is satisfied b y the choice of λ = log ( M ). Assumption ( A . 4) holds for ( g ( u ) = − log ( u )) and ( g ( u ) = u α − 1 ). Next, it will b e sho wn that ( A . 5) is also satisfied by ( g ( u ) = − log( u )) and ( g ( u ) = u α − 1 ). 15 W e note that ˜ g = ( g (3) / 6) 2 for the c hoice of g ( u ) = − log( u ) is given b y ˜ g = cu − 6 for some constan t c . Therefore, sup x ∈ ( q l ,q u ) | ˜ g ( x, y ) | e − 3 k (1 − δ ) = | c − 6 1 | ( M /k ) 6 O ( e − 3 k (1 − δ ) ) = | c − 6 1 | ( M /k ) 6 O ( e − 3(log( M )) 2 ) = | c − 6 1 | O ( e − 3(log( M )) 2 +6 log( M ) − 6 log( k ) ) = o (1) , and by (64), E [sup x ∈ ( p l ,p u ) | ˜ g ( x/ p , y ) | ] = | c | ((1 − ) 0 ) − 6 E [( M p / ( k − 1)) 6 ] = | c | ((1 − ) 0 ) − 6 O (1) = O (1) . Similarly , ˜ g = ( g ( λ ) / ( λ !)) 2 for the choice of g ( u ) = − log ( u ) is given b y ˜ g = λ − 2 u − 2 λ . Then, sup x ∈ ( q l ,q u ) | ˜ g ( x, y ) | e − 3 k (1 − δ ) = O (( M /k ) 2 λ e − 3 k (1 − δ ) ) = O (( M /k ) 2 λ e − 3(log( M )) 2 ) = O ( e − 3(log( M )) 2 +2(log( M )) 2 − 2 log( M ) log( k ) ) = o (1) , and by (64), E [sup x ∈ ( p l ,p u ) | ˜ g ( x/ p , y ) | ] = O ( E [( M p / ( k − 1)) 2 λ )] = O (1). In an iden tical manner, ( A . 5) is satisfied when g ( u ) = u α − 1 . T o summarize, for functions g ( u ) = − log ( u ) and g ( u ) = u α − 1 , Theorem 5.1, 5.2 and 5.3 hold under the following assumptions: (i) ( A . 0), (ii) ( A . 1), (iii) the density f has b ounded con tinuous partial deriv ativ es of order greater than d and (iv) k = O ((log ( M )) 2 / (1 − δ ) ). F ur- thermore the prop osed BPI estimator ˆ G N ,B C ( ˜ f k ) can b e used to estimate Shannon en tropy ( g ( u ) = − log ( u )) and R ´ en yi entrop y ( g ( u ) = u α − 1 ) at MSE rate of Θ(((log ( T )) 2 / (1 − δ ) /T ) 4 /d ). 6 Estimation of Shannon Mutual information The join t en trop y of random vectors X and Y with joint density f X Y is giv en b y H ( X , Y ) = − Z f X Y log( f X Y ) dµ, (11) where f X Y is the joint density of X and Y . The Shannon MI b etw een tw o random vectors X and Y is then given by I ( X ; Y ) = H ( X ) + H ( Y ) − H ( X , Y ) . (12) W e use the following BPI estimator to estimate Shannon MI from N + M d -dimensional i.i.d samples { ( X i , Y i ); i = 1 , . . . , N + M } of the underlying joint density f X Y . W e estimate the Shannon MI by estimating the individual en tropies. W e estimate the joint Shannon en trop y H ( X , Y ) from samples using the plug-in estimate ˆ H ( X , Y ) = 1 N N X i =1 − log( ˜ f k ( X i , Y i )) + log ( k − 1) − ψ ( k ) , (13) 16 where ˆ f XY is a k nearest neighbor density estimate ( k NN) estimated using the remaining M samples. The k NN densit y estimate [30] is given by ˜ f k ( X , Y ) = k − 1 M V k ( X , Y ) , (14) where V k ( X , Y ) is the v olume corresp onding to the k th nearest neigh b or distance b etw een the p oin t of densit y estimation ( X , Y ) and the M i.i.d samples { ( X i , Y i ); i = N + 1 , . . . , N + M } . W e estimate the marginal entropies by first obtaining estimates of the marginal density using k NN density estimates ˜ f k ( X ) = k − 1 M V k ( X ) , (15) where V k ( X ) is the volume corresp onding to the k th nearest neighbor distance b etw een the p oin t of density estimation X and the M i.i.d samples { X i ; i = N + 1 , . . . , N + M } , and then plugging the estimated marginals in to Eq. 16. ˆ H ( X ) = 1 N N X i =1 − log( ˜ f k ( X i )) + log ( k − 1) − ψ ( k ) . (16) Define the BPI estimator of Shannon MI: ˆ I N = ˆ H ( X ) + ˆ H ( Y ) − ˆ H ( X , Y ) . (17) W e mak e the following assumptions: (i) ( A . 0), (ii) ( A . 1), (iii) the densit y f X Y has b ounded con tinuous partial deriv atives of order greater than d and (iv) k = O ((log ( M )) 2 / (1 − δ ) ). Note that the results here require cross moments b et ween density estimates of the joint and mar- ginal densities, whic h while not discussed in this rep ort, can b e obtained in exactly the same manner as computing cross momen ts b et ween the same densit y . Theorem 6.1. The bias of the BPI estimator ˆ I N is given by B [ ˆ I N ] = c 1 k M 2 /d + c 3 ( k , M , N ) + o k M 2 /d ! . (18) Theorem 6.2. The varianc e of the BPI estimator ˆ I N is given by V [ ˆ I N ] = c 4 1 N + c 5 1 M + o 1 M + 1 N , wher e c v = V ar log f X ( X ) f Y ( Y ) f X Y ( X , Y ) . 17 0 50 100 150 10 −3 10 −2 10 −1 k | Bias[ ˆ G N ( ˜ f k )] | Experimental Theoretical Figure 5: Comparison of theoretically predicted bias of BPI estimator ˆ G N ( ˜ f k ) against ex- p erimen tally observ ed bias as a function of k . The Shannon en trop y ( g ( u ) = − log ( u )) is estimated using the BPI estimator ˆ G N ( ˜ f k ) on T = 10 4 i. i. d. samples drawn from the d = 3 dimensional uniform-b eta mixture densit y (19). N , M w ere fixed as N = 3000, M = 7000 resp ectiv ely . The theoretically predicted bias agrees well with exp erimental observ ations. The predictions of our asymptotic theory therefore extend to the finite sample regime. The theoretically predicted optimal choice of k opt = 52 also minimizes the empirical bias. 6.0.1 CL T Theorem 6.3. The asymptotic distribution of the BPI estimator ˆ I N is given by lim ∆ → 0 P r ˆ I N − E [ ˆ I N ] q V [ ˆ I N ] ≤ α = P r ( S ≤ α ) , wher e S is a standar d normal r andom variable. 7 Sim ulations Here the theory established in Section 3 and Section 4 is v alidated. A three dimensional v ector X = [ X 1 , X 2 , X 3 ] T w as generated on the unit cub e according to the i.i.d. Beta plus i.i.d. uniform mixture mo del: f ( x 1 , x 2 , x 3 ) = (1 − ) 3 Y i =1 f a,b ( x i ) + , (19) 18 0 50 100 150 200 10 −3 10 −2 10 −1 k | Bias[ ˆ G N,B C ( ˜ f k )] | Experimental Theoretical Figure 6: Comparison of theoretically predicted bias of BPI estimator ˆ G N ,B C ( ˜ f k ) against exp erimen tally observ ed bias as a function of k . The Shannon en tropy ( g ( u ) = − log( u )) is estimated using the prop osed BPI estimator ˆ G N ,B C ( ˜ f k ) on T = 10 4 i. i. d. samples dra wn from the d = 3 dimensional uniform-beta mixture density (19). N , M w ere fixed as N = 3000, M = 7000 resp ectiv ely . The empirical bias is in agreemen t with the bias approximations of Theorem IV. 1 and monotonically increases with k . where f a,b ( x ) is a univ ariate Beta densit y with shap e parameters a and b . F or the exp eriments the parameters w ere set to a = 4 , b = 4, and = 0 . 2. The Shannon en trop y ( g ( u ) = − log( u )) is estimated using the BPI estimators ˆ G N ( ˜ f k ) and ˆ G N ,B C ( ˜ f k ). In Fig. 5, the bias approximations of Theorem I I I. 1 are compared to the empirically determ- ined estimator bias of ˆ G N ( ˜ f k ). N and M are fixed as N = 3000, M = 7000. Note that the theoretically predicted optimal choice of k opt = 52 minimizes the exp erimen tally obtained bias curve. Thus, ev en though our theory is asymptotic it pro vides useful predictions for the case of finite sample size, specifying bandwidth parameters that achiev e minim um bias. F urther note that by matching rates, i.e. c ho osing k = ¯ k = M 2 / (2+ d ) = 83 also results in significan tly lo wer MSE when compared to choosing k arbitrarily ( k < 10 or k > 150). In Fig. 6, the bias approximations of Theorem IV. 1 are compared to the empirically determined estimator bias of ˆ G N ,B C ( ˜ f k ). Observ e that the empirical bias, in agreement with the bias appro ximations of Theorem IV. 1, monotonically increases with k . In Fig. 7, the empirically determined v ariance of ˆ G N ( ˜ f k ) is compared with the v ariance expressed by Theorem I I I. 2 for v arying choices of N and M , with fixed N + M = 10 , 000. The theoretically predicted v ariance agrees well with exp erimen tal observ ations. A Q-Q plot of the normalized BPI estimate ˆ G N ( ˜ f k ) and the standard normal distribution is shown in Fig. 8. The linear Q-Q plot v alidates the Cen tral Limit Theorem II I. 3 on the uncompensated BPI estimator. T o v erify that the predicted confidence interv als w ere indeed as adv ertised, the empirically determined and theoretically predicted confidence interv als w ere compared 19 3000 4000 5000 6000 7000 10 −5 10 −4 10 −3 M V ar[ ˆ G N ( ˜ f k )] Experimental Theoretical Figure 7: Comparison of theoretically predicted v ariance of BPI estimator ˆ G N ( ˜ f k ) against exp erimen tally observ ed v ariance as a function of M . The Shannon en tropy ( g ( u ) = − log ( u )) is estimated using the prop osed BPI estimator ˆ G N ( ˜ f k ) on T = 10 4 i. i. d. samples drawn from the d = 3 dimensional uniform-b eta mixture density (19). k is c hosen to b e k opt = k 0 M 2 / (2+ d ) . The theoretically predicted v ariance agrees well with exp erimen tal observ ations. in Fig. 10. The lengths of the predicted confidence in terv als are accurate to within 12% of the length of the true confidence interv als. W e additionally show in Fig. 11 a plot of the empirically determined estimator bias (via sim ulation) vs the bias predicted by our theory as a function of sample size T , which matc hes the theoretical prediction. F or Shannon entrop y ( g ( u ) = − log ( u )), the uncomp ensated and comp ensated BPI estimators are related by ˆ G N ,B C ( ˜ f k ) = ˆ G N ( ˜ f k ) + log ( k − 1) − ψ ( k ) . The v ariance and normalized distribution of these estimators are therefore iden tical. Con- sequen tly , Fig. 7 and Fig. 8 also v alidate Theorem IV. 2 and Theorem IV. 3 resp ectively . Finally , using the CL T, the 95% co v erage in terv als of the BPI estimator ˆ G N ,B C ( ˜ f k ) are sho wn as a function of sample size T in Fig. 9. The lengths of the predicted confidence interv als are accurate to within 12% of the true confidence interv als (determined b y simulation o ver the range of 80% to 100% cov erage - data not shown). These cov erage interv als can b e in terpreted as confidence interv als on the true entrop y , provided that the constants c 1 , .., c 5 can b e accurately estimated. 20 −4 −2 0 2 4 −4 −3 −2 −1 0 1 2 3 4 Standard Normal Quantiles Quan tiles of ( normalized) ˆ G N ( ˜ f k ) Figure 8: Q-Q plot comparing the quantiles of the BPI estimator ˆ G N ( ˜ f k ) (with g ( u ) = − log( u )) on the v ertical axis to a standard normal p opulation on the horizontal axis. The Shannon en tropy ( g ( u ) = − log ( u )) is estimated using the prop osed BPI estimator ˆ G N ( ˜ f k ) on T = 10 4 i. i. d. samples drawn from the d = 3 dimensional uniform-b eta mixture densit y (19). k , N , M are fixed as k = k opt = 52, N = 3000 and M = 7000 resp ectively . The appro ximate linearit y of the p oints v alidates our central limit theorem 3.3. 7.1 Exp erimen tal comparison of estimators The R ´ en yi α -en tropy ( g ( u ) = u α − 1 ) is estimated for α = 0 . 5, with the same underlying 3 dimensional mixture of the b eta and uniform densities defined ab o ve. Several estimators are compared: Baryshnik ov’s estimator ˆ I α,S , the k -NN estimator ˜ I α,S of Leonenk o etal [17], the BPI estimator without bias correction ˆ G N ( ˜ f k ) and the prop osed BPI estimator with bias correction ˆ G N ,B C ( ˜ f k ). The results are shown in Fig. 12. It is clear from the figure that the BPI estimator ˆ G N ,B C ( ˜ f k ) has the fastest rate of conv ergence, consisten t with our theory . Note that, in agreemen t with our analysis in Section 4.4, the bias uncomp ensated BPI estimator ˆ G N ( ˜ f k ) outp erforms Baryshniko v’s estimator ˆ I α,S . 8 Application to structure disco v ery Disco vering structural dep endencies among random v ariables from a multiv ariate sample is an imp ortant task in signal pro cessing, pattern recognition and machine learning. Based on dep endence relationships, the density function of the v ariables can b e mo deled using factor graphs. When the sample is highly structured, the corresp onding factor graph configuration is sparse. Sparse factor graphs corresp ond to join t multiv ariate distributions which separate in to a parsimonious pro duct of few lo w er dimensional distributions. The inheren t lo w-dimensional 21 0 0.5 1 1.5 2 x 10 4 0.91 0.92 0.93 0.94 0.95 0.96 0.97 0.98 0.99 Sample size T Entropy T r ue en t ropy v alue ( G ( f )) BPI estimator - bias ( ˆ G N,B C ( ˜ f k ) − c 0 ¡ k M ¢ 2 d ) 95 % Cov e rage interv als Figure 9: 95% co verage interv als of BPI estimator ˆ G N ,B C ( ˜ f k ), predicted using the Central limit theorem 3.3, as a function of sample size T . The Shannon en tropy ( g ( u ) = − log ( u )) is estimated using the prop osed BPI estimator ˆ G N ,B C ( ˜ f k ) on T i. i. d. samples drawn from the d = 3 dimensional uniform-b eta mixture density (19). The lengths of the cov erage in terv als are accurate to within 12% of the empirical confidence interv als obtained from the empirical distribution of the BPI estimator. 0.8 0.85 0.9 0.95 1 −0.185 −0.18 −0.175 −0.17 −0.165 −0.16 −0.155 −0.15 −0.145 Coverage value Entropy Lower coverage envelope (Empirical) Lower covergae envelope (Theoretical) Upper coverage envelope (Empirical) Upper covergae envelope (Theoretical) Figure 10: Empirically determined and theoretically predicted cov erage en velopes as a func- tion of cov erage v alues. There is go o d agreement b et ween the theoretically predicted and empirical co v erage in terv als. nature of this pro duct leads to a compact representation of the v ariables ha ving sparse factor graph configurations. 22 0 2000 4000 6000 8000 10000 0.005 0.01 0.015 0.02 0.025 0.03 0.035 Sample size T | Bias[ ˆ G N,B C ( ˜ f k )] | Experimental Theoretical Figure 11: Comparison of theoretically predicted bias of BPI estimator ˆ G N ,B C ( ˜ f k ) against exp erimen tally observ ed bias as a function of sample size T . The Shannon en tropy ( g ( u ) = − log( u )) is estimated using the prop osed BPI estimator ˆ G N ,B C ( ˜ f k ) on T i. i. d. samples dra wn from the d = 3 dimensional uniform-b eta mixture density (19). The empirical bias is in agreement with the bias approximations of Theorem IV. 1 and monotonically decreases with T . In practice, these structure dep endencies hav e to b e discov ered from sample realizations of the multiv ariate distribution. Disco vering dep endencies when parametric probability densit y mo dels are not known a priori is an imp ortant restriction of the abov e problem. F or paramet- ric distribution estimates, the errors are of order O (1 / N ) if the true distribution is included in the parametric mo del. If not, a non-v anishing bias will dominate the error yielding an ev en higher error than that of a nonparametric distribution estimate (e.g. k NN estimates). In this restricted setting, recourse is therefore taken to nonparametric metho ds. Cho w et.al. [8] prop osed an elegan t solution to structure disco v ery of Mark ov tree distribu- tions and pro vided a nonparametric algorithm to obtain the optimal tree. Ihler et.al. [22] dev elop ed the metho d of nonparametric hypothesis tests for structure discov ery . Nonparametric metho ds, while asymptotically consistent, can uncov er incorrect factor graph structure when estimated from a finite n umber of samples. This is distinctly true for small sample sizes. While consistency is an imp ortant qualitative prop erty , there is clearly an imp ortan t motiv ation for quantitativ e c haracterization of p erformance in structure disco very . In this work, we analyze factor graph structure discov ery in the finite sample size setting. W e present a class of k -nearest neighbor ( k NN) based nonparametric geometric algorithms to disco ver factor graph structure among v ariables. W e provide results on mean square error of the nonparametric estimates, which can b e optimized o v er free parameters, thereby guar- an teeing improv ed correct structure discov ery . In addition, w e provide confidence interv als 23 10 3 10 4 10 −5 10 −4 10 −3 10 −2 Sample size T Variation of MSE vs T Leonenko estimator Baryshnikov estimator BPI estimator without bias correction Proposed BPI estimator Figure 12: V ariation of MSE of k -nearest neighbor estimator of Leonenk o etal [17] and the k -nearest neighbor estimator of Baryshniko v etal [2] and BPI estimators with and without b oundary correction, as a function of sample size T . The R´ en yi entrop y ( g ( u ) = u α − 1 ) is estimated for α = 0 . 5 using these estimators on T i. i. d. samples drawn from the d = 3 dimensional uniform-b eta mixture densit y (19). The figure sho ws that the prop osed BPI estimator has the fastest rate of conv ergence. on these nonparametric estimates to determine the probability of false error in choosing an incorrect structure mo del. These results are an direct extension of our work on optimized nonparametric estimates of divergence measures in tro duced earlier. As a consequence of our statistical analysis, w e in tro duce the notion of dep endence-based dimension for factor graph mo dels and sho w that comparing mo dels within the same di- mension class is an easier task with low er probability of false error as compared to comparing mo dels across different dimensions. 8.1 F actor graphs F actor graphs are bipartite graphs used to represent factorizations of probability density func- tions. Consider a set of v ariables X = { X 1 , X 2 , . . . , X T } and let { S j ⊆ { X 1 , X 2 , . . . , X n } , j = 1 , . . . , m } b e a set of subsets of X . Let g ( X 1 , . . . , X T ) denote a probability density function on the random vector X . F or the factorization g ( X 1 , . . . , X T ) = Q m j =1 f j ( S j ) of the density function, the corresp onding factor graph G = ( X , F , E ) consists of v ariable v ertice’s X , factor vertices’s F = { f 1 , f 2 , . . . , f m } , and edges E . The edges in the factor graph dep end on the factorization as follo ws: there is an undirected edge b etw een factor v ertex f j and v ariable v ertex X k when X k ⊆ S j . 24 8.2 F actor graph disco v ery Problem statement: Consider a set of factor graphs { g i ( X 1 , . . . , X T ) , i = 1 , . . . , I } . W e seek to find the factor graph configuration from this set that b est mo dels the data. The Kullbac k-Leibler (KL) div ergence measure induces a geometry on the space of prob- abilit y distributions. On this induced geometry , w e naturally define the b est factor graph configuration g o to b e the one closest to the actual distribution p ( X 1 , . . . , X T ) in terms of KL div ergence (c.f. [8]). g o = arg min g i K L ( p || g i ) = arg min g i H c ( p, g i ) , (20) where H c ( p, g i ) = − R p log g i is the cross-en tropy b etw een p and g i . In practice, these cross- en tropy terms ha ve to b e estimated from the finite data sample. Errors in estimation of cross-en tropy terms can result in incorrect factor graph disco very . The problem considered by [8] is a sp ecific instance of discov ering factor graph structure. F or the class of Mark ov tree factor graphs considered b y [8], the cross entrop y reduces to a sum of pairwise Shannon m utual information terms b etw een v ariables with edges in the Mark ov tree. In their w ork, they empirically estimate the m utual information terms from the data using nonparametric estimators which are consisten t. Ho w ever, they do not take in to accoun t the error in the mutual information estimates when estimated from finite samples. 8.3 Disjoin t factor graph disco v ery In order to illustrate the effect of nonparametric estimation from finite sample size on factor graph disco very , w e restrict our atten tion to disjoint factor graphs ([22]). F or i = 1 , . . . , I , let g i ( X 1 , X 2 , . . . , X T ) = m Y j =1 p ( S ( i ) j ) , (21) where S ( i ) j ∩ S ( i ) k = φ whenev er j 6 = k , and p ( . ) denotes the marginal density function. In this case of disjoint factor graphs, the cross-en tropy takes the follo wing simple form: H c ( p, g i ) = X j H ( S ( i ) j ) , (22) where H ( S ( i ) j ) is the Shannon en tropy of the v ariables S ( i ) j under the true distribution p . F or example, consider the disjoint factor graph g ( X 1 , . . . , X 5 ) = p ( X 1 , X 2 ) p ( X 3 ) p ( X 4 , X 5 ). The cross-entrop y for this factor graph is giv en by H c ( p, g ) = H ( X 1 , X 2 )+ H ( X 3 )+ H ( X 4 , X 5 ). Consider tw o disjoint factor graph configurations: (a) n ( X 1 , . . . , X T ) = Q m 1 i =1 f ( R i ) and (b) l ( X 1 , . . . , X T ) = Q m 2 j =1 f ( S j ). Denote the dimension of R i b y d n i and S j b y d l j . W e note that P m 1 i =1 d ( n ) i = P m 2 j =1 d ( l ) j = T . Based on the ab o v e formulation, in order to compare the t wo p oten tial factor graph mo dels n and l , w e need to compare the resp ective cross-entrop y terms. The cross en tropy test is stated b elo w. 25 Cross en trop y test: The cross en tropy test to compare b et ween mo dels n and l is giv en b y H c ( p, n ) − H c ( p, l ) = m 1 X i =1 H ( R i ) − m 2 X j =1 H ( S j ) > < 0 . (23) W e estimate these entrop y terms in the test statistic H c ( p, n ) − H c ( p, l ) from sample realiz- ations using k NN plug-in estimators in tro duced earlier. 8.4 Errors in factor graph disco v ery T o illustrate the effect of estimation error in factor graph disco very , again consider the tw o factor graph mo dels n ( X 1 , . . . , X T ) = Q m 1 i =1 f ( R i ) and l ( X 1 , . . . , X T ) = Q m 2 j =1 f ( S j ). The cross entrop y test (Eq. 22) b et w een mo dels n and l is H c ( p, n ) − H c ( p, l ) > < 0. W e replace this optimal cross entrop y test with the follo wing surrogate cross en tropy test: ˆ H c ( p, n ) − ˆ H c ( p, l ) = m 1 X i =1 ˆ H ( R i ) − m 2 X j =1 ˆ H ( S j ) > < 0 . (24) where we estimate entrop y terms ˆ H ( R i ) or ˆ H ( S j ) using indep endent realizations of the underlying density p . T o elab orate, if w e ha ve V samples { X (1) , . . . , X ( V ) } from the densit y p , we partition these V samples in to m 1 + m 2 disjoin t subsets of size N + M each. This implies that N + M ≈ V / ( m 1 + m 2 ). W e then use each subset to estimate en tropy using the partitioning strategy as discussed earlier. Denote the coefficients corresp onding to the en trop y estimate ˆ H ( R i ) of the subset of v ariables R i in the factor graph mo del n b y c n i 1 , c n i 2 and c n i 4 . Using the theorems established in this rep ort, we hav e the following results: Mean: The mean of this surrogate test statistic is then giv en b y E p [ ˆ H c ( p, n ) − ˆ H c ( p, l )] = H c ( p, n ) − H c ( p, l ) + m 1 X i =1 c n i 1 k M 2 /d ( n ) i − m 2 X j =1 c l j 1 k M 2 /d ( l ) j + m 1 X i =1 c n i 2 /k − m 2 X j =1 c l j 2 /k . (25) V ariance: The v ariance of the surrogate test statistic is then given by the sum of the v ariance of the individual entrop y estimates (by indep endence) V p [ ˆ H c ( p, n ) − ˆ H c ( p, l )] = m 1 X i =1 c n i 4 + m 2 X j =1 c l j 4 ! 1 N . (26) 26 W eak conv ergence: Again, b y indep endence of the individual entrop y estimates, w e hav e the follo wing w eak con v ergence la w lim N ,M →∞ P r √ N ( ˆ H c ( p, n ) − ˆ H c ( p, l ) − E p [ ˆ H c ( p, n ) − ˆ H c ( p, l )]) q V p [ ˆ H c ( p, n ) − ˆ H c ( p, l )] ≤ α = P r ( Z ≤ α ) , (27) where Z is standard normal. 8.5 Discussion F rom the abov e expressions for the mean, v ariance and weak conv ergence la w of the surrogate test statistic, we make the following observ ations: 1. The bias term is dep endent on the dimension of the factors of the factor graph mo dels d ( n ) i and d ( l ) j . The v ariance term is indep enden t of dimension. F urthermore, it is clear that the bias term dominates the MSE as the dimension of the factors gro ws. 2. F or b etter p erformance in discov ering factor graph structure using cross en tropy tests, it is clear that w e w ant the MSE of the surrogate test statistic to b e small. A significan t route to ac hieving this is to get the bias from eac h factor graph cross entrop y estimate in the estimated test statistic to cancel. This is to sa y , w e wan t E p [ ˆ H c ( p, n ) − ˆ H c ( p, l )] ≈ H c ( p, n ) − H c ( p, l ) ⇒ E p [ ˆ H c ( p, n )] − ˆ H c ( p, n ) ≈ E p [ ˆ H c ( p, l )] − ˆ H c ( p, l ) ⇒ m 1 X i =1 c n i 1 k M 2 /d ( n ) i + m 1 X i =1 c n i 2 /k ≈ m 2 X j =1 c l j 1 k M 2 /d ( l ) j + m 2 X j =1 c l j 2 /k . (28) 3. This cancellation effect will b e maximized when the dimensions of the factor graph subsets R i and S j matc h. That is to say , we w ant m 1 = m 2 and furthermore d ( n ) i = d ( l ) j . In this case, the bias from each cross entrop y estimate are of the same order and will nearly cancel. On the other hand, when there is a mismatch in dimension, the bias from one cross en tropy estimate will dominate the bias from the other cross entrop y estimate, resulting in significan t bias in the surrogate test statistic. In b oth these cases, the v ariance of the surrogate test statistic will b e of the same order O (1 / N ). 4. This giv es rise to notion of m ultiv ariate dimension for factor graphs. Index the fac- torizations according to the vector E = [ e 1 , e 2 , ..., e p ], where e i is an integer b et ween 0 and T that counts the n umber of factors of order i , i.e. inv olving a marginal density 27 o ver i v ariables. The dimension E of factor graph configurations partitions the factor graphs in to equiv alence classes having nearly constant cross entrop y estimate bias. F or tw o factor graph mo dels n and l with dimensions E n and E l , w e will refer to n as a higher dimensional mo del relative to l if the last non-zero entry of E n − E l is p ositiv e. 5. As discussed earlier, the bias will not b e a significan t factor when comparing mo dels o ver an equiv alence class ha ving fixed v alues of E . On the other hand, the bias will b e significan t when comparing mo dels across different v alues of E , resulting in higher probabilit y of error in factor graph disco very . 6. Prior knowledge of the equiv alence class will therefore translate in to m uch improv ed p erformance in factor graph discov ery as compared to prior knowledge that mixes b et w een equiv alence classes. 7. W e note that the num b er of samples required to maintain a constan t lev el of bias grows geometrically with dimension E . 8. Using the expressions for the bias and v ariance of the surrrogate test statistic, w e can optimize ov er the free parameters: (a) the choice of partition N and M for fixed total sample size N + M and (b) the choice of bandwidth parameter k , for minim um MSE. 9. Using the w eak con v ergence la w, w e can theoretically predict the probability of c ho osing mo del n ov er mo del l using the surrogate cross entrop y test. 8.6 Exp erimen t W e illustrate the implications of our analysis with a to y example. Let f β ( x, a, b, d ) denote a b eta density of dimension d with parameters a and b . Now let f µ ( x, d ) = 0 . 5 f β ( x, 5 , 2 , d ) + 0 . 5 f β ( x, 2 , 5 , d ) b e a mixture of b eta densities. When d > 1, the mixing of densities ensures there is strong dep endence b et ween the v ariates. W e dra w V = 10 5 indep enden t sample realizations from the join t density p ( X 1 , . . . , X 5 ) = f µ ( X 1 , 1) f µ ( X 2 , 1) f µ ( X 3 , 1) f µ ( X 4 , X 5 , 2). E T rue F alse l [1 , 0 , 0 , 1 , 0] f ( X 1 , X 2 , X 4 , X 5 ) f ( X 3 ) f ( X 1 , X 2 , X 3 , X 4 ) f ( X 5 ) m [1 , 2 , 0 , 0 , 0] f ( X 1 , X 2 ) f ( X 4 , X 5 ) f ( X 3 ) f ( X 1 , X 3 ) f ( X 2 , X 4 ) f ( X 5 ) n [3 , 1 , 0 , 0 , 0] f ( X 4 , X 5 ) f ( X 1 ) f ( X 2 ) f ( X 3 ) f ( X 2 , X 4 ) f ( X 1 ) f ( X 3 ) f ( X 5 ) Exp erimen t The table ab o ve shows six differen t factor graph mo dels. W e compare each true mo del against each false mo del. Denote the true mo dels by l T , m T and n T and the corresp onding false mo dels b y l F , m F and n F . W e note that the true cross entrop y terms H c ( p, l T ) = H c ( p, m T ) = H c ( p, n T ) and H c ( p, l L ) = H c ( p, m L ) = H c ( p, n L ). This guaran- tees level playing field when comparing each true mo del against eac h false mo del using the surrogate cross entrop y test. 28 X 1 X 2 X 3 X 4 X 5 Figure 13: T rue factor graph representation of the 5-dimensional joint density p ( X 1 , . . . , X 5 ) = f µ ( X 1 , 1) f µ ( X 2 , 1) f µ ( X 3 , 1) f µ ( X 4 , X 5 , 2). F or the surrogate cross entrop y test, we set N = . 2 ∗ 10 4 , M = . 8 ∗ 10 4 and k = 20. W e note that the maxim um v alue of m 1 + m 2 for the ab ov e set of tests is 8 and that V / 8 > ( N + M ). This choice of N and M therefore ensures that there are enough samples V to guarantee sufficien t n umber of indep endent samples for estimating individual entropies (see Section 5). The table b elow lists the probability (exp erimen tal/theoretical prediction 1 ) of choosing the false mo del ov er the true mo del for the v arious tests. Same true vs Same false l T vs l F m T vs m F n T vs n F Error (Exp/Theor) 0.071/0.032 0.067/0.066 0.068/0.028 High true vs Low false l T vs m F l T vs n F m T vs n F Error (Exp/Theor) 0/0 0/0 0/0 Lo w true vs High false m T vs l F n T vs l F n T vs m F Error (Exp/Theor) 0.689/0.732 0.995/1.000 0.691/0.665 Explanation F or the class of mo dels ab o ve, the set of constants { c n i 1 , c l j 1 } are alwa ys negativ e. As a result, when comparing a high dimensional mo del to a lo w dimensional mo del, the additional bias will strongly tilt the test statistic tow ards the higher dimensional mo del. As a result, there is a greater chance of detecting the higher dimension mo del in the surrogate cross entrop y test, irresp ective of whether the higher dimensional mo del is true or false. T o elab orate, when the high dimensional mo del is true and the low dimensional mo del is false, the bias will further tilt the test statistic tow ards the high dimensional mo del, resulting in zero false detections. On the other hand, when the low dimensional mo del is true, the bias in the surrogate test statistic deviates to wards the high dimensional mo del, resulting in 1 The theoretical prediction requires estimation of constan ts c l i 1 , c l i 2 and c l i 3 . These constants w ere es- timated from the data using oracle Monte Carlo metho ds which utilized the true form of the density p . In practice, when the true form of p is never kno wn, we adopt metho ds given b y [38] to estimate these constants from data. 29 a high num b er of false detections. When we compare factor graph mo dels within the same class of dimension, the bias from the cross entrop y estimates for eac h mo del nearly cancel, resulting in a surrogate test statistic with m uc h smaller bias as compared to the ab o ve t wo cases. As a result, the num b er of false detections is corresp ondingly lo w when comparing mo dels within the same dimension. By the same argument, for factor graph mo dels where the set of constants { c n i 1 , c l j 1 } are p ositiv e, we can conclude that the surrogate test statistic will b e biased to w ards low er di- mensional mo dels. 9 Application to in trinsic dimension estimation In this work w e introduce a new dimensionality estimator that is based on fluctuations of the sizes of nearest neigh b or balls cen tered at a subset of the data p oints. In this resp ect it is sim- ilar to Costa’s k -nearest neighbor (kNN) graph dimension estimator [9] and to F arahmand’s dimension estimator based on nearest neigh b or distances [14]. The estimator can also b e re- lated to the Leonenko’s R´ en yi en trop y estimator [27]. How ever, unlike these estimators, our new dimension estimator is deriv ed directly from a mean squared error (M.S.E.) optimalit y condition for partitioned kNN estimators of multiv ariate density functionals. This guaran- tees that our estimator has the b est p ossible M.S.E. con v ergence rate among estimators in its class. Empirical exp eriments are presen ted that sho w that this asymptotic optimality translates in to impro v ed p erformance in the finite sample regime. 9.1 Problem form ulation Let Y = { Y 1 , . . . , Y T } b e T indep endent and identically distributed sample realizations in R D distributed according to density f . Assume the random vectors in Y are constrained to lie on a d-dimensional Riemannian submanifold S of R D ( d < D ). W e are interested in estimating the intrinsic dimension d . 9.2 Log-length statistics Let γ > 0 b e any arbitrary num b er and α = γ /d . Partition the T samples in Y in to tw o disjoin t sets X and Z of size b T / 2 c each. Denote the samples of X as X = { X 1 , . . . , X b T / 2 c } and Z as Z = { Z 1 , . . . , Z b T / 2 c } . P artition X into N ’target’ and M ’reference’ samples { X 1 , . . . , X N } and { X N +1 , . . . , X b T / 2 c } resp ectiv ely with N + M = b T / 2 c . P artition Z in an iden tical manner. No w consider the follo wing statistics based on the partitioning of sample space: L k ( X ) = γ N N X i =1 log ( R k ( X i )) , 30 where R k ( X i ) is the Euclidean k nearest neighbor ( k NN) distance from the target sample X i to the M reference samples { X N +1 , . . . , X b T / 2 c } . This partitioning of samples is illustrated in Fig. 14. −1 −0.5 0 0.5 1 −1 −0.5 0 0.5 1 −1 −0.5 0 0.5 1 N target samples M reference samples kNN edges Figure 14: kNN edges on sphere manifold with uniform distribution for d = 2, D = 3, and k = 5. 9.3 Relation to k NN density estimates Under the condition that k / M is small, the Euclidean k NN distance R k ( X i ) approximates the k NN distance on the submanifold S . The k NN densit y estimate [31] of f at X i based on the M samples X N +1 , . . . , X N + M is then given by ˆ f k ( X i ) = k − 1 M 1 c d R k ( X i ) d = k − 1 M 1 V k ( X i ) , 31 where c d is the volume of the unit ball in d dimensions and therefore V k ( X i ) is the volume of the k NN ball. This implies that L k ( X ) can b e rewritten as follo ws: L k ( X ) = γ N N X i =1 log ( R k ( X i )) = log k − 1 M c d α + 1 N N X i =1 log ˆ f k ( X i ) − α = α log( k − 1) − α N N X i =1 log ˆ f k ( X i ) − α log( c d M ) . (29) As eq. (29) indicates, the log-length statistics is linear with resp ect to log ( k − 1) with a slop e of α . This prompts the idea of estimating α (and later d ) from the slop e of L k ( X ) as a function of log ( k − 1). 9.4 In trinsic dimension estimate based on v arying bandwidth k Let k 1 and k 2 b e tw o differen t c hoices of bandwidth parameters. Let L k 1 ( X ) and L k 2 ( Z ) b e the length statistics ev aluated at bandwidths k 1 and k 2 using data X and Z resp ectiv ely . A natural c hoice for the estimate of α would then b e ˆ α = L k 2 ( Z ) − L k 1 ( X ) log( k 2 − 1) − log( k 1 − 1) = α + ν N N X i =1 log ˆ f k 2 ( Z i ) − log ˆ f k 1 ( X i ) = α + ν ( ˆ E k 2 ( Z ) − ˆ E k 1 ( X )) , where ˆ E k ( X ) = 1 N N X i =1 log( ˆ f k ( X i )) , and ν = − α/ log (( k 2 − 1) / ( k 1 − 1)). The intrinsic dimension estimate is related to ˆ α b y the simple relation ˆ d = γ / ˆ α . 32 9.5 Statistical prop erties of in trinsic dimension estimate W e can relate the error in estimation of α to the error in dimension estimation as follows: ˆ d − d = γ 1 ˆ α − 1 α = γ α − ˆ α ˆ αα = − γ α 2 ( ˆ α − α ) + o ( ˆ α − α ) . Define κ = − γ ν /α 2 . W e recognize that the densit y functional estimate ˆ E k ( X ) is in the form of the plug-in estimators in tro duced in this rep ort. Using the results on the bias, v ariance and asymptotic distribution of the density functional estimate ˆ E k ( X ) established in this rep ort and the ab o ve relation b etw een the errors ˆ d − d and ˆ α − α , we then hav e the follo wing statistical prop erties for the estimate ˆ d : Estimator bias E [ ˆ d ] − d = κc b 1 k 2 M 2 /d − k 1 M 2 /d ! + κc b 2 1 k 2 − 1 k 1 + o 1 k 1 + 1 k 2 + k 1 M 2 /d + k 2 M 2 /d ! . Estimator v ariance V ( ˆ d ) = 2 κ 2 c v 1 N + o 1 M + 1 N . Cen tral limit theorem Let Z b e a standard normal random v ariable. Then, lim N ,M →∞ P r ˆ d − E [ ˆ d ] p 2 κ 2 c v / N ≤ α ! = P r ( Z ≤ α ) . 9.6 Optimal selection of parameters W e ha ve theoretical expressions for the mean square error (M.S.E) of the dimension estimate ˆ d , whic h w e can optimize o v er the free parameters k 1 , k 2 , N and M . W e restrict our atten tion 33 to the case k 2 = 2 k ; k 1 = k . The M.S.E. of ˆ d (ignoring higher order terms) is given by M.S.E.( ˆ d ) = ( E [ ˆ d ] − d ) 2 + V [ ˆ d ] = C b 1 k M 2 /d + C b 2 1 k ! 2 + C v 1 N . (30) where C b 1 = κ 2 (2 /d − 1) , C b 2 = κ/ 4 and C v = 2 κ 2 c v . Optimal c hoice of bandwidth The optimal v alue of k w.r.t the M.S.E. is given by k opt = b k 0 M 2 2+ d c . (31) where the constant k 0 = ( | C b 2 | d/ 2 | C b 1 | ) d d +2 . Optimal partitioning of sample space Under the constraint that N + M = b T / 2 c is fixed, the optimal choice of N as a function of M is then giv en by N opt = b N 0 M 6+ d 2(2+ d ) c , (32) where the constant N 0 = √ C v (2+ d ) 2 b 0 . 9.7 Impro v ed estimator based on correlated error Consider the following alternative estimator for α : ˜ α = L k 2 ( X ) − L k 1 ( X ) log( k 2 − 1) − log( k 1 − 1) = α + κ ( ˆ E k 2 ( X ) − ˆ E k 1 ( X )) , and the corresp onding densit y estimate ˜ d which satisfies ˜ d − d = − γ α 2 ( ˜ α − α ) + o ( ˆ α − α ) , where b oth the length statistics at bandwidths k 1 and k 2 are ev aluated using the same sample X . The densit y functional estimates ˆ E k 1 ( X ) and ˆ E k 2 ( X ) will b e highly correlated (as compared to the indep endent quan tities ˆ E k 1 ( X ) and ˆ E k 2 ( Z )). This implies that the v ariance 34 0 50 100 150 200 250 300 10 −7 10 −6 10 −5 10 −4 k MSE Theoretical ( ˆ d ) Exp erimental ( ˆ d ) Exp erimental ( ˜ d ) k opt =104 Figure 15: Comparison of theoretically predicted and exp erimen tal M.S.E. for v arying c hoices of k . The exp erimental p erformance of the estimator ˆ d is in excellent agreemen t with the theoretical expression and, as predicted b y our theory , the mo dified estimator ˜ d significan tly outp erforms ˆ d . of the difference ˆ E k 2 ( X ) − ˆ E k 1 ( X ) will b e smaller when compared to ˆ E k 2 ( Z ) − ˆ E k 1 ( X ), (while the exp ectation remains the same). Since the estimator bias is unaffected by this mo dification, the v ariance reduction suggests that ˜ d will b e an impro v ed estimator as compared to ˆ d in terms of M.S.E.. In order to obtain statistical prop erties for the improv ed estimator ˜ d (equiv alen t to the prop erties developed in Section 9.5 for the original estimator ˆ d ), we need to analyze the joint distribution b etw een ˆ f k 1 ( X i ) and ˆ f k 2 ( X j ) for tw o distinct v alues k 1 and k 2 . Our theory , at presen t, cannot address the case of distinct bandwidths k 1 and k 2 . Since the estimate ˜ d has smaller M.S.E. compared to ˆ d , M.S.E. predictions for the estimate ˆ d can serve as upp er b ounds on the M.S.E. p erformance of the impro ved estimate ˜ d . 9.8 Sim ulations W e generate T = 10 5 samples B drawn from a d = 2 mixture density f m = . 8 f β + . 2 f u , where f β is the pro duct of tw o 1 dimensional marginal b eta distributions with parameters α = 2, β = 2 and f u is a uniform density in 2 dimensions. These samples are then pro jected to a 3-dimensional hyperplane in R 3 b y applying the transformation Y = U B where U is a 3 × 2 random matrix whose columns are orthonormal. W e apply our intrinsic dimension estimates on the samples Y . 35 1.5 2 2.5 3 3.5 x 10 4 10 −6 10 −5 10 −4 M MSE Theo re tical ( ˆ d ) Exper iment al ( ˆ d ) Exper iment al ( ˜ d ) M opt =27500 Figure 16: Comparison of theoretically predicted and exp erimen tal M.S.E. for v arying c hoices of M . The exp erimen tal p erformance of the estimator ˆ d is in excellent agreemen t with the theoretical expression and, as predicted b y our theory , the mo dified estimator ˜ d significan tly outp erforms ˆ d . Optimal selection of free parameters In our first exp erimen t, we theoretically compute the optimal choice of k for a fixed partition with M = 3 . 5 × 10 4 and N = 1 . 5 × 10 4 . W e then sho w the v ariation of the theoretical and exp erimen tal M.S.E. of the estimate ˆ d and the exp erimen tal M.S.E. of the improv ed estimate ˜ d with c hanging bandwidth k in Fig. 15. In our second exp eriment, w e compute the optimal partition according to eq. (32) and show the v ariation of M.S.E. with v arying c hoices of partition in Fig. 16. F rom our exp erimen ts, we see that there is go od agreement b et w een our theory and sim- ulations. As a consequence, we find the theoretically predicted optimal choices of k , N and M to minimize the observ ed M.S.E.. In addition, as predicted b y our theory , the mo dified estimator ˜ d significan tly outp erforms ˆ d . The theoretically predicted M.S.E. for ˆ d therefore serv es as a strict upp er b ound for the M.S.E. of the improv ed estimator ˜ d . Comparison of dimension estimation metho ds W e compare the p erformance of our prop osed dimension estimators to the estimated prop osed b y F rahmand et. al. [14] (denote as ˆ d f ) and Costa et. al. [9] (denote as ˆ d j ). Expressions for the optimal bandwidth k (eq. (4)) and partition N , M (eq. (32)) dep end on the unkno wn intrinsic dimension d and constan ts c b 1 , c b 2 and c v whic h dep end on unkno wn 36 0 2 4 6 8 10 x 10 4 10 −5 10 −4 10 −3 10 −2 10 −1 10 0 T MSE ˆ d (Original) ˜ d (Improved) ˆ d f (F ar ahmand ) ˆ d j (Costa) Figure 17: Comparison of p erformance of dimension estimates (Solid line: Optimal (optimal c hoice of k , N and M as p er eq. (4) and eq. (32)); Dashed line: Sub optimal (fixed k = 20, N = T / 50, M = b T / 2 c − N )): The prop osed impro ved kNN distance estimator outp erforms all other estimators considered. densit y f . The constan ts c b 1 , c b 2 and c v can b e estimated from the data using plug-in metho ds similar to the ones used by Rayk ar et. al. [38] for optimal bandwidth selection for k ernel density estimation . T o establish the p otential adv antages of our dimension estimators w e compare an omniscien t optimal form of our estimator, for which the true v alues of these constan ts are kno wn, to a sub optimal form of our estimator that do es not kno w the constan ts. F or the optimal estimator, we theoretically compute the optimal choice for k , N and M for differen t choices of total sample size T (sub-sampled from the initial 10 5 samples), and use these optimal parameters for the estimators ˆ d and ˜ d . W e use this optimal c hoice of bandwidth k for the estimators ˆ d f and ˆ d j as well (partitioning not applicable). F or the sub optimal estimator, w e arbitrarily c ho ose the parameters as follo ws: fixed k = 20, N = T / 50, M = b T / 2 c − N . The p erformance of these estimators as a function of sample size T is shown in Fig. 17. Estimators with optimal c hoice of parameters are indicated in solid line, and the sub optimal estimators are indicated in dashed lines. F rom our exp eriments we see that the p erformance of the original estimator ˆ d with sub- optimal choice of parameters is marginally inferior when compared to the estimator with optimal choice of parameters. This do es not hold for the other estimators as can b e exp ected since the parameters are optimized w.r.t. the performance of ˆ d . W e note that the impro ved estimator ˜ d outp erforms all other estimators while the p erform- ance of our original estimator ˆ d is sandwic hed b etw een ˆ d f and ˆ d j . W e conjecture that the 37 0 100 200 300 400 500 600 0 5 10 Costa estimator d 0 100 200 300 400 500 600 0 5 10 Levina andd Bickel estimator d 0 100 200 300 400 500 600 0 5 10 Optimized estimator d 0 100 200 300 400 500 600 0 2 4 x 10 6 Actual Data n Figure 18: Comparison of p erformance of dimension estimates for anomaly detection in Abilene net w ork data. p erformance of ˆ d j is sup erior to ˆ d for the same reason that ˜ d outp erforms ˆ d : correlated error b et w een differen t length statistics. Anomaly detection in Abilene net w ork data Anomalies can b e detected in router neto wrks by estimating the local dimension at eac h time p oin t and monitoring change in dimension. The data used is the num b er of pac k ets sen t b y eac h of the 11 routers on the abiline net w ork betw een January 1-2, 2005. A sample is tak en ev ery 5 min utes, leading to 576 samples with an extrinsic dimension pf 11. The p erformance of different dimension estimators is sho wn in Fig. 18. W e kno w that sim- ulataneous p eaks in router traffic should imply strong correlation b etw een the routers and therefore lo wer intrinsic dimension. This b ehaviour is clearly reflected b etter by the optimized estimator as compared to the estimator of Costa et. al. [9] and Levina and Bick el [28]. 10 Conclusion A new class of b oundary comp ensated bipartite k-NN density plug-in estimators was pro- p osed for estimation of smo oth non-linear functionals of densities that are strictly b ounded strictly aw a y from 0 on their finite supp ort. These estimators, called bipartite plug-in (BPI) estimators, correct for bias due to b oundary effects and outp erform previous k -NN entrop y estimators in terms of MSE con vergence rate. Expressions for asymptotic bias and v ariance of the estimator were deriv ed estimator in terms of the sample size, the dimension of the samples and the underlying probabilit y distribution. In addition, a central limit theorem w as developed for the prop osed BPI estimators. The accuracy of these asymptotic results w ere v alidated through simulation and it w as established that the theory can b e used to sp ecify optimal finite sample estimator tuning parameters such as bandwidth and optimal 38 partitioning of data samples. Our theory has t wo imp ortant b y-pro ducts: (1) W e established similarit y b etw een the mo- men ts of k -NN densit y estimates and kernel density estimates. This in turn implies that plug-in estimators based on k -NN density estimators and kernel density estimators hav e asymptotically equal rates of conv ergence. (2) W e developed an algorithm for detection and correction of density estimates at b oundary p oints for densities with finite supp ort. This correction helps reduce the bias of density estimates at the b oundaries of the supp ort of the densit y , thereby reducing the o verall bias of the plug-in estimators. Using the theory presented in the pap er, one can tune the parameters of the plug-in estimator to ac hieve minimum asymptotic estimation MSE. F urthermore, the theory can b e used to sp ecify the minim um necessary sample size required to obtain requisite accuracy . This in turn can b e used to predict and optimize p erformance in applications like structure disco very in graphical mo dels and dimension estimation for supp ort sets of low in trinsic dimension. W e applied our theory to the problem of estimating Shannon en trop y and Shannon mutual information. F urthermore, we used the Shannon entrop y estimator to discov er structure in high dimensional data and to determine the intrinsic dimension of data samples. 39 F or the reader’s conv enience, the notation used in this pap er is listed in the table b elow. Notation Description ˆ G N ( ˜ f k ) BPI estimator (1) ˆ G N ,B C ( ˜ f k ) BPI estimator with bias comp ensation (9) g 1 ( k , M ) , g 2 ( k , M ) Bias correction factors S Supp ort of densit y f d dimension of supp ort S c d unit ball volume in d dimensions { X 1 , . . . , X T , Y , Z } T + 2 indep endent realizations dra wn from f X N { X 1 , . . . , X N } X M { X N +1 , . . . , X N + M } S I In terior of supp ort I N In terior p oints subset of X N B N Boundary p oints subset of X N Z − 1 Closest interior p oint to Z ; Z − 1 = arg min x ∈ S I d ( x, Z ) X n ( i ) X n ( i ) ∈ I N is the interior sample p oint that is closest to X i ∈ B N δ Constan t; δ ∈ (2 / 3 , 1) B C = N exp( − 3 k (1 − δ ) ) Probabilit y of misclassification of x ∈ S − S I as interior p oint d k ( X ) k -NN ball radius S k ( X ) k -NN ball V k ( X ) k -NN ball v olume P ( X ) Cov erage function ˆ f k ( X ) k -NN density estimate ˜ f k ( X ) Boundary corrected k -NN density estimate g ( n ) ( x, y ) n -th deriv ativ e of g ( x, y ) wrt x p b eta random v ariable with parameters k , M − k + 1 α f r ac Prop ortionalit y constan t; M = α f r ac T and N = (1 − α f r ac ) T 0 , ∞ constan ts suc h that 0 ≤ f ( x ) ≤ ∞ ∀ x ∈ S 2 ν Num b er of times f is assumed to b e differentiable λ Num b er of times g ( x, y ) is assumed to b e diffe ren tiable wrt x c 1 , .., c 5 Constan ts app earing in Theorems I II.1, I I I.2, I I I.3 and IV.1, IV.2, IV.3 C ( k ) F unction which satisfies the rate of decay condition C ( k ) = O ( e − 3 k (1 − δ ) ) k M k M = ( k − 1) / M \ ( X ) The even t P ( X ) > (1 − p k ) k M \ − 1 ( X ) The even t P ( X ) < (1 + p k ) k M \\ ( X ) The ev en t (1 − p k ) k M < P ( X ) < (1 + p k ) k M e k ( X ) Error function e k ( X ) = ˆ f k ( X ) − E [ ˆ f k ( X ) | X ] e ( X ) Error function e ( X ) = ˜ f k ( X ) − E [ ˜ f k ( X ) | X ] 40 App endices A Uniform k ernel densit y estimation Throughout this section, we will deriv e results on moments of the uniform kernel density estimates for p oints in the set S 0 = { X : S u ( X ) ⊂ S } . This definition implies that the densit y f has contin uous partial deriv atives of order 2 r in the uniform ball neighborho o d for eac h X ∈ S 0 where r satisfies the condition 2 r (1 − t ) /d > 1. This excludes the set of p oin ts close to the b oundary of the supp ort, where the contin uit y assumption of the densit y is not satisfied. W e will deal with these p oints in App endix C. Let X 1 , .., X M denote M i.i.d realizations of the density f. W e will assume that f is contin u- ously differen tiable evrywhere in the in terior of the sW e seek to estimate the density at X from the M i.i.d realizations X 1 , .., X M . Let c d denote the v olume of a unit h yp er-sphere in d dimensions. The uniform k ernel densit y estimator is defined as follows: A.1 Uniform k ernel densit y estimator The uniform kernel densit y estimator is defined b elow. The volume of the uniform k ernel is giv en b y V u ( X ) = k M , (33) and the kernel region is giv en by S u ( X ) = { Y : c d || X − Y || d ≤ V u } . (34) l u ( X ) denotes the n umber of p oin ts falling in S u ( X ) l u ( X ) = Σ M i =1 1 X i ∈ S u ( X ) , (35) and the uniform kernel densit y estimator is defined by ˆ f u ( X ) = l u ( X ) M V u ( X ) . (36) The c over age of the uniform kernel is defined as U ( X ) = Z S u ( X ) f ( z ) dz = E [1 Z ∈ S u ( X ) ] . (37) 41 W e observ e that l u ( X ) is a binomial random v ariable with parameters M and U ( X ). Figure 19 illustrates the uniform kernel densit y estimate. Figure 19: Uniform k ernel densit y estimator. A.2 T a ylor series expansion of co v erage W e assume that the densit y f has con tinuous partial deriv ativ es of third order in a neigh b orho o d of X . F or small v olumes V u ( X ) (which is equiv alent to the condition that k / M is small), w e can represen t the cov erage function U ( X ) b y using a third order T aylor series expansion of f ab out ab out X [31]. U ( X ) = Z S u ( X ) f ( Z ) d Z = f ( X ) V u ( X ) + c ( X ) V 1+2 /d u ( X ) + o ( V 1+2 /d u ( X )) = f ( X ) k M + c ( X ) k M 1+2 /d + o k M 1+2 /d ! , (38) 42 where c ( X ) = Γ (2 /d ) ( n +2 2 ) tr [ ∇ 2 ( f ( X ))]. A.3 Concen tration inequalities for uniform k ernel densit y Because l u ( X ) is a binomial random v ariable, we can apply standard Chernoff inequalities to obtain concentration b ounds on the density estimate. l u ( X ) is a binomial random v ariable with parameters M and U ( X ). A.3.1 Concen tration around true densit y F or 0 < p < 1 / 2, P r ( l u ( X ) > (1 + p ) M U ( X )) ≤ e − M U ( X ) p 2 / 4 , (39) and P r ( l u ( X ) < (1 − p ) M U ( X )) ≤ e − M U ( X ) p 2 / 4 . (40) Using the T aylor expansion of cov erage, we then ha ve P r ( ˆ f u ( X ) > (1 + p )( f ( X ) + O (( k / M ) 2 /d ))) ≤∼ e − p 2 kf ( X ) / 4 , (41) and P r ( ˆ f u ( X ) < (1 − p )( f ( X ) + O (( k / M ) 2 /d ))) ≤∼ e − p 2 kf ( X ) / 4 . (42) This then implies that P r ( ˆ f u ( X ) > (1 + p ) f ( X )) ≤∼ e − p 2 kf ( X ) / 4 , (43) and P r ( ˆ f u ( X ) < (1 − p ) f ( X )) ≤∼ e − p 2 kf ( X ) / 4 . (44) Let X b e a random v ariable with densit y f indep endent of the M i.i.d realizations X 1 , .., X M . Then, P r ( ˆ f u ( X ) > (1 + p ) f ( X )) = E X [ P r ( ˆ f u ( X ) > (1 + p ) f ( X ))] ≤ E [ ∼ ( e − p 2 kf ( X ) / 4 )] = ∼ e − p 2 k/ 4 , (45) and P r ( ˆ f u ( X ) < (1 − p ) f ( X )) = E X [ P r ( ˆ f u ( X ) < (1 − p ) f ( X ))] ≤ E [ ∼ ( e − p 2 kf ( X ) / 4 )] = ∼ e − p 2 k/ 4 . (46) 43 A.3.2 Concen tration aw a y from 0 W e can also b ound the densit y estimate a wa y from 0 as follo ws: P r ( ˆ f u ( X ) = 0) = E X [ P r ( ˆ f u ( X ) = 0] = E [(1 − U ( X )) M ] = E [(1 − ( k f ( X ) + o ( k ) / M ) M ] = E [((1 − ( k f ( X ) + o ( k ) / M ) M / ( k f ( X )+ o ( k )) ) kf ( X )+ o ( k ) ] = E [ ∼ (1 /e ) kf ( X )+ o ( k ) ] = ∼ e − k . (47) A.4 Cen tral Momen ts Define the error function of the uniform kernel density , e u ( X ) = ˆ f u ( X ) − E [ ˆ f u ( X )] . (48) The probabilit y mass function of the binomial random v ariable l u ( X ) is given by P r ( l u ( X ) = l x ) = M l x ( U ( X )) l x (1 − U ( X )) M − l x . Since l u ( X ) is a binomial random v ariable, we can easily obtain momen ts of the uniform k ernel densit y estimate. These are listed below. First Momen t: E [ ˆ f u ( X )] − f ( X ) = M k U ( X ) − f ( X ) = c ( X ) k M 2 /d + o k M 2 /d ! . (49) Second Momen t: V [ ˆ f u ( X )] = E [ e 2 u ( X )] = M k 2 U ( X )(1 − U ( X )) = f ( X ) 1 k + o 1 k . (50) Higher Momen ts: F or any integer r ≥ 3, E [ e r u ( X )] = O 1 k r/ 2 . (51) 44 A.5 Co v ariance Let X and Y b e t w o distinct p oints. Clearly the density estimates at X and Y are not indep enden t. W e exp ect the densit y estimates to ha ve p ositive co v ariance if X and Y are close and hav e negative cov ariance if X and Y are far. This is illustrated in Figure 20. Figure 20: Cov ariance b etw een uniform kernel density estimates. Observ e that the uniform kernels are disjoin t for the set of p oin ts given by Ψ u := { X , Y } : || X − Y || ≥ 2( k /c d M ) 1 /d , and hav e finite in tersection on the complement of Ψ u . Indeed w e will show that when the uniform balls intersect (and therefore X and Y are close), the densit y estimates hav e p ositive cov ariance and that they hav e negative co v ariance when the uniform k ernels are disjoint. In tersecting and disjoin t balls are illustrated in Figure 21. Define, U ( X , Y ) := E [1 Z ∈ S u ( X ) 1 Z ∈ S u ( Y ) ] . (52) In tersecting balls Lemma A.1. F or a fixe d p air of p oints { X, Y } ∈ Ψ u , 45 0 0.1 0.2 0.3 0.4 0.5 0.6 0.7 0.8 0.9 1 0 0.1 0.2 0.3 0.4 0.5 0.6 0.7 0.8 0.9 1 M samples Points of Density Estimation Intersecting balls Disjoint ball Figure 21: Intersecting and disjoin t balls. C ov [ e u ( X ) , e u ( Y )] = − f ( X ) f ( Y ) M + o 1 M . Pr o of. F or { X , Y } ∈ Ψ u , w e ha v e that 1 Z ∈ S u ( X ) 1 Z ∈ S u ( Y ) = 0 and therefore U ( X , Y ) = 0. W e then ha ve, C ov [ e u ( X ) , e u ( Y )] = E [( ˆ f u ( X ) − E [ ˆ f u ( X )])( ˆ f u ( Y ) − E [ ˆ f u ( Y )])] = M k 2 E [(1 Z ∈ S u ( X ) − U ( X ))(1 Z ∈ S u ( Y ) − U ( Y ))] = M k 2 E [1 Z ∈ S u ( X ) 1 Z ∈ S u ( Y ) − U ( X ) U ( Y )] = M k 2 ( U ( X , Y ) − U ( X ) U ( Y )) = − M k 2 [ U ( X ) U ( Y )] = − f ( X ) f ( Y ) M + o 1 M . Disjoin t balls F or { X , Y } ∈ Ψ c u , there is no closed form expression for the cov ariance. Ho wev er we hav e the following lemmas: 46 Let R u ( X ) and R u ( Y ) denote the (constan t and equal) radii of the uniform balls resp ectiv ely . Define ℵ ( || X − Y || /R u ( X )) = V ( S u ( X ) ∩ S u ( Y )) /V u ( X ) where V ( S u ( X ) ∩ S u ( Y )) is the v olume of the intersection of the tw o balls. W e observ e that, ℵ ( || X − Y || /R u ( X )) = V ( S u ( X ) ∩ S u ( Y )) /V u ( X ) = V [1 Z ∈ B (0 ,R u ( X )) 1 Z ∈ B ( || Y − X || ,R u ( Y )) ] V u ( X ) = V [1 Z ∈ B (0 , 1) 1 Z ∈ B ( || Y − X || /R u ( X ) , 1) ] V [1 Z ∈ B (0 , 1) ] = O (1) . (53) Because f is assumed to b e contin uous, we hav e U ( X , Y ) = E [1 Z ∈ S u ( X ) 1 Z ∈ S u ( Y ) ] = [ f ( X ) + o (1)] V ( S u ( X ) ∩ S u ( Y )) . (54) Lemma A.2. F or a fixe d p air of p oints { X, Y } ∈ Ψ u c , C ov [ e u ( X ) , e u ( Y )] = O (1 /k ) . Pr o of. M k 2 U ( X , Y ) = M k 2 [ f ( X ) + o (1)] V ( S u ( X ) ∩ S u ( Y )) = f ( X ) + o (1) k V ( B X ∩ B Y ) V u ( X ) = f ( X ) + o (1) k ℵ ( || X − Y || /R u ( X )) = f ( X ) k ℵ ( || X − Y || /R u ( X )) + o (1 /k ) = O (1 /k ) . Therefore, C ov [ e u ( X ) , e u ( Y )] = E [( ˆ f u ( X ) − E [ ˆ f u ( X )])( ˆ f u ( Y ) − E [ ˆ f u ( Y )])] = M k 2 ( U ( X , Y ) − U ( X ) U ( Y )) = M k 2 U ( X , Y ) − M k 2 U ( X ) U ( Y ) = O (1 /k ) − Θ(1 / M ) = O (1 /k ) . 47 Lemma A.3. Z y U ( X , y ) dy = [ f ( X ) + o (1)] V u ( X ) 2 . Pr o of. W e note that for U ( X , y ) 6 = 0, we need { X , y } ∈ Ψ c u . W e therefore hav e, f ( y ) = f ( X ) + o (1). Z y U ( X , y ) dy = Z [ f ( X ) + o (1)] V ( S u ( X ) ∩ S u ( Y )) dy = V u ( X )[ f ( X ) + o (1)] Z ℵ ( || X − y || /R u ( X )) dy = V u ( X )[ f ( X ) + o (1)] R u ( X ) d Z ℵ ( || y || /R u ( X )) d ( y/R u ( X )) = V u ( X )[ f ( X ) + o (1)] V u ( X ) c d Z ℵ ( || y || /R u ( X )) d ( y/R u ( X )) = [ f ( X ) + o (1)] V 2 u ( X ) c d Z ℵ ( δ ) d ( δ ) . The in tegral R ℵ ( δ ) d ( δ ) can b e sho wn to b e equal to c d for all dimensions d . W e then ha ve, Z y U ( X , y ) dy = [ f ( X ) + o (1)] V 2 u ( X ) = [ f ( X ) + o (1)] k M 2 . Lemma A.4. L et γ 1 ( X ) , γ 2 ( X ) b e arbitr ary c ontinuous functions. L et X 1 , .., X M , X , Y denote M + 2 i.i.d r e alizations of the density f . Then, C ov [ γ 1 ( X ) e u ( X ) , γ 2 ( Y ) e u ( Y )] = C ov [ γ 1 ( X ) f ( X ) , γ 2 ( X ) f ( X )] M + o (1 / M ) . 48 Pr o of. C ov [ γ 1 ( X ) e u ( X ) , γ 2 ( Y ) e u ( Y )] = E h γ 1 ( X ) γ 2 ( Y )( ˆ f u ( X ) − E [ ˆ f u ( X )])( ˆ f u ( Y ) − E [ ˆ f u ( Y )]) i = 1 M V u ( X ) V u ( Y ) E [ γ 1 ( X ) γ 2 ( Y )( U ( X , Y ) − U ( X ) U ( Y ))] = 1 M V 2 u ( X ) E [ γ 1 ( X ) γ 2 ( Y ) U ( X , Y )] − 1 M V 2 u ( X ) E [ γ 1 ( X ) γ 2 ( Y ) U ( X ) U ( Y )] = I − I I . I I = 1 M ( E [ γ 1 ( X ) f ( X )] E [ γ 2 ( Y ) f ( Y )]) . I = 1 M V 2 u ( X ) E [ γ 1 ( X ) γ 2 ( Y ) U ( X , Y )] = 1 M V 2 u ( X ) Z Z γ 1 ( x ) γ 2 ( y ) f ( x ) f ( y ) U ( x, y ) dxdy . No w for U ( x, y ) 6 = 0, we need { x, y } ∈ Ψ c u . W e therefore hav e, γ 2 ( y ) f ( y ) = γ 2 ( x ) f ( x ) + o (1). W e then ha ve, I = 1 M V 2 u ( X ) Z Z [ γ 1 ( x ) γ 2 ( x ) f 2 ( x ) + o (1)] U ( x, y ) dxdy = 1 M V 2 u ( X ) Z [ γ 1 ( x ) γ 2 ( x ) f 2 ( x ) + o (1)] Z U ( x, y ) dy dx = 1 M V 2 u ( X ) Z [ γ 1 ( x ) γ 2 ( x ) f 2 ( x ) + o (1)] ( f ( x ) + o (1)) V u ( x ) 2 dx = 1 M Z [ γ 1 ( x ) γ 2 ( x ) f 2 ( x ) + o (1)]( f ( x ) + o (1)) dx = 1 M E [ γ 1 ( X ) γ 2 ( X ) f 2 ( X )] + o (1) = 1 M E [ γ 1 ( X ) γ 2 ( X ) f 2 ( X )] + o (1 / M ) . A.6 Higher cross momen ts Disjoin t balls W e hav e the following results concerning higher cross momen ts for disjoint balls: 49 Lemma A.5. L et q , r b e p ositive inte gers satisfying q + r > 2 . F or a fixe d p air of p oints { X , Y } ∈ Ψ u c , C ov ( e q u ( X ) , e r u ( Y )) = o (1 / M ) . Pr o of. F or a fixed pair of p oints { X , Y } ∈ Ψ u c , the joint probabilit y mass function of the functions l u ( X ), l u ( Y ) is giv en by P r ( l u ( X ) = l x , l u ( Y ) = l y ) = 1 l x + l y ≤ M M l x , l y ( U ( X )) l x ( U ( Y )) l y (1 − U ( X ) − U ( Y )) M − l x − l y . W e also ha ve from c hernoff inequalities for binomial random v ariables that P r ((1 − p ) k < l u ( X ) < (1 + p ) k ) = 1 − e − p 2 k , P r ((1 − p ) k < l u ( Y ) < (1 + p ) k ) = 1 − e − p 2 k . Denote the high probability ev ent χ b y (1 − p ) k < l u ( X ) , l u ( Y ) < (1 + p ) k . Define ˆ l u ( X ), ˆ l u ( Y ) to b e binomial random v ariables with parameters { U ( X ), M − q } and { U ( Y ), M − r } resp ectiv ely . The co v ariance b et ween p ow ers of density estimates is then given by C ov ( ˆ f q u ( X ) , ˆ f r u ( Y )) = 1 k q + r C ov ( l q u ( X ) , l r u ( Y )) = 1 k q + r X l q x l r y P r ( l u ( X ) = l x , l u ( Y ) = l y ) − 1 k q + r X l q x l r y P r ( l u ( X ) = l x ) P r ( l u ( Y ) = l y ) = X χ l q x l r y k q + r [ P r ( l u ( X ) = l x , l u ( Y ) = l y ) − P r ( l u ( X ) = l x ) P r ( l u ( Y ) = l y )] + O ( e − p 2 k ) = X χ f q ( X ) f r ( Y ) l q x l r y U q ( X ) U r ( Y ) k q + r ( l x × . . . × l x − q + 1)( l y × . . . × l y − r + 1) × [( M × . . . × M − ( q + r − 1)) P r ( ˆ l u ( X ) = l x , ˆ l u ( Y ) = l y ) − ( M × . . . × M − q + 1)( M × . . . × M − r + 1) P r ( ˆ l u ( X ) = l x ) P r ( ˆ l u ( Y ) = l y )] + o (1 / M ) = f q ( X ) f r ( Y ) M q + r + O 1 k M q + r × X χ [( M × . . . × M − ( q + r − 1)) P r ( ˆ l u ( X ) = l x , ˆ l u ( Y ) = l y ) − ( M × . . . × M − ( q − 1))( M × . . . × M − ( r − 1)) P r ( ˆ l u ( X ) = l x ) P r ( ˆ l u ( Y ) = l y )] + o (1 / M ) 50 = f q ( X ) f r ( Y ) M q + r + O 1 k M q + r × [( M × . . . × M − ( q + r − 1)) − ( M × . . . × M − ( q − 1))( M × . . . × M − ( r − 1))] + o (1 / M ) = − q r f q ( X ) f r ( Y ) M + o 1 M . Then, the cov ariance b etw een the p o wers of the error function is given by C ov ( e q u ( X ) , e r u ( Y )) = C ov (( ˆ f u ( X ) − E [ ˆ f u ( X )]) q , ( ˆ f u ( Y ) − E [ ˆ f u ( Y )]) r ) = q X a =1 r X b =1 q a r b ( − E [ ˆ f u ( X )]) a ( − E [ ˆ f u ( Y )]) b C ov ( ˆ f a u ( X ) , ˆ f b u ( Y )) = q X a =1 r X b =1 q a r b [( − f ( X )) a ( − f ( Y )) b + o (1)] C ov ( ˆ f a u ( X ) , ˆ f b u ( Y )) = − f q ( X ) f r ( Y ) q X a =1 r X b =1 q a r b ( − 1) a a ( − 1) b b M + o 1 M = 1 { q =1 ,r =1 } − f ( X ) f ( Y ) M + o (1 / M ) = o (1 / M ) . where the last step follo ws from the condition that q + r > 2. In tersecting balls F or { X , Y } ∈ Ψ u c , w e ha v e the follo wing b ounds Lemma A.6. L et γ 1 ( X ) , γ 2 ( X ) b e arbitr ary c ontinuous functions. L et X 1 , .., X M , X , Y denote M + 2 i.i.d r e alizations of the density f . A lso let the indic ator function 1 ∆ u ( X , Y ) denote the event ∆ u : { X , Y } ∈ Ψ u c . F or q , r p ositive inte gers satisfying q + r > 1 , E [ 1 ∆ u ( X , Y ) γ 1 ( X ) γ 2 ( Y ) e q u ( X ) e r u ( Y )] = o 1 M , (55) 51 Pr o of. F or 1 ∆ u ( X , Y ) 6 = 0, w e ha ve { X , Y } ∈ Ψ c u . Then, E [ 1 ∆ u ( X , Y ) γ 1 ( X ) γ 2 ( Y ) e q u ( X ) e r u ( Y )] = E [ 1 ∆ u ( X , Y ) γ 1 ( X ) γ 2 ( Y ) E X , Y [ e q u ( X ) e r u ( Y )]] ≤ E 1 ∆ u ( X , Y ) γ 1 ( X ) γ 2 ( Y ) q E X [ e 2 q u ( X )] E Y [ e 2 r u ( Y )] = E 1 ∆ u ( X , Y ) γ 1 ( X ) γ 2 ( Y ) O 1 k q + r/ 2 = Z O 1 k q + r/ 2 ( γ 1 ( x ) γ 2 ( x ) + o (1)) Z ∆ u ( x, y ) dy dx = Z O 1 k q + r/ 2 ( γ 1 ( x ) γ 2 ( x ) + o (1)) 2 d k M dx = o 1 M . where the b ound is obtained using the Cauch y-Sc hw arz inequality and using Eq.51. W e can succinctly state the results deriv ed in the last t wo lemmas in the form of the following lemma: Lemma A.7. L et γ 1 ( X ) , γ 2 ( X ) b e arbitr ary c ontinuous functions. L et X 1 , .., X M , X , Y denote M + 2 i.i.d r e alizations of the density f . If q , r ar e p ositive inte gers satisfying q + r > 2 C ov [ γ 1 ( X ) e q u ( X ) , γ 2 ( Y ) e r u ( Y )] = o (1 / M ) . Pr o of. The result for the case q = 1, r = 1 w as established earlier in Lemma A.4. C ov [ γ 1 ( X ) e q u ( X ) , γ 2 ( Y ) e r u ( Y )] = I + D , where ’ I ’ stands for the con tribution form the intersecting balls and ’ D ’ for the contribution from the dis-joint balls. I and D are given by I = E [ 1 ∆ u ( X , Y ) C ov [ γ 1 ( X ) e q u ( X ) , γ 2 ( Y ) e r u ( Y )]] , D = E [( 1 − 1 ∆ u ( X , Y )) C ov [ γ 1 ( X ) e q u ( X ) , γ 2 ( Y ) e r u ( Y )]] . W e ha ve already established in the previous lemma that I = o 1 M . No w, D = E [(1 − 1 ∆ u ( X , Y )) γ 1 ( X ) γ 2 ( Y ) E X , Y [ C ov ( e q u ( X ) , e r u ( Y ))]] (56) = E [(1 − 1 ∆ u ( X , Y )) γ 1 ( X ) γ 2 ( Y ) o (1 / M )] = o 1 M . 52 This concludes the pro of. B k -NN densit y estimation In this appendix, moment prop erties of the standard k -NN densit y estimate ˆ f k ( X ) are derived conditioned on X 1 , . . . , X N . As the samples X 1 , . . . , X N , X N +1 , . . . , X T , T = M + N are i.i.d., these conditional moments are indep enden t of the N samples X 1 , .., X N . B.1 Preliminaries Let d ( X , Y ) denote the Euclidean distance b et w een points X and Y and d ( k ) X denote the Euclidean distance b etw een a point X and its k -th nearest neigh b or amongst X N +1 , .., X N + M . Let c d denote the unit ball v olume in d dimensions. The k -NN region is S k ( X ) = { Y : d ( X , Y ) ≤ d ( k ) X } and the volume of the k -NN region is V k ( X ) = Z S k ( X ) d Z . The standard k -NN density estimator [30] is defined as ˆ f k ( X ) = k − 1 M V k ( X ) . Define the cov erage function as P ( X ) = Z S k ( X ) f ( Z ) d Z . Define spherical regions S r ( X ) = { Y ∈ R d : d ( X , Y ) ≤ r } . B.2 Concen tration inequalit y for co v erage probabilit y It has b een previously established that P ( X ) has a b eta distribution with parameters k , M − k + 1. [31]. Consider a binomial random v ariable with parameters M and P with distribution function B i ( . | M , P ) and a beta random v ariable with parameters k and M − k + 1 with distribution function B e ( . | k , M − k + 1). W e hav e the follo wing identit y , B e ( P | k , M − k + 1) = 1 − B i ( k − 1 | M , P ) . (57) 53 The follo wing Chernoff b ounds for binomial random v ariables hav e also b een established previously . When k < M P , B i ( k | M , P ) ≤ exp [ − ( M P − k ) 2 / 2 P M ], and when k > M P , 1 − B i ( k | M , P ) ≤ exp [ − ( M P − k ) 2 / 2 P M ]. W e therefore ha ve that for some 0 < p < 1 / 2, P r ((1 − p )( k − 1) / M < P ( X ) < ( p + 1)( k − 1) / M ) = O ( e − p 2 k/ 2 ) . (58) Define k M = ( k − 1) / M . Let \ ( X ) denote the ev ent P ( X ) < ( p k + 1) k M , (59) where p k = √ 6 / ( k δ / 2 ). Then, 1 − P r ( \ ( X )) = O ( e − p 2 k k/ 2 ) = O ( e − 3 k (1 − δ ) ). Equiv alen tly , 1 − P r ( \ ( X )) = O ( C ( k )) , (60) where C ( k ) is a function which satisfies the rate of deca y condition C ( k ) = O ( e − 3 k (1 − δ ) ). Similarly , let \ − 1 ( X ) denote the ev ent P ( X ) > (1 − p k ) k M , (61) Then 1 − P r ( \ − 1 ( X )) = O ( C ( k )) , (62) Also let \\ ( X ) = \ ( X ) ∩ \ − 1 ( X ). Then 1 − P r ( \\ ( X )) = O ( C ( k )) , (63) Finally , w e note that Γ( x + a ) / Γ( x ) = x a + o ( x a ). Then for an y a < k , E [ P − a ( X )] exists and is giv en b y E [ P − a ( X )] = Γ( k − a )Γ( M + 1) Γ( k )Γ( M + 1 − a ) = Θ(( k M ) − a ) . (64) B.2.1 In terior p oin ts Let S 0 to b e any arbitrary subset of S I (2) satisfying the condition P r ( Y / ∈ S 0 ) = o (1) where Y is random v ariable with density f . This implies that giv en the even t \ ( X ), the k -NN neigh b orhoo ds S k ( X ) of p oin ts X ∈ S 0 will lie completely inside the domain S . Therefore the density f has contin uous partial deriv ativ es of order 2 ν in the k -NN ball neigh b orho o d S k ( X ) for each X ∈ S 0 (assumption ( A . 2)). W e will no w derive moments for the in terior set of p oin ts X ∈ S 0 . This excludes the set of p oints X close to the b oundary of the supp ort whose k -NN neighborho o ds S k ( X ) in tersect with the b oundary of the supp ort. W e will deal with these p oints in Appendix B. 54 B.2.2 T a ylor series expansion of co verage probability Let X ∈ S 0 . Given the ev en t \ ( X ), the cov erage function P ( X ) can b e represented in terms of the v olume of the k -NN ball V k ( X ) by expanding the density f in a T aylor series ab out X as follows. In particular, for some fixed x ∈ S 0 , let p ( u ) = Z S u ( x ) f ( z ) dz . Using ( A . 2), we can write, by a T a ylor series expansion of f around x using multi-index notation [39] f ( z ) = X 0 ≤| α |≤ 2 ν ( z − x ) α α ! ( ∂ α f )( x ) + o ( || z − x || 2 ν ) (65) Assuming S u ( x ) ⊂ S , we can then write p ( u ) = Z S u ( x ) f ( z ) dz = Z S u ( x ) X | 0 ≤ α ≤ 2 ν | ( z − x ) α α ! ( ∂ α f )( x ) dz + o ( u d +2 ν ) = f ( x ) c d u d + ν − 1 X i =1 c i ( x ) c 1+2 i/d d u d +2 i + o ( u d +2 ν ) . (66) where c i ( x ) are functionals of the deriv atives of f . No w, denote v ( u ) = R S u ( x ) dz to b e the volume of S u ( x ). Let u inv ( v ) b e the in verse function of v ( u ). Note that this in v erse is w ell-defined since v ( u ) is monotonic in u . Since S u ( x ) ⊂ S , v ( u ) = c d u d . This gives u inv ( v ) = ( v /c d ) 1 /d . Define P ( v ) = Z S u inv ( v ) ( x ) f ( z ) dz . Using (66), P ( v ) = f ( X ) v + ν − 1 X i =1 c i ( X ) v 1+2 i/d + o ( v 1+2 ν /d ) . (67) No w denote V ( p ) = P inv ( p ) to b e the in v erse of P ( . ). Note that this inv erse is w ell-defined since P ( v ) is monotonic in v . Dividing (67) by v P ( v ) on b oth sides, w e get 1 v = f ( X ) P ( v ) + ν − 1 X i =1 c i ( X ) P ( v ) v 2 i/d + o ( v 2 ν /d P − 1 ( v )) (68) 55 By rep eatedly substituting the LHS of (68) in the RHS of (68), we can obtain (69): 1 V ( p ) = f ( X ) p + ν − 1 X i =1 h i ( X ) p 1 − 2 i/d + o ( p 2 ν /d − 1 ) , (69) F rom our deriv ation of (69) using (67), it is clear that h i ( X ) are of the form h i ( X ) = X { a i } = A ; A ∈ A Q ν − 1 i =1 c a i i f a 0 ( X ) where A is a ν -tuple of p ositiv e real n umbers a 0 , .., a ν − 1 and the cardinality of A is finite. By assumptions ( A . 1) and ( A . 2), this implies that the constants h i ( X ) are b ounde d . Also, we note that h ( X ) = h 1 ( X ) = c ( X ) f − 2 /d ( X ) [15], where c ( X ) := c 1 ( X ) = Γ (2 /d ) ( d +2 2 ) tr [ ∇ 2 ( f ( X ))]. This then implies that under the even t \ ( X ) 1 V k ( X ) = f ( X ) P ( X ) + X t ∈ T h t ( X ) P 1 − t ( X ) + h r ( X ) , (70) where T = { 2 /d, 4 /d, 6 /d.., 2 ν /d } and h r ( X ) = o ( P 2 ν /d − 1 ( X )). No w, b y ( A . 2), w e hav e ( k / M ) 2 ν /d = o (1 / M ). This implies that 2 ν /d > 1. Under the ev en t \ ( X ), we hav e P ( X ) ≤ ( p k + 1) k / M , which, in conjunction with the condition 2 ν /d > 1 implies that h r ( X ) = o ( P 2 ν /d − 1 ( X )) = o (( k / M ) 2 ν /d − 1 ) = o (1 /k M M ) . (71) On the other hand, under the even t, \ c ( X ), ( p k + 1) k / M ≤ P ( X ) ≤ 1, whic h giv es h r ( X ) = O (1) . (72) B.2.3 Appro ximation to the k -NN density estimator Define the c over age densit y estimate to b e, ˆ f c ( X ) = f ( X ) k − 1 M 1 P ( X ) . The estimate ˆ f c ( X ) is clearly not implementable. Note also that the t wo estimates - ˆ f c ( X ) and ˆ f k ( X ) - are iden tical in the case of the uniform density . 1 V k ( X ) = f ( X ) P ( X ) + h ( X ) P 1 − 2 /d ( X ) + h s ( X ) , (73) where h s ( X ) = o (1 / P 1 − 2 /d ( X )). This giv es, ˆ f k ( X ) = ˆ f c ( X ) + k − 1 M h ( X ) P 1 − 2 /d ( X ) + k − 1 M h s ( X ) . (74) whenev er \ ( X ) is true. 56 B.2.4 Bounds on k -NN density estimates Let X b e a Leb esgue p oint of f , i.e., an X for which lim r → 0 R S r ( X ) f ( y ) dy R S r ( x ) dy = f ( X ) . Because f is an density , we know that almost all X ∈ S satisfy the ab ov e prop ert y . Now, fix ∈ (0 , 1) and find δ > 0 suc h that sup 0 0 is fixed, w e note that the even t P ( X ) ≤ P ( δ ) is a subset of \ ( X ) and therefore (75) holds under \ ( X ). Under the even t \ c ( X ), we can b ound V k ( X ) from ab ov e by c d D d . Also, since V k ( X ) is mono- tone in P ( X ), under the ev ent \ c ( X ), we can b ound V k ( X ) from b elow b y (1 + p k )( k − 1) /M (1 − ) f ( X ) and therefore by ( k − 1) /M (1 − ) f ( X ). W ritten explicitly , ( k − 1) M (1 − ) f ( X ) ≤ V k ( X ) ≤ c d D d (77) and in turn implies ( k − 1) / ( M c d D d ) ≤ ˆ f k ( X ) ≤ (1 − ) f ( X ) . (78) Finally , note that k M / P ( X ) is b ounded ab o ve by O (1) under the ev en t \ ( X ). This implies that for any a < k , E [ \ c ( X )] k a M P − a ( X ) ≤ O (1) P r ( \ c ( X )) = O ( C ( k )) . (79) 57 B.3 Bias of the k -NN density estimates Let X ∈ S 0 . W e can analyze the bias of k -NN densit y estimates as follows by using (74) E [1 \ ( X ) ˆ f k ( X )] = E [1 \ ( X ) ˆ f c ( X )] + E 1 \ ( X ) k − 1 M h ( X ) P 1 − 2 /d ( X ) + E 1 \ ( X ) k − 1 M h s ( X ) = E [1 \ ( X ) ˆ f c ( X )] + E 1 \ ( X ) k − 1 M h ( X ) P 1 − 2 /d ( X ) + o E 1 \ ( X ) k − 1 M P 2 /d − 1 ( X ) = E [ ˆ f c ( X )] + E k − 1 M h ( X ) P 1 − 2 /d ( X ) + o k M 2 /d + O ( C ( k )) = f ( X ) + h ( X ) k M 2 /d + o k M 2 /d , (80) where we used the fact that under the ev ent \ c ( X ), (( k − 1) / M ) P 1 − t ( X ) = O (1) for an y t > = 0, whic h in turn gives E [1 \ c ( X ) (( k − 1) / M ) P 1 − t ( X )] = O ( P r ( \ c ( X ))) = O ( C ( k )). This implies that E [ ˆ f k ( X )] − f ( X ) = E [1 \ ( X ) ˆ f k ( X )] + E [1 \ c ( X ) ˆ f k ( X )] − f ( X ) = h ( X ) k M 2 /d + o k M 2 /d + O ( C ( k )) + E [1 \ c ( X ) ˆ f k ( X )] = h ( X ) k M 2 /d + o k M 2 /d + O ( C ( k )) , (81) where the last step follo ws b ecause , by (78), 1 \ c ( X ) ˆ f k ( X ) = O (1). This expression is true for k > = 3 b y (64). Next, assuming that (8) holds, w e ev aluate E [ g ( ˆ f k ( X ) , X )] in an iden tical fashion to the deriv ation of (81). E [1 \ ( X ) g ( ˆ f k ( X ) , X )] = E h 1 \ ( X ) g ˆ f c ( X ) + k M h ( X )( P ( X )) 2 /d − 1 + k M h s ( X ) , X i = E h 1 \ ( X ) g ˆ f c ( X ) + k M h ( X )( P ( X )) 2 /d − 1 + k M o (( P ( X )) 2 /d − 1 ) , X i = E h g ˆ f c ( X ) + k M h ( X )( P ( X )) 2 /d − 1 + k M o (( P ( X )) 2 /d − 1 ) , X i + O ( C ( k )) = E h g ( ˆ f c ( X ) , X ) + g 0 ( ˆ f c ( X ) , X ) k M h ( X )( P ( X )) 2 /d − 1 + o ( k M P ( X )) 2 /d − 1 ) i + O ( C ( k )) = g ( f ( X ) , X ) g 1 ( k , M ) + g 2 ( k , M ) + g 0 ( f ( X ) , X ) h ( X )( k / M ) 2 /d + o (( k / M ) 2 /d ) + O ( C ( k )) . This giv es, E [ g ( ˆ f k ( X ) , X )] = E [1 \ ( X ) g ( ˆ f k ( X ) , X )] + E [1 \ c ( X ) g ( ˆ f k ( X ) , X )] = g ( f ( X ) , X ) g 1 ( k , M ) + g 2 ( k , M ) + g 0 ( f ( X ) , X ) h ( X )( k / M ) 2 /d + o (( k / M ) 2 /d ) + O ( C ( k )) . (82) 58 B.4 Momen ts of error function Let γ 1 ( X ), γ 2 ( X ) b e arbitrary contin uous functions satisfying the condition: sup X [ γ i ( X )] is finite, i = 1 , 2. Also let γ ( X ) = γ 1 ( X ). Let X 1 , .., X M , X , Y denote M + 2 i.i.d realizations of the density f . Let q , r b e arbitrary p ositiv e integers less than k . Define the error function e k ( X ) = ˆ f k ( X ) − E [ ˆ f k ( X ) | X ] . Then, Lemma B.1. E 1 { X ∈ S 0 } γ ( X ) e q k ( X ) = O ( k − q δ / 2 ) + o (1 / M ) + O ( C ( k )) . (83) Lemma B.2. C ov 1 { X ∈ S 0 } γ 1 ( X ) e q k ( X ) , 1 { Y ∈ S 0 } γ 2 ( Y ) e r k ( Y ) = O 1 k (( q + r ) δ / 2 − 1) M + O ( k 2 /d M / M ) + O (1 / M 2 ) + O ( C ( k )) . (84) Define the op erator M ( Z ) = Z − E [ Z ]. Let β b e any p ositiv e real n umber and define E β ( X ) = k β M ( M ( P − β ( X ))) . (85) Define the terms e c ( X ) = ˆ f c ( X ) − E [ ˆ f c ( X ) | X ] , (86) e t ( X ) = M X t ∈ T k M h t ( X ) P 1 − t ( X )) ! , (87) e r ( X ) = M ( k M h r ( X )) . (88) Note that e c ( X ) = f ( X ) E 1 ( X ) (89) and e t ( X ) = ( X t ∈ T k t M h t ( X )( E 1 − t ( X ))) . (90) Define the even t { X ∈ S 0 } ∩ { \ ( X ) } by † ( X ). Note that under the even t † ( X ), e k ( X ) = e c ( X ) + e t ( X ) + e r ( X ) =: e o ( X ). Also, under the ev en t \ ( X ), P ( X ) ≤ (1 + p k ) k M , which implies that under the ev ent \ ( X ), the following hold E β ( X ) = O (1) , e c ( X ) = O (1) , e t ( X ) = O (1) , e r ( X ) = O (1) , e o ( X ) = O (1) . (91) F urthermore, b y (78), under the even t \ ( X ), e k ( X ) = O (1) . (92) 59 Pr o of. of Lemma B.1. Since P ( X ) is a b eta random v ariable, the probability densit y function of P ( X ) is giv en by f ( p X ) = M ! ( k − 1)!( M − k )! p k − 1 X (1 − p X ) M − k . By (64), E [ P − β ( X )] = Θ(( k / M ) − β ) if β < k . W e will first show that E [ E q β ( X )] = O (1) if q β < k . This in turn implies that, by (89) and (90), E [ e q c ( X )] = O (1) and E [ e q t ( X )] = O (1) for an y q < k . E [ E q β ( X )] = E h k q β M ( P − β ( X ) − E [ P − β ( X )]) q i = k q β M q X i =1 q i ( − 1) q − i E [ P − iβ ( X )] E [ P − ( q − i ) β ( X )] = k q β M q X i =1 q i ( − 1) q − i Θ(( k / M ) − iβ )Θ(( k / M ) − ( q − i ) β ) = q X i =1 q i ( − 1) q − i Θ(1) = O (1) . (93) By (63) and (93), E [1 \\ c ( X ) E q β ( X )] = O ( C ( k )) . By the definition of \\ ( X ), 1 \\ ( X ) E q β ( X ) = O k − ( δ q / 2) , (94) and therefore E [1 \\ ( X ) E q β ( X )] = O k − ( δ q / 2) . This giv es, E [ E q β ( X )] = O ( k − δ q / 2 ) + O ( C ( k )) . (95) F rom this analysis on E β ( X ), it trivially follo ws from (89) that E [ e l c ( X )] = O ( k − δ l/ 2 ) + O ( C ( k )) . (96) Also observ e that by (71) and (72), E [ e l r ( X )] = E [1 \ ( X ) e l r ( X )] + E [1 \ c ( X ) e l r ( X )] = o (1 / M l ) + O ( C ( k )) . (97) W e will no w bound e l t ( X ). Let L = P t ∈ T l t t . Now, using (90), e l t ( X ) can b e expressed as a sum of terms of the form ( k / M ) L l l 1 ,..,l t Q t ∈ T ( h l t ( X ) E l t t ( X )) where P t l t = l . No w, w e can b ound each of these summands using (94) as follows: ( k / M ) l E [ Y t ∈ T E l t t ( X )] = ( k / M ) L E [1 \\ ( X ) Y t ∈ T E l t t ( X )] + ( k / M ) L E [1 \\ c ( X ) Y t ∈ T E l t t ( X )] = ( k / M ) L Y t ∈ T O ( k − l t δ / 2 ) + O ( C ( k )) = ( k / M ) L O ( k − lδ / 2 ) + O ( C ( k )) = o ( k − lδ / 2 ) + O ( C ( k )) . (98) 60 This implies that E [ e l t ( X )] = o ( k − lδ / 2 ) + O ( C ( k )) . (99) Note that e q o ( X ) will contain terms of the form ( e c ( X ) + e t ( X )) l ( e r ( X )) q − l . If l < q , the exp ectation of this term can b e b ounded as follo ws | E [( e c ( X ) + e t ( X )) l ( e r ( X )) q − l ] | ≤ q E [( e c ( X ) + e t ( X )) 2 l ] E [( e r ( X )) 2( q − l ) ] = q O (1) 2 l ( o (1 / M )) 2( q − l ) = O (1) × ( o (1 / M )) q − l = o (1 / M ) . (100) Let us concentrate on the case l = q . In this case, e q k ( X ) will contain terms of the form ( e c ( X )) m ( e t ( X )) q − m . F or m < q , | E [( e c ( X )) m ( e t ( X )) q − m ] | ≤ q E [( e c ( X )) 2 l ] E [( e t ( X )) 2( q − l ) ] = O ( k − mδ / 2 ) × o ( k − ( q − m ) δ / 2 ) + C ( k ) = o ( k − q δ / 2 ) + O ( C ( k )) . (101) This therefore implies that, b y (96), (97), (99), (100) and (101), E [ e q o ( X )] = E [ e q c ( X )] + o ( k − q δ / 2 ) + C ( k ) = O ( k − q δ / 2 ) + o ( k − q δ / 2 ) + o (1 / M ) + C ( k ) = O ( k − q δ / 2 ) + o (1 / M ) + C ( k ) . (102) This finally implies that E 1 { X ∈ S 0 } γ ( X ) e q k ( X ) = E 1 † ( X ) γ ( X ) e q k ( X ) + O ( C ( k )) ( by (92)) = E 1 † ( X ) γ ( X ) e q o ( X ) + O ( C ( k )) = E 1 { X ∈ S 0 } γ ( X ) e q o ( X ) + O ( C ( k )) ( by (91)) = O ( k − q δ / 2 ) + o (1 / M ) + O ( C ( k )) . (103) This concludes the pro of. Before proving Lemma B.2, we seek to answer the follo wing question: for which set of pair of p oints { X , Y } are the k -NN balls disjoint? 61 B.4.1 In tersecting and disjoint balls Define Ψ := { X , Y } ∈ S 0 : || X − Y || ≥ R ( X ) + R ( Y ) where R ( X ) and R ( Y ) are the ball radii of the spherical regions S u ( X ) and S u ( Y ), such that R S u ( X ) f ( z ) dz = R S u ( Y ) f ( z ) dz = (1 + p k ) k M . W e will no w sho w that for { X , Y } ∈ Ψ , the k -NN balls will b e disjoin t with exp onen tially high probability . Let d ( k ) X and d ( k ) Y denote the k -NN distances from X and Y and let Υ denote the ev ent that the k -NN balls in tersect. F or { X, Y } ∈ Ψ , P r ( Υ ) = P r ( d ( k ) X + d ( k ) Y ≥ || X − Y || ) ≤ P r ( d ( k ) X + d ( k ) Y ≥ R ( X ) + R ( Y )) . ≤ P r ( d ( k ) X ≥ R ( X )) + P r ( d ( k ) Y ≥ R ( Y )) = P r ( P ( X ) ≥ ( p k + 1)(( k − 1) / M )) + P r ( P ( Y ) ≥ ( p k + 1)(( k − 1) / M )) = 2 C ( k ) , where the last inequality follows from the concentration inequality (58). W e conclude that for { X , Y } ∈ Ψ , the probability of intersection of k -NN balls cen tered at X and Y decays exp onen tially in p 2 k k . Stated in a differen t wa y , w e hav e sho wn that for a given pair of p oints { X , Y } , if the balls around these p oints are disjoin t, then the k -NN balls will b e disjoint with exp onentially high probabilit y . Let ∆ ( X , Y ) denote the even t { X , Y } ∈ Ψ c . F rom the definition of the region Ψ , w e ha v e P r ( { X , Y } ∈ Ψ c ) = O ( k / M ). Let { X , Y } ∈ Ψ and let q , r b e non-negative in tegers satisfying q + r > 1. The even t that the k -NN balls intersect is given by Υ := { d ( k ) X + d ( k ) Y > || X − Y ||} . The joint probabilit y distribution of P ( X ) and P ( Y ) when the k -NN balls do not intersect =: Υ c is giv en b y f Υ c ( p X , p Y ) = M ! ( p X p Y ) k − 1 ( k − 1)! 2 (1 − p X − p Y ) M − 2 k ( M − 2 k )! . Define i ( p X , p Y ) = Γ( t )Γ( u )Γ( v ) Γ( t + u + v ) p t − 1 X p u − 1 Y (1 − p X − p Y ) v − 1 , and note that Z 1 p X =0 Z 1 p Y =0 1 { p X + p Y ≤ 1 } i ( p X , p Y ) dp X dp Y = 1 . Figure 22 shows the distribution of the M samples when the k -NN balls are disjoin t. No w note that i ( p X , p Y ) corresp onds to the density function f Υ c ( p X , p Y ) for the choices t = k , u = k and v = M − 2 k + 1. F urthermore, for { X , Y } ∈ Ψ , the set Q := { p X , p Y } : p X , p Y ≤ (1 + p k )( k − 1) / M is a subset of the region T := { p X , p Y } : 0 ≤ p X , p Y ≤ 1; p X + p Y ≤ 1. Note that E [1 Q ] = 1 − C ( k ). This implies that exp ectations o v er the region R := { p X , p Y } : 0 ≤ p X , p Y ≤ 1; should b e of the same order as the exp ectations ov er T with differences of order C ( k ). In particular, for t, u < k , E [ P − t ( X ) P − u ( Y )] = E [1 T P − t ( X ) P − u ( Y )] + C ( k ) . 62 0 0.1 0.2 0.3 0.4 0.5 0.6 0.7 0.8 0.9 1 0 0.1 0.2 0.3 0.4 0.5 0.6 0.7 0.8 0.9 1 M samples Points of Density Estimation kNN balls M−2k samples k−1 samples k−1 samples kth sample kth sample Figure 22: Distribution of samples when k -NN balls are disjoint. F rom the join t distribution represen tation, it follo ws that E [1 T P − t ( X ) P − u ( Y )] E [ P − t ( X )] E [ P − u ( Y )] = Γ( M − t )Γ( M − u ) Γ( M − t − u )Γ( M ) = − tu M + O (1 / M 2 ) . (104) No w observ e that ( k M ) t + u C ov ( P − t ( X ) , P − u ( Y )) = ( k M ) t + u [ E [ P − t ( X ) P − u ( Y )] − E [ P − t ( X )] E [ P − u ( Y )]] = ( k M ) t + u E [ P − t ( X )] E [ P − u ( Y )] E [ P − t ( X ) P − u ( Y )] E [ P − t ( X )] E [ P − u ( Y )] − 1 = ( k M ) t + u Θ( k − t M )Θ( k − u M ) 1 − tu M + o (1 / M 2 ) − 1 (b y (64) and (104)) = − tu M + O (1 / M 2 ) . (105) Then, the cov ariance b etw een the p o wers of the error function E β , for q t, r u < k is given by C ov ( E q t ( X ) , E r u ( Y )) = k ( tq + ur ) M C ov P − t ( X ) − E P − t ( X ) q , P − u ( Y ) − E P − u ( Y ) r = q X a =1 r X b =1 q a r b [( − 1) a + b + o (1)] k ( ta + ub ) M C ov ( P − ta ( X ) , P − ub ( Y )) = − tu q X a =1 r X b =1 q a r b ( − 1) a a ( − 1) b b M + O 1 M 2 = 1 { q =1 ,r =1 } − tu M + O (1 / M 2 ) . (106) Pr o of. of Lemma B.2. Let X 1 , .., X M , X , Y denote M + 2 i.i.d realizations of the density f . 63 Then, iden tical to the deriv ation of (103) in the pro of of Lemma B.1, C ov 1 { X ∈ S 0 } γ 1 ( X ) e q k ( X ) , 1 { Y ∈ S 0 } γ 2 ( Y ) e r k ( Y ) = C ov 1 { X ∈ S 0 } γ 1 ( X ) e q o ( X ) , 1 { Y ∈ S 0 } γ 2 ( Y ) e r o ( Y ) + O ( C ( k )) . Using the exact same arguments as in pro of of Lemma A.1, it can b e shown that the con- tribution of terms e r ( X ), e r ( Y ) to the R.H.S. of the ab ov e equation is o (1 / M ). Define ] ( X , Y ) := γ 1 ( X ) γ 2 ( Y ) C ov { X , Y } [( e c ( X ) + e t ( X )) q , ( e c ( Y ) + e t ( Y )) r ]. Thus, C ov 1 { X ∈ S 0 } γ 1 ( X ) e q k ( X ) , 1 { Y ∈ S 0 } γ 2 ( Y ) e r k ( Y ) = E [1 { X , Y ∈ S 0 } ] ( X , Y )] + O ( C ( k )) = E [ 1 ∆ c ( X , Y ) ] ( X , Y )] + E [ 1 ∆ ( X , Y ) ] ( X , Y )] + O ( C ( k )) = I + I I + O ( C ( k )) . F or { X , Y } ∈ Ψ c The cov ariance term C ov { X , Y } [( e c ( X ) + e t ( X )) q , ( e c ( Y ) + e t ( Y )) r ] can b e sho wn to b e O ( k − ( q + r ) δ / 2 ) for q , r < k by using Cauc hy-Sc h warz and (100), (101) as follo ws. | C ov [( e c ( X ) + e t ( X )) q , ( e c ( Y ) + e t ( Y )) r ] | ≤ p V [( e c ( X ) + e t ( X )) q ] V [( e c ( Y ) + e t ( Y )) r ] ≤ p E [( e c ( X ) + e t ( X )) 2 q ] E [( e c ( Y ) + e t ( Y )) 2 r ] = q O ( k − (2 q ) δ / 2 ) O ( k − (2 r ) δ / 2 ) = O ( k − ( q + r ) δ / 2 ) . (107) This implies that I I = E [ 1 ∆ ( X , Y ) ] ( X , Y )] = E 1 ∆ ( X , Y ) O ( k − ( q + r ) δ / 2 ) = O 1 k (( q + r ) δ / 2 − 1) M , where the last but one step follows since the probability P r ( { X , Y } ∈ Ψ c ) = O ( k / M ). F or { X , Y } ∈ Ψ No w note that ( e c ( X )+ e t ( X )) q will contain terms of the form ( e c ( X )) m ( e t ( X )) q − m . F or m < q , the term ( e c ( X )) m ( e t ( X )) q − m will b e a sum of terms of the form ( k / M ) ( m + u ) P − ( m + v ) ( X ) for arbitrary v < q − m with u − v > = 2 /d . By (105), the co v ariance term C ov [( e c ( X )) m ( e t ( X )) q − m , ( e c ( Y )) n ( e t ( Y )) r − m ] will b e therefore be O ( k 2 /d M / M ) if either m < q or n < r . On the other hand, if m = q and n = r , C ov [( e c ( X )) q , ( e c ( Y )) r ] = 1 { q =1 ,r =1 } O (1 / M ) + O (1 / M 2 ) by noting that the error e c ( X ) = f ( X ) E 1 ( X ) and subsequently in v oking (106). Therefore I = E [ 1 ∆ c ( X , Y ) ] ( X , Y )] = E h 1 ∆ c ( X , Y ) 1 { q =1 ,r =1 } O (1 / M ) + O ( k 2 /d M / M ) + O (1 / M 2 ) i = 1 { q =1 ,r =1 } O (1 / M ) + O ( k 2 /d M / M ) + O (1 / M 2 ) , where the last step follows from the fact that probabilit y P r ( { X , Y } ∈ Ψ ) = 1 − O ( k / M ) = O (1). 64 B.5 Sp ecific cases W e no w fo cus on ev aluating the sp ecific cases E 1 { X ∈ S 0 } γ ( X ) e 2 k ( X ) and C ov 1 { X ∈ S 0 } γ 1 ( X ) e k ( X ) , 1 { Y ∈ S 0 } γ 2 ( Y ) e k ( Y ) , for k > 2. B.5.1 Ev aluation of E 1 { X ∈ S 0 } γ ( X ) e 2 k ( X ) P ( X ) has a b eta distribution with parameters k , M − k + 1. Therefore for k > 2 E [ E 2 β ( X )] = E h k 2 β M ( P − β ( X ) − E [ P − β ( X )]) 2 i = k 2 β M E [ P − 2 β ( X )] − E [ P − β ( X )] 2 = k 2 β M Γ( k − 2 β )Γ( M + 1) Γ( k )Γ( M + 1 − 2 β ) − Γ( k − β )Γ( M + 1) Γ( k )Γ( M + 1 − β ) 2 ! = O (1 /k ) (108) where the last step follo ws by noting that for any a > 0, Γ( x ) Γ( x + a ) = x − a (1 + o (1 /x )) . F rom ( 103), E 1 { X ∈ S 0 } γ ( X ) e 2 k ( X ) = E 1 { X ∈ S 0 } γ ( X ) e 2 o ( X ) + O ( C ( k )) . (109) Note that e 2 o ( X ) = ( e c ( X )+ e t ( X )+ e r ( X )) 2 is a sum of terms of the form ( e c ( X )) 2 − l − m ( e t ( X )) l ( e r ( X )) m . Also, E [ e 2 c ( X )] = f 2 ( X ) E k 2 M ( P − 1 ( X ) − E [ P − 1 ( X )]) 2 = f 2 ( X ) k 2 M E [ P − 2 ( X )] − E [ P − 1 ( X )] 2 = f 2 ( X ) k 2 β M Γ( k − 2)Γ( M + 1) Γ( k )Γ( M + 1 − 2) − Γ( k − 1)Γ( M + 1) Γ( k )Γ( M ) 2 ! = 1 k + o 1 k . (110) Using (108), identical to the deriv ation of (100) and (101), it is clear that if l + m > 0, E [( e c ( X )) 2 − l − m ( e t ( X )) l ( e r ( X )) m ] = o ( k − 1 ) + o (1 / M ) + O ( C ( k )). This implies that E 1 { X ∈ S 0 } γ ( X ) e 2 k ( X ) = E 1 { X ∈ S 0 } γ ( X ) e 2 o ( X ) + O ( C ( k )) = f 2 ( X ) 1 k + o 1 k . (111) 65 B.5.2 Ev aluation of C ov 1 { X ∈ S 0 } γ 1 ( X ) e k ( X ) , 1 { Y ∈ S 0 } γ 2 ( Y ) e k ( Y ) W e separately analyze disjoint balls and intersecting balls as follo ws: C ov 1 { X ∈ S 0 } γ 1 ( X ) e k ( X ) , 1 { Y ∈ S 0 } γ 2 ( Y ) e k ( Y ) = E [ 1 { X ∈ S 0 } 1 { Y ∈ S 0 } γ 1 ( X ) γ 2 ( Y ) e k ( X ) e k ( Y ) ] = E [ 1 { X ∈ S 0 } 1 { Y ∈ S 0 } γ 1 ( X ) γ 2 ( Y ) e o ( X ) e o ( Y ) ] + O ( C ( k )) = E [ 1 { X ∈ S 0 } 1 { Y ∈ S 0 } γ 1 ( X ) γ 2 ( Y )( e c ( X ) + e t ( X ) + e r ( X ))( e c ( Y ) + e t ( Y ) + e r ( Y )) ] + O ( C ( k )) = E [ 1 { X ∈ S 0 } 1 { Y ∈ S 0 } γ 1 ( X ) γ 2 ( Y )( e c ( X ) + e t ( X ))( e c ( Y ) + e t ( Y )) ] + O ( C ( k )) + o (1 / M ) = E [ 1 ∆ c ( X , Y ) γ 1 ( X ) γ 2 ( Y ) E { X , Y } [( e c ( X ) + e t ( X ))( e c ( Y ) + e t ( Y ))]] + E [ 1 ∆ ( X , Y ) γ 1 ( X ) γ 2 ( Y ) E { X , Y } [( e c ( X ) + e t ( X ))( e c ( Y ) + e t ( Y ))]] + O ( C ( k )) + o (1 / M ) = I + I I + O ( C ( k )) + o (1 / M ) . F or { X , Y } ∈ Ψ E [( e c ( X ))( e c ( Y ))] = C ov [( e c ( X )) , ( e c ( Y ))] = − f ( X ) f ( Y ) M + O (1 / M 2 ) b y noting that the error e c ( X ) = E 1 ( X ) /f ( X ) and subsequen tly in v oking (106) in conjunc- tion with the condition k > 2. Similarly , using (89), (90) and (106), E [( e c ( X ))( e t ( Y ))] = O ( k 2 /d M / M ) + O (1 / M 2 ) , E [( e t ( X ))( e c ( Y ))] = O ( k 2 /d M / M ) + O (1 / M 2 ) , E [( e t ( X ))( e t ( Y ))] = O ( k 4 /d M / M ) + O (1 / M 2 ) . This implies that I = E [ 1 ∆ c ( X , Y ) E { X , Y } [( e c ( X ) + e t ( X ))( e c ( Y ) + e t ( Y ))]] = E h 1 ∆ c ( X , Y ) − f ( X ) f ( Y )(1 / M ) + O ( k 2 /d M / M ) + O (1 / M 2 ) i = E [1 { X ∈ S 0 } 1 { Y ∈ S 0 } γ 1 ( X ) γ 2 ( Y )( f ( X ) f ( Y ))] − 1 / M + O ( k 2 /d M / M ) + O (1 / M 2 ) = − E [1 { X ∈ S 0 } γ 1 ( X ) f ( X )] E [1 { Y ∈ S 0 } γ 2 ( Y ) f ( Y )] 1 M + O ( k 2 /d M / M ) + O (1 / M 2 ) . (112) where the last but one step follo ws from the fact that probability P r ( { X , Y } ∈ Ψ ) = 1 − O ( k / M ) = O (1). 66 F or { X , Y } ∈ Ψ c First observe that by Cauc hy Sc h warz, and by (108) | E [ E t ( X ) E u ( X )] | ≤ p E [ E 2 t ( X )] E [ E 2 u ( X )] = O (1 /k ). This implies that E [( e c ( X ) + e t ( X ))( e c ( Y ) + e t ( Y ))] = E [ e c ( X ) e c ( Y )] + O ( k 2 /d M /k ) . (113) In subsection B.7, we will sho w Lemma B.5, whic h states that E [ 1 ∆ ( X , Y ) γ 1 ( X ) γ 2 ( Y ) e c ( X ) e c ( Y )] = E [1 { X ∈ S 0 } γ 1 ( X ) γ 2 ( X ) f 2 ( X )] 1 M + o 1 M This implies that I I = E [ 1 ∆ ( X , Y ) E { X , Y } [( e c ( X ) + e t ( X ))( e c ( Y ) + e t ( Y ))]] = E [ 1 ∆ ( X , Y ) E { X , Y } [ e c ( X ) e c ( Y )] + O ( k 2 /d M /k )] = E [ 1 ∆ ( X , Y ) γ 1 ( X ) γ 2 ( Y ) e c ( X ) e c ( Y )] + E h 1 ∆ ( X , Y ) O ( k 2 /d M /k ) i = E [1 { X ∈ S 0 } γ 1 ( X ) γ 2 ( X ) /f 2 ( X )] 1 M + O ( k 2 /d M / M ) + o 1 M (114) where the last step follo ws from recognizing that P r ( { X , Y } ∈ Ψ c ) = O ( k / M ) and O ( k / M ) × 1 /k = O (1 / M ). This implies that C ov 1 { X ∈ S 0 } γ 1 ( X ) e k ( X ) , 1 { Y ∈ S 0 } γ 2 ( Y ) e k ( Y ) = I + I I + O ( C ( k )) + o (1 / M ) = C ov [1 { X ∈ S 0 } γ 1 ( X ) /f ( X ) , 1 { Y ∈ S 0 } γ 2 ( Y ) /f ( Y )] 1 M + o (1 / M ) + O ( C ( k )) . (115) B.6 Summary Noting that δ > 2 / 3, the equations (83), (B.2), (111), (115) imply that for p ositive in tegers q , r < k , E 1 { X ∈ S 0 } γ ( X ) e q k ( X ) = 1 { q =2 } E 1 { X ∈ S 0 } γ ( X ) f 2 ( X ) 1 k + o 1 k + O ( C ( k )) , (116) C ov 1 { X ∈ S 0 } γ 1 ( X ) e q k ( X ) , 1 { Y ∈ S 0 } γ 2 ( Y ) e r k ( Y ) = 1 { q ,r =1 } C ov [1 { X ∈ S 0 } γ 1 ( X ) f ( X ) , 1 { Y ∈ S 0 } γ 2 ( Y ) f ( Y )] 1 M + o (1 / M ) + 1 { q + r> 2 } O 1 k (( q + r ) δ / 2 − 1) M + O ( k 2 /d M / M ) + O (1 / M 2 ) + O ( C ( k )) . (117) 67 B.7 Ev aluation of E [ e c ( X ) e c ( Y )] for { X , Y } ∈ Ψ c F or { X , Y } ∈ Ψ c , it will b e sho wn that the cross-correlations E [ e c ( X ) e c ( Y )] of the cov erage densit y estimator and an oracle uniform k ernel densit y estimator (defined below) are iden tical up to leading terms (without explicitly ev aluating the cross-correlation b et ween the cov erage densit y estimates) and then deriv e the correlation of the oracle density estimator to obtain corresp onding results for the cov erage estimate. Oracle ball density estimate In order to estimate cross momen ts for the k -NN density estimator, the b al l density estimator is introduced. The -ball densit y estimator is a k ernel densit y estimator that uses a uniform kernel with bandwidth which dep ends on the unkno wn densit y f . Let the volume of the kernel b e V ( X ) and the corresp onding kernel region b e S ( X ) = { Y ∈ S : c d || X − Y || d ≤ V ( X ) } . The v olume is c hosen suc h that the cov erage Q ( X ) = R S ( X ) f ( z ) dz is set to (1 + p k ) k / M . Let l ( X ) denote the n umber of points among { X 1 , .., X M } falling in S ( X ): l ( X ) = Σ M i =1 1 X i ∈ S ( X ) . The b al l density estimator is defined as ˆ f ( X ) = l ( X ) M V ( X ) . (118) Also define the error e ( X ) as e ( X ) = ˆ f ( X ) − E [ ˆ f ( X )]. It is then p ossible to pro ve the follo wing lemma using results on the volumes of in tersections of hyper spheres (refer App endix A for details). Lemma B.3. L et γ 1 ( X ) , γ 2 ( X ) b e arbitr ary c ontinuous functions. L et X 1 , .., X M , X , Y denote M + 2 i.i.d r e alizations of the density f . Then, E 1 ∆ ( X , Y ) γ 1 ( X ) e ( X ) γ 2 ( Y ) e ( Y ) = E [1 { X ∈ S 0 } γ 1 ( X ) γ 2 ( X ) f 2 ( X )] 1 M + o 1 M . Next, the cross-correlations of the cov erage densit y estimator and the ball densit y estimator are sho wn to b e asymptotically equal. In particular, Lemma B.4. E [ e c ( X ) e c ( Y )] = E [ e ( X ) e ( Y )] + o (1 /k ) . Pr o of. W e b egin b y establishing the conditional density and exp ectation of ˆ f ( X ) given ˆ f c ( X ). W e drop the dep endence on X and denote l = Σ M i =1 1 { X i ∈ S ( X ) } , the k -NN cov erage b y P and the ball co v erage Q ( X ) b y Q . Let q = Q/ P and r = ( Q − P ) / (1 − P ). The following expressions for conditional densities and exp ectations are derived in [33] P r { l = l | P ; P > Q } = k − 1 l q l (1 − q ) k − 1 − l l = 0 , 1 , . . . , k − 1 0 l = k , k + 1 , . . . , M 68 P r { l = l | P ; P ≤ Q } = 0 l = 0 , 1 , . . . , k − 1 M − k l − k r l − k (1 − r ) M − l l = k , k + 1 , . . . , M whic h implies E [ l = l | P ; P > Q ] = ( k − 1) Q/ P E [ l = l | P ; P ≤ Q ] = 1 − Q 1 − P ( k − M ) + M Using the ab ov e expressions for conditional exp ectations, the following marginal exp ectation are obtained. Denote the density of the co verage P b y f k,M ( p ). Also let ˆ P b e the cov erage corresp onding to the k − 2 nearest neigh b or in a total field of M − 3 p oints. Then E [ ˜ e c ( X ) ˜ e ( X )] = E [ ˆ f ( X ) ˆ f c ( X )] − E [ ˆ f c ( X )] E [ ˆ f ( X )] = E 1 − Q P (1 − P ) ( k − M ) + M / P 1 P ≤ Q + f 2 ( X )( k − 1) k M E ( k − 1) Q/ P 2 1 P >Q − f 2 ( X ) k M Q. = f 2 ( X ) k ( M − 1)( M − 2) ( k − 2)( M − k ) × E [(1 − Q ˆ P )( k − M ) + M ˆ P (1 − ˆ P )] − f 2 ( X ) k M Q + E [(( k − 1) Q (1 − ˆ P ) − (1 − Q ˆ P )( k − M ) + M ˆ P (1 − ˆ P ))(1 ˆ P >Q )] = C × ( I − I I + I I I ) . It can b e sho wn that C × ( I − I I ) = f 2 ( X ) k (1 − Q ) using the fact that ˆ P has a b eta distribution. Note that from the definition of Q = ((1 + p k )( k − 1) / M ), from the concen tration inequality w e ha ve that E [1 ˆ P >Q ] = C ( M ). The remainder ( C × I I I ) can be simplified and b ounded using the Cauch y-Sch w arz inequality and the concentration inequality to sho w C × I I I = o (1 / M ). Therefore, E [ e c ( X ) e ( X )] = f 2 ( X ) k (1 − Q ) + C ( M ) . = f 2 ( X ) k − f 2 ( X ) M + o 1 M = f 2 ( X ) 1 k + o 1 k . (119) No w denote E ( X ) = ( e c ( X ) − e ( X )). Note that E [ E 2 ( X )] = E [ e c ( X ) 2 ] − 2 E [ e c ( X ) e ( X )] + E [ e ( X ) 2 ]. Since E [ e c ( X ) 2 ] = f 2 ( X ) 1 k + o (1 /k ) and E [ e ( X ) 2 ] = f 2 ( X )(1 /k + o (1 /k )) it follo ws from (119) that E [ E ( X )] = o (1 /k ). This result means e c ( X ) and e ( X ) are almost 69 p erfectly correlated. Next express the cov ariance b et ween the cov erage density estimates in terms of the cov ariance b et ween the ball estimates as follows: E [ e c ( X ) e c ( Y )] = E [( e ( X ) + E ( X ))( e ( Y ) + E ( Y ))] = E [ e ( X ) e ( Y )] + E [ e ( X )( E ( Y ))] + E [ e ( Y )( E ( X ))] + E [( E ( X ))( E ( Y ))] = I + I I + I I I + I V . Using Cauch y-Sch w arz, a b ound on eac h of the terms I I , I I I and I V is obtained in terms of E [ E ( X )]: | I I | ≤ p E [ E ( Y )] E [ e 2 ( X )], | I I I | ≤ p E [ E ( X )] E [ e 2 ( Y )] and | I V | ≤ p E [ E ( X )] E [ E ( Y )]. Note that the ab ov e application of Cauch y-Sc hw arz de c ouples the problem of join t exp ecta- tion of density estimates lo cated at t wo differ ent p oin ts X and Y to a problem of estimating the error E b et ween tw o different density estimates at the same p oint(s). Therefore all the three terms I I , I I I and I V are o (1 /k ). This concludes the pro of of Lemma B.4. F or Lemma B.4 to b e useful, E [ e ( X ) e ( Y )] m ust b e orders of magnitude larger than the error o (1 /k ), whic h is indeed the case for { X , Y } ∈ Ψ c since E [ e ( X ) e ( Y )] = O (1 /k ) (Lemma A.2, App endix .1) for such X and Y . This lemma can b e used along with previously established results on co-v ariance of -ball density estimates (Lemma B.3) to obtain the following result: Lemma B.5. L et γ 1 ( X ) , γ 2 ( X ) b e arbitr ary c ontinuous functions. L et X 1 , .., X M , X , Y denote M + 2 i.i.d r e alizations of the density f . Then, E [ 1 ∆ ( X , Y ) γ 1 ( X ) γ 2 ( Y ) e c ( X ) e c ( Y )] = E [1 { X ∈ S 0 } γ 1 ( X ) γ 2 ( X ) f 2 ( X )] 1 M + o 1 M Pr o of. E [ 1 ∆ ( X , Y ) γ 1 ( X ) γ 2 ( Y ) E X , Y [ e c ( X ) e c ( Y )]] = E [ 1 ∆ ( X , Y ) γ 1 ( X ) γ 2 ( Y ) e ( X ) e ( Y )] + o (1 /k ) = E [1 { X ∈ S 0 } γ 1 ( X ) γ 2 ( X ) f 2 ( X )] 1 M + o 1 M . In the second to last step, o (1 / M ) is obtained for the second term by recognizing that P r ( { X , Y } ∈ Ψ c ) = O ( k / M ) and O ( k / M ) × o (1 /k ) = o (1 / M ). C Boundary correction for densit y estimates In the previous section, momen t results w ere established for the standard k -NN densit y estimate ˆ f k ( X ) for p oin ts X in an y deterministic set S 0 with resp ect to the samples X M = 70 { X N +1 , .., X N + M } satisfying the condition P r ( X / ∈ S 0 ) = o (1) and S 0 ⊂ S I , where X is an realization from density f . In this section, these momen t results are extended to b oundary corrected k -NN densit y estimate ˜ f k ( X ) for all X ∈ S as follows. Sp ecify the set S 0 to be S 0 = S I as defined in (2). Exclusiv ely using the set X N = { X 1 , .., X N } , a set of interior p oints I N ⊂ X N are determined suc h that I N ⊂ S 0 with high probabilit y 1 − O ( N C ( k )). Define the set of b oundary p oints B N = X N − I N . F or p oints X ∈ I N , the b oundary corrected k -NN densit y estimate ˜ f k ( X ) is defined to b e the standard k -NN estimate ˆ f k ( X ), and we inv ok e the momen t prop erties of the standard k -NN densit y estimate ˆ f k ( X ) deriv ed in the previous section. F or p oin ts X ∈ B N , the density estimate ˜ f k ( X ) is defined as ˆ f k ( Y n ) for p oints Y n ∈ I N , and w e inv oke the momen t prop erties of the standard k -NN densit y estimate ˆ f k ( X ) derived in the previous section. C.1 Bias in the k -NN density estimator near b oundary If a probability density function has b ounded supp ort, the k -NN balls centered at p oin ts close to the b oundary are often truncated at the boundary . Let α k ( X ) = R S k ( X ) ∩ S d Z R S k ( X ) d Z b e the fraction of the v olume of the k -NN ball inside the b oundary of the supp ort. Also define V k,M ( X ) to b e the k -NN ball v olume in a sample of size M . F or in terior p oints X ∈ S 0 , α k ( X ) = 1, while for b oundary p oints X ∈ S − S 0 , α k ( X ) is closer to 0 when the p oin ts are closer to the b oundary . F or b oundary p oin ts we then ha ve E [ ˆ f k ( X )] − f ( X ) = (1 − α k ( X )) f ( X ) + o (1) . (120) Therefore the bias is muc h higher at the b oundary of the supp ort ( O (1)) as compared to its in terior ( O (( k / M ) 2 /d )) (81). F urthermore, the bias at the supp ort b oundary do es not decay to 0 as k / M → 0. In the next section, w e detect in terior p oints I N whic h lie in S 0 with high probabilit y O ( N C ( k )). The results on bias, v ariance and cross-moments deriv ed in the previous App endix for p oin ts X ∈ S 0 therefore carry ov er to the p oin ts I N . A density estimate at p oints B N is then prop osed that will reduce the bias of density estimates close to the b oundary . C.2 Boundary p oin t detection Define V k,M ( X ) := k M α k ( X ) f ( X ) . Let p ( k , M ) b e any p ositive function satisfying p ( k , M ) = Θ(( k / M ) 2 /d ) + ( √ 6 /k δ / 2 ). F rom the concen tration inequalit y (58) and T aylor series expansion of the cov erage function (70), for small v alues of k / M , w e hav e 1 − P r V k,M ( X ) V k,M ( X ) − 1 ≤ p ( k , M ) = O ( C ( k )) . 71 T o determine I N and B N , we first construct a K -NN graph on the samples X N where K = b k × ( N / M ) c . F or any X ∈ X N , from the concentration inequality (58) 1 − P r V K,N ( X ) V K,N ( X ) − 1 ≤ p ( K, N ) = O ( C ( K )) = O ( C ( k )) , (121) where C ( K ) = O ( C ( k )) because b y ( A . 0), K = θ ( k ). This implies that, with high probability , the radius of the K -NN ball at X concentrates around ( V K,N ( X ) /c d ) 1 /d . By this concen tration inequalit y (121), this c hoice of K guaran tees that the size of the k -NN ball in the partitioned sample is the same as the the size of the K -NN ball in the p o oled sample with high probability 1 − C ( k ). By the union b ound and (121), the probabilit y that V K,N ( X ) V K,N ( X ) − 1 ≤ p ( K, N ) is satisfied by every X i ∈ X N is lo w er b ounded b y 1 − O ( N C ( k )). Using the K -NN graph, for eac h sample X ∈ X N , we compute the num b er of p oints in X N that hav e X as a l -th nearest neigh b or ( l -NN), l = { 1 , . . . , K } . Denote this count as count ( X ). Let Y b e the l -nearest neigh b or of X , l = { 1 , . . . , K } . Then Y can b e represented as Y = X + R K ( X ) u where u is an arbitrary vector with || u || ≤ 1. F or X to b e one of the K -NN of Y it is necessary that R K ( Y ) ≥ || Y − X || or equiv alen tly , R K ( Y ) /R K ( X ) ≥ || u || . Using the concentration inequalit y (121) for R K ( X ) and R K ( Y ), a sufficien t condition for this is α K ( X ) f ( X ) α K ( Y ) f ( Y ) (1 − 2 p ( K , N )) ≥ || u || . (122) Because f is differen tiable and has a finite supp ort, f is Lipschitz contin uous. Denote the Lipsc hitz constant b y L . Then, we ha v e | f ( Y ) − f ( X ) | ≤ L ( K/c d N 0 ) 1 /d . Define q ( K , N ) = ( L / 0 )( K/c d N 0 ) 1 /d + 2 √ 6 /k δ / 2 . Then (122) is satisfied if α K ( X ) α K ( Y ) (1 − q ( K, N )) ≥ || u || . F or p oints X ∈ S 0 , α K ( X ) = 1 with probabilit y 1 − C ( k ). This implies that X will b e one of the K -NN of Y if || u || ≤ 1 − q ( K, N ). This implies that, with probabilit y 1 − O ( N C ( k )), count ( X ) ≥ K (1 − q ( K , N )) whenever X ∈ S 0 . On the other hand, for X ∈ S − S 0 , α K ( X ) < 1 with probability 1 − C ( k ). It is also clear that for small v alues of K / N , α K ( X ) < α K ( Y ) for at least K/ 2 l -NN Y of X . This then implies that count ( X ) < K (1 − q ( K, N )) for X ∈ S − S 0 with probabilit y 1 − O ( N C ( k )). W e therefore can apply the threshold K (1 − q ( K, N )) to detect in terior p oints I N = X N ∩ S 0 and b oundary p oints B N = X N − I N = X N ∩ ( S − S 0 ) with high probabilit y 1 − O ( N C ( k )). Algorithm 1, shown b elow, co difies this into a precise pro cedure. 72 Algorithm 1 Detect b oundary p oints B N 1. Construct K -NN tree on X N 2. Compute count ( X ) for eac h X ∈ X N 3. Detect b oundary p oin ts B N : for each X ∈ X N do if count ( X ) < (1 − q ( K , N )) K then B N ← X else I N ← X end if end for C.3 Boundary corrected densit y estimator Here the b oundary corrected k -NN density estimator is defined and its asymptotic rates are computed. The prop osed density estimator corrects the k -NN ball volumes for p oints that are close to the b oundary . T o estimate the density at a b oundary p oint X ∈ B N , w e find a p oin t Y ∈ I N that is close to X . Because of the proximit y of X and Y , f ( X ) ≈ f ( Y ). W e can then estimate the densit y at Y instead and use this as an estimate of f ( Y ). This informal argumen t is made more precise in what follows. Consider the corrected density estimator ˜ f k defined in (3). This estimator has bias of order O (( k / M ) 1 /d ), which can b e shown as follows. Let X denote X i for some fixed i ∈ { 1 , .., N } . Also, let X − 1 = arg min x ∈ S 0 d ( x, X ). Giv en X N , if X ∈ I N , then by (81), E [ ˜ f k ( X )] = E [ ˆ f k ( X )] = f ( X ) + O (( k / M ) 2 /d ) + O ( C ( k )) . Next consider the alternative case X ∈ B N . Let X n ∈ I N b e the closest in terior p oint to X . Define h = X − X n . h can b e rewritten as h = h 1 + h 2 , where h 1 = X − X − 1 and h 2 = X − 1 − X n . Since X ∈ B N implies that X ∈ S − S 0 with probabilit y 1 − O ( N C ( k )), consequen tly || h 1 || = || X − X − 1 || = O (( k / M ) 1 /d ) with probability 1 − O ( N C ( k )). Again with probability 1 − O ( N C ( k )), X n ∈ S 0 . Let C N = ∪ Y ∈ S 0 argmin x ∈ I N d ( x, Y ). By construction of C N , X n ∈ C N . Consequently , by (121), || h 2 || = || X − 1 − X n || = O ((1 / N ) 1 /d ) = o (( k / M ) 1 /d ). Because || h 1 || = || X − X − 1 || = O (( k / M ) 1 /d ) and || h 2 || = || X − 1 − X n || = o (( k / M ) 1 /d ) with probabilit y 1 − O ( N C ( k )), consequen tly with probability 1 − O ( N C ( k )), || h || = O (( k / M ) 1 /d ). No w, f ( X ) = f ( X n ) + O ( || h || ) . If X n is lo cated in the in terior S 0 , b y (81), E [ ˆ f k ( X n )] = f ( X n ) + O (( k / M ) 2 /d ) + O ( C ( k )) , (123) 73 and therefore E [ ˜ f k ( X )] = E [ ˆ f k ( X n )] + O ( N C ( k )) = f ( X n ) + O (( k / M ) 2 /d ) + O ( N C ( k )) = f ( X ) + O ( || h || ) + O (( k / M ) 2 /d ) + O ( N C ( k )) = f ( X ) + O (( k / M ) 1 /d ) + O ( N C ( k )) , (124) where the O ( N C ( k )) accoun ts for error in the case of the ev en t that X n ( i ) / ∈ S 0 . This implies that the corrected density estimate has lo w er bias as compared to the standard k -NN densit y estimate (compare to (81) and (120)). In particular, b oundary comp ensation has reduced the bias of the estimator at p oints near the b oundary from O (1) to O (( k / M ) 1 /d ) + O ( N C ( k )). C.4 Prop erties of b oundary corrected densit y estimator By section C.2, I N ∈ S 0 with probability 1 − N C ( k ). The results on bias, v ariance and cross- momen ts of the standard k -NN density estimator ˆ f k deriv ed in the previous App endix for p oin ts X ∈ S 0 therefore carry o ver to the corrected density estimator ˜ f k for p oin ts I N with error of order O ( N C ( k )). In the definition of the corrected estimator ˜ f k in (3), ˆ f k ( X n ( i ) ) is the standard k -NN densit y estimates and X n ( i ) ∈ S 0 . It therefore follows that the v ariance and other central and cross momen ts of the corrected density estimator ˜ f k will contin ue to decay at the same rate as the standard k -NN densit y estimator in the interior, as given by (116) and (117). Giv en these identical rates and that the probabilit y of a point b eing in the b oundary region S − S 0 is O (( k / M ) 1 /d ) = o (1), the contribution of the b oundary region to the o verall v ariance and other cross momen ts of the b oundary corrected density estimator ˜ f k are asymptotically negligible compared to the con tribution from the interior. As a result w e can now generalize the results from App endix A on the central momen ts and cross moments to include the b oundary regions as follo ws. Denote ˜ f k ( X ) − E X [ ˜ f k ( X ) | X ] by e ( X ). C.4.1 Cen tral and cross momen ts F or p ositiv e in tegers q , r < k E [ γ ( X ) e q ( X )] = 1 { q =2 } E γ ( X ) f 2 ( X ) 1 k + o 1 k + O ( N C ( k )) , (125) C ov [ γ 1 ( X ) e q ( X ) , γ 2 ( Y ) e r ( Y )] = 1 { q ,r =1 } C ov [1 { X ∈ S 0 } γ 1 ( X ) f ( X ) , 1 { Y ∈ S 0 } γ 2 ( Y ) f ( Y )] 1 M + o (1 / M ) + 1 { q + r> 2 } O 1 k (( q + r ) δ / 2 − 1) M + O ( k 2 /d M / M ) + O (1 / M 2 ) + O ( N C ( k )) . (126) Next, w e deriv e the following result on the bias of b oundary corrected estimators. 74 C.4.2 Bias F or k > 2, E [ γ ( E [ ˜ f k ( X ) | X ]) − γ ( f ( X )))] = E h E h ( γ ( ˜ f k ( X )) − γ ( f ( X ))) | X N ii = E h E h 1 { X ∈ I N } ( γ ( E [ ˜ f k ( X )]) − γ ( f ( X ))) | X N ii + E h E h 1 { X ∈ B N } ( γ ( E [ ˜ f k ( X )]) − γ ( f ( X ))) | X N ii = I + I I . (127) F rom (81), and P r ( X ∈ B N ) = O (( k / M ) 1 /d ), w e ha v e I = E [ γ 0 ( f ( X )) h ( X )] k M 2 /d + o k M 2 /d + O ( N C ( k )) . (128) Next, w e will now derive I I . I I = E h E h 1 { X ∈ B N } ( γ ( E [ ˜ f k ( X )]) − γ ( f ( X ))) | X N ii = E " E " 1 { X ∈ B N } ( γ ( f ( X n )) − γ ( f ( X ))) + O k M 2 /d | X N ## + O ( N C ( k )) , (129) where the last step follo ws by (123). Let us concentrate on the inner exp ectation no w. By section C.2, w e kno w that with probability 1 − O ( N C ( k )), if X ∈ B N , then X ∈ S − S 0 and if X n ∈ I N , then X n ∈ S 0 . F urthermore, || X − X − 1 || = O ( k / M ) 1 /d and || X − 1 − X n || = o ( k / M ) 1 /d with probabilit y 1 − O ( N C ( k )). This implies that E " 1 { X ∈ B N } ( γ ( f ( X n )) − γ ( f ( X ))) + O k M 2 /d | X N # = E 1 { X ∈ S − S 0 } ( γ ( f ( X − 1 )) − γ ( f ( X ))) | X N + o k M 1 /d + O ( N C ( k )) . Since P r ( X ∈ S − S 0 ) = O (( k / M ) 1 /d ), this in turn implies that I I = E h E h 1 { X ∈ B N } ( γ ( E [ ˜ f k ( X )]) − γ ( f ( X ))) | X N ii = E [1 { X ∈ S − S 0 } ( γ ( f ( X − 1 )) − γ ( f ( X )))] + o k M 2 /d + O ( N C ( k )) . (130) W e therefore finally get, E [ γ ( E [ ˜ f k ( X ) | X ]) − γ ( f ( X )))] = I + I I = E [ γ 0 ( f ( X )) h ( X )] k M 2 /d + E [1 { X ∈ S − S 0 } ( γ ( f ( X − 1 )) − γ ( f ( X )))] + o k M 2 /d + O ( N C ( k )) . (131) Note that || X − X − 1 || = O (( k / M ) 1 /d ) with probability 1 − O ( N C ( k )). This therefore implies that c 3 = E [1 { X ∈ S − S 0 } ( γ ( f ( X − 1 )) − γ ( f ( X )))] = O (( k / M ) 1 /d ) × O (( k / M ) 1 /d )+ O ( N C ( k )) = O (( k / M ) 2 /d )+ O ( N C ( k )) . 75 C.4.3 Optimalit y of b oundary correction Comparing (131), (125) and (126) with (81), (116) and (117) resp ectiv ely , oracle rates of con- v ergence of bias, and central and cross moments for the b oundary corrected densit y estimate are attained. The oracle rates are defined as the rates of MSE conv ergence attainable by the or acle densit y estimate that kno ws the b oundary of S ˜ f k,o = k − 1 M V k,o ( X ) , where V k,o ( X ) is the v olume of the region S k ( X ) ∩ S . It follo ws that the b oundary com- p ensated BPI estimator is adaptiv e in the sense that it’s asymptotic MSE rate of con vergence is iden tical to that of a k -NN plug-in estimator that kno ws the true b oundary . Equiv alent corrections exist for the uniform k ernel densit y estimator and will b e left to the reader. D Pro of of theorems on bias and v ariance Lemma D.1. Assume that U ( x, y ) is any arbitr ary functional which satisfies ( i ) sup x ∈ ( 0 , 1 ) | U ( x, y ) | = G 0 < ∞ , ( ii ) sup x ∈ ( q l ,q u ) | U ( x, y ) | C ( k ) = G 1 < ∞ , ( iii ) E [ sup x ∈ ( p l ,p u ) | U ( x/ p , y ) | ] = G 2 < ∞ . L et Z denote X i for some fixe d i ∈ { 1 , .., N } . L et ζ Z b e any r andom variable which almost sur ely lies in the r ange ( f ( Z ) , ˜ f k ( Z )) . Then, E [ | U ( ζ Z , Z ) | ] < ∞ . Pr o of. W e will show that the conditional exp ectation E [ | U ( ζ Z , Z ) | | X N ] < ∞ . Because 0 < 0 < f ( X ) < ∞ < ∞ by ( A . 1), it immediately follo ws that E [ | U ( ζ Z , Z ) | ] = E [ E [ | U ( ζ Z , Z ) | | X N ]] < ∞ . F or fixed X N , Z ∈ I N or Z ∈ B N . These tw o cases are handled sep erately . Case 1: Z ∈ I N In this case, ˜ f k ( Z ) = ˆ f k ( Z ). By (76) and ( A . 1), we know that if \ ( Z ) holds, p l / P ( Z ) < ˆ f k ( Z ) < p u / P ( Z ). On the other hand, if \ c ( Z ) holds, b y (78) and ( A . 1), 76 q l < ˆ f k ( Z ) < q u . This therefore implies that if \ ( Z ) holds, min { 0 , p l / P ( Z ) } < ζ Z < max { ∞ , p u / P ( Z ) } and if \ c ( Z ) holds, min { 0 , q l } < ζ Z < max { ∞ , q u } . Then, E [ | U ( ζ Z , Z ) | | X N ] = E [1 \ ( Z ) | U ( ζ Z , Z ) | | X N ] + E [1 \ c ( Z ) | U ( ζ Z , Z ) | | X N ] ≤ G 0 + E [1 \ ( Z ) sup x ∈ ( p l ,p u ) | U ( x/ P ( Z ) , Z ) | ] + max { G 0 , G 1 / C ( k ) } (1 − P r ( \ ( Z ))) ≤ G 0 + E [ sup x ∈ ( p l ,p u ) | U ( x/ P ( Z ) , Z ) | ] + max { G 0 , G 1 / C ( k ) } (1 − P r ( \ ( Z ))) = G 0 + G 2 + max { G 1 / C ( M ) , G 0 } C ( k ) = G 0 + G 2 + max { G 1 , G 0 C ( k ) } < ∞ (132) where the final step follo ws from the fact that C ( k ) = o (1). Case 2: Z ∈ B N If Z ∈ B N , let Y n b e the nearest neigh b or of Z in the set I N . Then, ˜ f k ( Z ) = ˆ f k ( Y n ) (133) This implies that w e can now condition on the even t \ ( Y n ), and follo w the exact pro cedure as in case 1 to obtain E [ | U ( ζ Z , Z ) | | X N ] = E [1 \ ( Y n ) | U ( ζ Z , Z ) | | X N ] + E [1 \ c ( Y n ) | U (1 /ζ Z , Z ) | | X N ] ≤ G 0 + G 2 + max { G 1 , G 0 C ( k ) } < ∞ (134) where the final step follo ws from the fact that C ( k ) = o (1). This concludes the pro of. Pro of of Theorem 3.1 . Pr o of. Using the contin uity of g 000 ( x, y ), construct the followin g third order T a ylor series of g ( ˜ f k ( Z ) , Z ) around the conditional exp ected v alue E Z [ ˜ f k ( Z )] = E [ ˜ f k ( Z ) | Z ]. g ( ˜ f k ( Z ) , Z ) = g ( E Z [ ˜ f k ( Z )] , Z ) + g 0 ( E Z [ ˜ f k ( Z )] , Z ) e ( Z ) + 1 2 g 00 ( E Z [ ˜ f k ( Z )] , Z ) e 2 ( Z ) + 1 6 g (3) ( ζ Z , Z ) e 3 ( Z ) , where ζ Z ∈ ( E Z [ ˜ f k ( Z )] , ˜ f k ( Z )) is defined by the mean v alue theorem. This gives E [( g ( ˜ f k ( Z ) , Z ) − g ( E Z [ ˜ f k ( Z )] , Z ))] = E 1 2 g 00 ( E Z [ ˜ f k ( Z )] , Z ) e 2 ( Z ) + E 1 6 g (3) ( ζ Z , Z ) e 3 ( Z ) Let ∆( Z ) = 1 6 g (3) ( ζ Z , Z ). Direct application of Lemma D.1 in conjunction with assumptions ( A . 5) , ( A . 6) implies that E [∆ 2 ( Z )] = O (1). By Cauch y-Sc hw arz and assumption ( A . 4) applied to (125) for the c hoice q = 6, E 1 6 ∆( Z ) e 3 ( Z ) ≤ s E 1 36 ∆ 2 ( Z ) E [ e 6 ( Z )] = o 1 k + O ( N C ( k )) . 77 By observing that the density estimates { ˜ f k ( X i ) } , i = 1 , . . . , N are identical, we therefore ha ve E [ ˆ G N ( ˜ f k )] − G ( f ) = E [ g ( ˜ f k ( Z ) , Z ) − g ( f ( Z ) , Z )] = E [ g ( E Z [ ˜ f k ( Z )] , Z ) − g ( f ( Z ) , Z )] + E 1 2 g 00 ( E Z [ ˜ f k ( Z )] , Z ) e 2 ( Z ) + o (1 /k ) + O ( N C ( k )) . By (131) and (125) for the choice q = 2, in conjunction with assumption ( A . 4),this implies that E [ ˆ G N ( ˜ f k )] − G ( f ) = E [ g 0 ( f ( Z ) , Z ) h ( Z )] k M 2 /d + E [1 { Z ∈ S − S I } ( g ( f ( Z − 1 ) , Z − 1 ) − g ( f ( Z ) , Z ))] + E [ f 2 ( Z ) g 00 ( E Z [ ˜ f k ( Z )] , Z ) / 2] 1 k + O ( N C ( k )) + o 1 k + k M 2 /d ! = E [ g 0 ( f ( Z ) , Z ) h ( Z )] k M 2 /d + E [1 { Z ∈ S − S I } ( g ( f ( Z − 1 ) , Z − 1 ) − g ( f ( Z ) , Z ))] + E [ f 2 ( Z ) g 00 ( f ( Z ) , Z ) / 2] 1 k + O ( N C ( k )) + o 1 k + k M 2 /d ! = c 1 k M 2 /d + c 2 1 k + c 3 + O ( N C ( k )) + o 1 k + k M 2 /d ! , where the last but one step follows b ecause, by (81) and (124), we know E Z [ ˜ f k ( Z )] = f ( Z ) + o (1). This in turn implies E [ f 2 ( Z ) g 00 ( E Z [ ˜ f k ( Z )] , Z ) / 2] = E [ f 2 ( Y ) g 00 ( f ( Y ) , Y ) / 2]. Finally , b y assumption ( A . 5) and ( A . 2), the leading constan ts c 1 and c 2 are b ounded. W e ha ve also sho wn in equation (130) that c 3 = O (( k / M ) 2 /d ). This concludes the pro of. Pro of of Theorem 5.1 Pr o of. Let X denote X i for some fixed i ∈ { 1 , .., N } . Also, let X − 1 = arg min x ∈ S I d ( x, X ). 78 Using (82), we can derive the follo wing in an iden tical manner to (131): B ( ˆ G N ,B C ( ˜ f k )) = E [ ˆ G N ,B C ( ˜ f k )] − Z g ( f ( x ) , x ) f ( x ) dx = ( E [ g ( ˜ f k ( Z ) , Z )] − g 2 ( k , M )) /g 1 ( k , M ) − Z g ( f ( x ) , x ) f ( x ) dx = E [ E [( g ( ˜ f k ( Z ) , X ) − g 2 ( k , M )) /g 1 ( k , M ) | X N ]] − Z g ( f ( x ) , x ) f ( x ) dx = E [ E [( g ( ˜ f k ( X ) , X ) − g 2 ( k , M )) /g 1 ( k , M ) | X N ] , X ∈ I N ] + E [ E [( g ( ˜ f k ( X ) , X ) − g 2 ( k , M )) /g 1 ( k , M ) | X N ] , X ∈ B N ] − Z g ( f ( x ) , x ) f ( x ) dx = E [ g ( f ( X ) , X ) + g 0 ( f ( X ) , X ) h ( X ) g 1 ( k , M ) ( k / M ) 2 /d + 1 { X ∈ S − S 0 } g 1 ( k , M ) ( g ( f ( X − 1 ) , X − 1 ) − g ( f ( X ) , X )) + o (( k / M ) 2 /d ) + O ( N C ( k ))] − Z g ( f ( x ) , x ) f ( x ) dx = c 1 g 1 ( k , M ) k M 2 /d + c 3 g 1 ( k , M ) + o k M 2 /d ! + O ( N C ( k )) . Because w e assume the logarithmic growth condition k = O ((log ( M )) 2 / (1 − δ ) ), it follo ws that O ( N C ( k )) = O ( N / M 3 ) = o (1 /T ). Also, b y (8), g 1 ( k , M ) = 1 + o (1). This implies that B ( ˆ G N ,B C ( ˜ f k )) = c 1 k M 2 /d + c 3 + o k M 2 /d ! . (135) Pro of of Theorem 3.2 and Theorem 5.2 . Pr o of. By the contin uit y of g ( λ ) ( x, y ), w e can construct the follo wing T a ylor series of g ( ˜ f k ( Z ) , Z ) around the conditional exp ected v alue E Z [ ˜ f k ( Z )]. g ( ˜ f k ( Z ) , Z ) = g ( E Z [ ˜ f k ( Z )] , Z ) + g 0 ( E Z [ ˜ f k ( Z )] , Z ) e ( Z ) + λ − 1 X i =2 g ( i ) ( E Z [ ˜ f k ( Z )] , Z ) i ! e i ( Z ) ! + g ( λ ) ( ξ Z , Z ) λ ! e λ ( Z ) , where ξ Z ∈ ( g ( E Z [ ˜ f k ( Z )] , g ( ˜ f k ( Z ))). Denote ( g λ ( ξ Z , Z )) /λ ! by Ψ( Z ). F urther define the 79 op erator M ( Z ) = Z − E [ Z ] and p i = M ( g ( E X i [ ˜ f k ( X i )] , X i )) , q i = M ( g 0 ( E X i [ ˜ f k ( X i )] , X i ) e ( X i )) , r i = M λ X i =2 g ( i ) ( E X i [ ˜ f k ( X i )] , X i ) i ! e i ( X i ) ! s i = M Ψ( X i ) e λ ( X i ) The v ariance of the estimator ˆ G N ( ˜ f k ) is given by V [ ˆ G N ( ˜ f k )] = E [( ˆ G ( f ) − E [ ˆ G ( f )]) 2 ] = 1 N E ( p 1 + q 1 + r 1 + s 1 ) 2 + N − 1 N E [( p 1 + q 1 + r 1 + s 1 )( p 2 + q 2 + r 2 + s 2 )] . Because X 1 , X 2 are indep endent, we hav e E [( p 1 )( p 2 + q 2 + r 2 + s 2 )] = 0. F urthermore, E ( p 1 + q 1 + r 1 + s 1 ) 2 = E [ p 1 2 ] + o (1) = V [ g ( E Z [ ˆ f ( Z )] , Z )] + o (1) . F rom assumption ( A . 4) applied to (125) and (126), in conjunction with assumption ( A . 3), it follo ws that • E [ p 1 2 ] = V [ g ( E Z [ ˜ f k ( Z )] , Z )] • E [ q 1 q 2 ] = V [ g 0 ( E Z [ ˜ f k ( Z )] , Z ) f ( Z )] 1 M + o 1 M + O ( N C ( k )) • E [ q 1 r 2 ] = P λ − 1 i =2 O 1 k ((1+ i ) δ/ 2 − 1) M + O λ ( k 2 /d M +1 / M ) M + O ( N C ( k )) = o 1 M + O ( N C ( k )) • E [ r 1 r 2 ] = P λ − 1 i 1 =2 P λ − 1 i 2 =2 O 1 k (( i 1 + i 2 ) δ/ 2 − 1) M + O λ 2 ( k 2 /d M +1 / M ) M + O ( N C ( k )) = o 1 M + O ( N C ( k )) Since q 1 and s 2 are 0 mean random v ariables E [ q 1 s 2 ] = E h q 1 Ψ( X 2 )( ˆ f ( X 2 ) − E X 2 [ ˜ f k ( X 2 )]) λ i = E h q 1 Ψ( X 2 )( ˆ f ( X 2 ) − E X 2 [ ˜ f k ( X 2 )]) λ i ≤ r E [Ψ 2 ( X 2 )] E h q 2 1 ( ˆ f ( X 2 ) − E X 2 [ ˜ f k ( X 2 )]) 2 λ i = p E [Ψ 2 ( Z )] o 1 k λ + O ( N C ( k )) 80 Direct application of Lemma D.1 in conjunction with assumptions ( A . 5), ( A . 6) implies that E [Ψ 2 ( Z )] = O (1). Note that from assumption ( A . 3), o 1 k λ = o (1 / M ) . In a similar manner, it can b e sho wn that E [ r 1 s 2 ] = o 1 M + O ( N C ( k )) and E [ s 1 s 2 ] = o 1 M + O ( N C ( k )). Finally , b y (81) and (124), we know E Z [ ˜ f k ( Z )] = E [ ˜ f k ( Z )] = f ( Z ) + o (1). This implies that V [ ˆ G N ( ˜ f k )] = 1 N E p 1 2 + ( N − 1) N E [ q 1 q 2 ] + O ( N C ( k )) + o 1 M + 1 N = V [ g ( E Z [ ˜ f k ( Z )] , Z )] 1 N + V [ g 0 ( E Z [ ˜ f k ( Z )] , Z ) f ( Z )] 1 M + O ( N C ( k )) + o 1 M + 1 N = V [ g ( f ( Z ) , Z )] 1 N + V [ g 0 ( f ( Z ) , Z ) f ( Z )] 1 M + O ( N C ( k )) + o 1 M + 1 N = c 4 1 N + c 5 1 M + O ( N C ( k )) + o 1 M + 1 N , where the last but one step follows b ecause, by (81) and (124), we know E Z [ ˜ f k ( Z )] = f ( Z ) + o (1). This in turn implies V [ g ( E Z [ ˜ f k ( Z )] , Z )] = V [ g ( f ( Z ) , Z )] and V [ g 0 ( E Z [ ˜ f k ( Z )] , Z ) f ( Z )] = V [ g 0 ( f ( Z ) , Z ) f ( Z )]. Finally , by assumptions ( A . 5) and ( A . 2), the leading constants c 4 and c 5 are b ounded. This concludes the pro of of Theorem 3.2. Under the logarithmic growth condition k = O ((log ( M )) 2 / (1 − δ ) ), g 2 ( k , M ) = o (1) and g 1 ( k , M ) = 1 + o (1) by assumption (8). Theorem 5.2 follows b y observing that ˆ G N ,B C ( ˜ f k ) = ( ˆ G N ( ˜ f k ) − g 1 ( k , M )) /g 2 ( k , M ) Bias of Baryshnik ov’s estimator: Pro of of equation (5) Pr o of. W e will first prov e that B ( ˜ G N ( ˆ f k )) = Θ(( k / M ) 1 /d + 1 /k ) , (136) Because the standard k -NN density estimate ˆ f kS ( X i ) is identical to the partitioned k -NN densit y estimate ˆ f k ( X i ) defined on the partition { X i } and { X 1 , .., X T } − { X i } , it follows that B ( ˜ G N ( ˆ f kS )) = Θ(( k /T ) 1 /d + 1 /k ) . (137) F rom the definition of set S 0 in section B.2.1, w e can c ho ose the set S 0 , such that P r ( Z / ∈ S 0 ) = O (( k / M ) 1 /d ). E [ ˆ G N ( ˆ f k )] − G ( f ) = E [ g ( ˆ f k ( Z ) , Z ) − g ( f ( Z ) , Z )] = E [1 { Z ∈ S 0 } g ( ˆ f k ( Z ) , Z ) − g ( f ( Z ) , Z )] + E [1 { Z ∈ S − S 0 } g ( ˆ f k ( Z ) , Z ) − g ( f ( Z ) , Z )] = I + I I (138) Using the exact same metho d as in the Pro of of Theorem 3.1, using (81) and (116), and the fact that P r ( Z / ∈ S 0 ) = O (( k / M ) 1 /d ) = o (1), we hav e I = E [ g 0 ( f ( Z ) , Z ) h ( Z )] k M 2 /d + E [ f 2 ( Z ) g 00 ( f ( Z ) , Z ) / 2] 1 k + O ( C ( k )) + o 1 k + k M 2 /d ! , 81 Because w e assume that g satisfies assumption ( A . 6), from the pro of of Lemma D.1, for Z ∈ S − S 0 , w e ha v e E [ g ( ˆ f k ( Z ) , Z ) − g ( f ( Z ) , Z )] = O (1). This implies that, I I = E [1 { Z ∈ S − S 0 } g ( ˆ f k ( Z ) , Z ) − g ( f ( Z ) , Z )] = E h E [ g ( ˆ f k ( Z ) , Z ) − g ( f ( Z ) , Z )] | 1 { Z ∈ S − S 0 } i × P r ( Z / ∈ S 0 ) = O (1) × O (( k / M ) 1 /d ) = O (( k / M ) 1 /d ) . (139) This concludes the pro of. E Asymptotic normalit y Define the random v ariables { Y M ,i ; i = 1 , . . . , N } for any fixed M Y M ,i = g ( ˜ f k ( X i ) , X i ) − E [ g ( ˜ f k ( X i ) , X i )] q V [ g ( ˜ f k ( X i ) , X i )] , and define the sum S N , M S N ,M = 1 √ N N X i =1 Y M ,i , where the indices N and M explicitly stress the dep endence of the sum S N ,M on the n umber of random v ariables N + M . Observ e that the random v ariables { Y M ,i ; i = 1 , . . . , N } b elong to an 0 mean, unit v ariance, interc hangeable pro cess [5] for all v alues of M . T o establish the CL T for S N ,M , w e will exploit the fact the random v ariables { Y M ,i ; i = 1 , . . . , N } are in terchangeable by app ealing to DeFinetti’s theorem, which we describ e b elo w. E.1 De Finetti’s Theorem Let F b e the class of one dimensional distribution functions and for each pair of real n umbers x and y define F ( x, y ) = { F ∈ F | F ( x ) ≤ y } . Let B b e the Borel field of subsets of F generated b y the class of sets F ( x, y ). Then De Finetti’s theorem asserts that for an y in terc hangeable pro cess { Z i } there exists a probabilit y measure µ defined on B suc h that P r { B } = Z F P r F { B } dµ ( F ) , (140) for any Borel measurable set defined on the sample space of the sequence { Z i } . Here P r { B } is the probabilit y of the even t B and P r F { B } is the probability of the ev ent B under the assumption that comp onent random v ariables X i of the interc hangeable pro cess are inde- p enden t and identically distributed with distribution F . 82 E.2 Necessary and Sufficien t conditions for CL T F or each F ∈ F define m ( F ) and σ 2 ( F ) as m ( F ) = R ∞ −∞ xdF ( x ), σ ( F ) = R ∞ −∞ x 2 dF ( x ) − 1 and for all real n um b ers m and non-negativ e real num b ers σ 2 let F m,σ 2 b e the set of F ∈ F for whic h m ( F ) = m and σ 2 ( F ) = σ 2 . Let { Z i ; i = 1 , 2 , . . . } b e an interc hangeable sto chastic pro cess with 0 mean and v ariance 1. Blum etal [5] show ed that the random v ariable S N = 1 √ N P N i =1 Z i con verges in distribution to N (0 , 1) if and only if µ ( F 0 , 0 ) = 1. F urthermore, they show that the condition µ ( F 0 , 0 ) = 1 is equiv alen t to the condition that C ov ( Z 1 , Z 2 ) = 0 and C ov ( Z 2 1 , Z 2 2 ) = 0. W e will e xtend Blum etal ’s results to in terchangeable pro cesses where C ov ( Z 1 , Z 2 ) = o (1) and C ov ( Z 2 1 , Z 2 2 ) = o (1). In particular, we will show that C ov ( Y M , 1 , Y M , 2 ) and C ov ( Y 2 M , 1 , Y 2 M , 2 ) are O (1 / M ). Sub- sequen tly we will sho w that the random v ariable S N ,M = 1 √ N P N i =1 Y M ,i con verges in distri- bution to N (0 , 1) and conclude that Theorem 3.3 holds. E.3 CL T for Asymptotically Uncorrelated pro cesses Let X b e a random v ariable with density f . In the pro of of Theorem 3.2, we show ed that C ov ( Y M ,i , Y M ,j ) = C ov ( g ( ˜ f k ( X i ) , X i ) , g ( ˜ f k ( X j ) , X j )) q V [ g ( ˜ f k ( X i ) , X i )] V [ g ( ˜ f k ( X j ) , X j )] = C ov ( p i + q i + r i + s i , p j + q j + r j + s j ) q V [ g ( ˜ f k ( X i ) , X i )] V [ g ( ˜ f k ( X j ) , X j )] = C ov ( p i + q i + r i + s i , p j + q j + r j + s j ) q V [ g ( ˜ f k ( X i ) , X i )] V [ g ( ˜ f k ( X j ) , X j )] = V ( g 0 ( f ( X ) , X ) f ( X )) V [ g ( f ( X i ) , X i )] 1 M + o 1 M + O ( N C ( k )) = V ( g 0 ( f ( X ) , X ) f ( X )) V [ g ( f ( X i ) , X i )] 1 M + o 1 M , (141) where the last but one step follows by observing that N C ( k ) / M → 0 under the logarithmic gro wth condition k = O ((log( M )) 2 / (1 − δ ) ). Define the function d ( x, y ) = g ( x, y )( g ( x, y ) − c ), where the constant c = E [ g ( ˜ f k ( X ) , X )]. Then, similar to the deriv ation of (141), we hav e, C ov ( Y 2 M ,i , Y 2 M ,j ) = C ov ( d ( ˜ f k ( X i ) , X i ) , d ( ˜ f k ( X j ) , X j )) q V [ d ( ˜ f k ( X i ) , X i )] V [ d ( ˜ f k ( X j ) , X j )] = V ( d 0 ( f ( X ) , X ) f ( X )) V [ d ( f ( X i ) , X i )] 1 M + o 1 M . (142) 83 Pro of of Theorem 3.3 and Theorem 5.3 . Pr o of. Let δ µ ( M ) and δ σ ( M ) b e a strictly p ositive functions parameterized by M suc h that δ µ ( M ) = o (1); 1 M δ µ ( M ) = o (1), δ σ ( M ) = o (1); 1 M δ σ ( M ) = o (1). Denote the set of F ∈ F with F m,δ,M := { m 2 ( F ) ≥ δ µ ( M ) } ; F σ,δ ,M := { σ 2 ( F ) ≥ δ σ ( M ) } ; F ∗ m,δ,M := { m 2 ( F ) ∈ (0 , δ µ ( M )) } and F ∗ σ,δ ,M := { σ 2 ( F ) ∈ (0 , δ σ ( M )) } . Denote the measures of these sets b y µ m,δ,M , µ σ,δ ,M , µ ∗ m,δ,M and µ ∗ σ,δ ,M resp ectiv ely . W e ha ve from (140) that Z F m 2 ( F ) dµ ( F ) = C ov ( Y M ,i , Y M ,j ) Z F σ 2 ( F ) dµ ( F ) = Z F [ E F [ Z 2 − 1]] 2 dµ ( F ) = C ov ( Y 2 M ,i , Y 2 M ,j ) . (143) Applying the Chebyshev inequality , we get δ µ ( M ) µ m,δ,M ≤ C ov ( Y M ,i , Y M ,j ) , δ σ ( M ) µ σ,δ ,M ≤ C ov ( Y 2 M ,i , Y 2 M ,j ) . Because the co v ariances decay at O (1 / M ), µ m,δ,M and µ σ,δ ,M → 0 as M → ∞ . F rom the definition of F ∗ m,δ,M and F ∗ σ,δ ,M , w e also hav e that µ ∗ m,δ,M and µ ∗ σ,δ ,M → 0 as M → ∞ . W e also ha v e 1 − ( µ m,δ,M + µ σ,δ ,M + µ ∗ m,δ,M + µ ∗ σ,δ ,M ) ≤ µ ( F 0 , 0 ) ≤ 1 , and therefore lim M →∞ µ ( F 0 , 0 ) = 1 . (144) W e will now show that ˜ G N ( ˜ f k ) = ( ˆ G N ( ˜ f k ) − E [ ˆ G N ( ˜ f k )]) / ( q V [ ˆ G N ( ˜ f k )]) con v erges w eakly to 84 N (0 , 1). Denote g ( ˜ f k ( X i ) , X i ) b y g i . Observe that lim ∆ → 0 P r { ˜ G N ( ˜ f k ) ≤ α } = lim ∆ → 0 Z F P r F { ˜ G N ( ˜ f k ) ≤ α } dµ ( F ) = lim ∆ → 0 Z F 0 , 0 P r F { ˜ G N ( ˜ f k ) ≤ α } dµ ( F ) + lim ∆ → 0 Z F 1 { F ∈ F − F 0 , 0 } P r F { ˜ G N ( ˜ f k ) ≤ α } dµ ( F ) = lim ∆ → 0 Z F 0 , 0 P r F { ˜ G N ( ˜ f k ) ≤ α } dµ ( F ) + Z F lim ∆ → 0 1 { F ∈ F − F 0 , 0 } P r F { ˜ G N ( ˜ f k ) ≤ α } dµ ( F ) (145) = lim ∆ → 0 Z F 0 , 0 P r F { ˜ G N ( ˜ f k ) ≤ α } dµ ( F ) (146) = lim ∆ → 0 Z F 0 , 0 P r F 1 N N X i =1 g ( ˜ f k ( X i ) , X i ) − E [ g ( ˜ f k ( X i ) , X i )] q V [ ˆ G N ( ˜ f k )] ≤ α dµ ( F ) = lim ∆ → 0 Z F 0 , 0 P r F ( 1 N N X i =1 g ( ˜ f k ( X i ) , X i ) − E [ g ( ˜ f k ( X i ) , X i )] p V [ g i ] / N + (( N − 1) / N ) C ov [ g i , g j ] ! ≤ α ) Z F 0 , 0 dµ ( F ) = lim ∆ → 0 Z F 0 , 0 P r F 1 N N X i =1 g ( ˜ f k ( X i ) , X i ) − E [ g ( ˜ f k ( X i ) , X i )] q V [ g i ] / N + (( N − 1) / N ) p V [ g i ] V [ g j ] C ov [ Y M ,i , Y M ,j ] ≤ α dµ ( F ) = lim ∆ → 0 Z F 0 , 0 P r F ( 1 N N X i =1 g ( ˜ f k ( X i ) , X i ) − E [ g ( ˜ f k ( X i ) , X i )] p V [ g i ] / N ! ≤ α ) dµ ( F ) (147) = lim ∆ → 0 Z F 0 , 0 P r F ( 1 √ N N X i =1 Y M ,i ≤ α ) dµ ( F ) = Z F lim ∆ → 0 1 { F ∈ F 0 , 0 } P r F ( 1 √ N N X i =1 Y M ,i ≤ α )! dµ ( F ) = Z F φ ( α ) dµ ( F ) = φ ( α ) , (148) where φ ( . ) is the distribution function of a Gaussian random v ariable with mean 0 and v ari- ance 1. Step (D.6) follows from the Dominated Conv ergence theorem. By (144), lim ∆ → 0 1 { F ∈ F − F 0 , 0 } = 0 almost surely . This giv es Step (D.7). Step (D.8) is obtained by observing that, by (143), C ov [ Y M ,i , Y M ,j ] = 0 when F ∈ F 0 , 0 . The last step (D.9) follo ws from the CL T for sums of 0 mean, unit v ariance, i.i.d random v ariables and (144). This concludes the pro of of Theorem 3.3. T o sho w Theorem 5.3, observe that under the logarithmic gro wth condition k = O ((log ( M )) 2 / (1 − δ ) ), g 2 ( k , M ) = o (1) and g 1 ( k , M ) = 1 + o (1) by assumption (8). Since ˆ G N ,B C ( ˜ f k ) = ( ˆ G N ( ˜ f k ) − g 1 ( k , M )) /g 2 ( k , M ), it follo ws that the asymptotic distribution of ˆ G N ,B C ( ˜ f k ) − E [ ˆ G N ,B C ( ˜ f k )] q V [ ˆ G N ,B C ( ˜ f k )] 85 is equal to the asymptotic distribution of ˜ G N ( ˜ f k ) = ( ˆ G N ( ˜ f k ) − E [ ˆ G N ( ˜ f k )]) / ( q V [ ˆ G N ( ˜ f k )]). E.4 Berry-Esseen b ounds W e now establish Berry-Esseen bounds for the case where N M → 0. In particular, we assume that there exists a δ : 0 < δ < 1, such that N = O ( M δ ). W e also assume that the in terchangeable pro cess has finite absolute third order momen t E ( | Z M ,i | 3 ) = ρ M < ∞ ∨ M . E.4.1 Details Define the subset ˜ z of z as follo ws: ˜ z = z − { z m,δ,M S z σ,δ ,M } . W e recognize that for F ∈ ˜ z , w e ha v e − q δ µ ( M ) ≤ m ( F ) ≤ q δ µ ( M ) , − p δ σ ( M ) ≤ σ ( F ) ≤ p δ σ ( M ) . The mean and v ariance of Y M ,i under the distribution F are given b y m ( F ) and σ ( F ) + ρ − m 2 ( F ) resp ectiv ely . As in the previous section, let φ b e the distribution function of a Gaussian random v ariable with 0 mean and ρ v ariance. Lo wer b ound P r { S N ,M ≤ α } = Z z P r F { S N ,M ≤ α } dµ ( F ) ≥ Z ˜ z P r F { S N ,M ≤ α } dµ ( F ) ≥ Z ˜ z " φ α − √ N m ( F ) 1 + ( σ ( F ) − m 2 ( F )) /ρ ! − C κ ( F ) ( σ ( F ) + ρ − m 2 ( F )) 3 √ N # dµ ( F ) ≥ φ α − p N δ µ ( M ) 1 + ( p δ σ ( M )) /ρ ! µ ( ˜ z ) − Z ˜ z C κ ( F ) ( ρ − p δ σ ( M ) − δ µ ( M )) 3 √ N dµ ( F ) ≥ φ α − p N δ µ ( M ) 1 + ( p δ σ ( M )) /ρ ! µ ( ˜ z ) − C κ ( ρ − p δ σ ( M ) − δ µ ( M )) 3 √ N . 86 Upp er b ound Denote µ ( ˜ z c ) := ˜ µ . W e note that ˜ µ ≤ µ m,δ,M + µ σ,δ ,M . P r { S N ,M ≤ α } = Z z P r F { S N ,M ≤ α } dµ ( F ) ≤ Z ˜ z P r F { S N ,M ≤ α } dµ ( F ) + ˜ µ ≤ Z ˜ z " φ α − √ N m ( F ) 1 + ( σ ( F ) − m 2 ( F )) /ρ ! + C κ ( F ) ( σ ( F ) + ρ − m 2 ( F )) 3 √ N # dµ ( F ) + ˜ µ ≤ φ α + p N δ µ ( M ) 1 − ( p δ σ ( M ) + δ µ ( M )) /ρ ! µ ( ˜ z ) + Z ˜ z C κ ( F ) ( ρ + p δ σ ( M )) 3 √ N dµ ( F ) + ˜ µ ≤ φ α − p N δ µ ( M ) 1 − ( p δ σ ( M ) + δ µ ( M )) /ρ ! µ ( ˜ z ) + C κ ( ρ + p δ σ ( M )) 3 √ N + µ m,δ,M + µ σ,δ ,M ≤ φ α − p N δ µ ( M ) 1 − ( p δ σ ( M ) + δ µ ( M )) /ρ ! µ ( ˜ z ) + C κ ( ρ + p δ σ ( M )) 3 √ N + 1 M δ µ ( M ) + 1 M δ σ ( M ) . W e ha ve sho wn that the appropriately normalized sum S N ,M con verges in distribution to a normal random v ariable. Also for the case where N grows slo wer than M , w e hav e established Berry-Esseen t yp e b ounds on the error. F Uniform k ernel based plug-in estimator In this section, w e will state the main results concerning uniform k ernel plug-in estimators. The pro ofs for these results rely on the prop erties of the uniform k ernel density estimates established in App endix A and pro ofs for equiv alen t results for the k -NN plug-in estimators. Let ˆ f u denote the b oundary corrected uniform kernel density estimate. Denote the uniform k ernel plug-in estimator by ˆ G u ( f ) = 1 N N X i =1 g ( ˆ f u ( X i ) , X i ) ! . (149) Let Y denote a random v ariable with densit y function f . 87 F.1 Results Corollary F.1. Supp ose that the density f , the functional g and the density estimate ˆ f u satisfy the ne c essary c onditions liste d ab ove. The bias of the plug-in estimator ˆ G u ( f ) is then given by B u ( f ) = c 1 k M 2 /d + c 2 1 k + o 1 k + k M 2 /d ! , wher e c 1 = E [ g 0 ( f ( Y ) , Y ) c ( Y )] , c 2 = E [ g 00 ( f ( Y ) , Y ) f ( Y ) / 2] ar e c onstants which dep end on the underlying density f . Corollary F.2. Supp ose that the density f , the functional g and the density estimate ˆ f u satisfy the ne c essary c onditions liste d ab ove. The varianc e of the plug-in estimator ˆ G u ( f ) is given by V u ( f ) = c 4 1 N + c 5 1 M + o 1 M + 1 N , wher e c 4 = V [ g ( f ( Y ) , Y )] and c 5 = V [ f ( Y ) g 0 ( f ( Y ) , Y )] ar e c onstants which dep end on the underlying density f . Corollary F.3. Supp ose that the density f , the functional g and the density estimate ˆ f u sat- isfy the ne c essary c onditions liste d ab ove. F urther supp ose E [ | g ( f ) | 3 ] is finite. The asymptotic distribution of the plug-in estimator ˆ G u ( f ) is given by lim ∆( k,N ,M ) → 0 P r ˆ G u ( f ) − E [ ˆ G u ( f )] p V [ f ( Y ) g 0 ( f ( Y ) , Y )] / N ≤ α ! = P r ( Z ≤ α ) , wher e Z is a standar d normal r andom variable. References [1] I. Ahmad and Pi-Erh Lin. A nonparametric estimation of the en tropy for absolutely con- tin uous distributions (corresp.). Information The ory, IEEE T r ansactions on , 22(3):372 – 375, may 1976. [2] Y u. Baryshnik ov, M. D. Penrose, and J.E. Y ukic h. Gaussian limits for generalized spacings. Ann. Appl. Pr ob ab. , 19(1):158–185, 2009. [3] P . J. Bick el and Y. Rito v. Estimating in tegrated squared density deriv ativ es: Sharp b est order of conv ergence estimates. Sankhya: The Indian Journal of Statistics , 50:381–393, Octob er 1988. 88 [4] L. Birge and P . Massart. Estimation of integral functions of a densit y . The A nnals of Statistics , 23(1):11–29, 1995. [5] J.R. Blum, H. Chernoff, M. Rosen blatt, and H. T eic her. Cen tral limit theorems for in terchangeable pro cesses. Canadian Journal of Mathematics , June 1957. [6] Y. Chen, A. Wiesel, and A. O. Hero. Robust shrink age estimation of high-dimensional co v ariance matrices. submitted to IEEE T rans. on Signal Pro cess., preprin t a v ailable in [7] R. C. H. Cheng and N. A. K. Amin. Estimating parameters in contin uous univ ariate distributions with a shifted origin. Journal of the R oyal Statistic al So ciety. Series B (Metho dolo gic al) , 11:394–403, 1983. [8] C. I. Chow and C. N. Liu. Approximating discrete probability distributions with de- p endence trees. IEEE T r ansactions on Information The ory , 14:462–467, 1968. [9] J.A. Costa, A. Girotra, and A.O. Hero. Estimating lo cal intrinsic dimension with k- nearest neigh b or graphs. In 2005 IEEE/SP 13th Workshop on Statistic al Signal Pr o- c essing , pages 417–422, 2005. [10] E. J. Dudewicz and E. C. v an der Meulen. En tropy-based tests of uniformit y . Journal of the A meric an Statistic al Asso ciation , 76:967–974, 1981. [11] P . B. Eggermont and V. N. LaRiccia. Best asymptotic normality of the k ernel densit y en tropy estimator for smo oth densities. Information The ory, IEEE T r ansactions on , 45(4):1321 –1326, May 1999. [12] D. Ev ans. A law of large n umbers for nearest neigh b or statistics. Pr o c e e dings of the R oyal So ciety A , 464:3175–3192, 2008. [13] D. Ev ans, A. Jones, and W. M. Schmidt. Asymptotic moments of nearest neighbor distance distributions. Pr o c e e dings of the R oyal So ciety A , 458:2839–2849, 2008. [14] A.M. F arahmand, C. Sep esv ari, and J-Y Audib ert. Manifold-adaptive dimension estim- ation. Pr o c of 24th Intl Conf on Machine L e arning , pages 265–272, 2007. [15] K. F ukunaga and L. D. Hostetler. Optimization of k-nearest-neighbor density estimates. IEEE T r ansactions on Information The ory , 1973. [16] E. Gin´ e and D.M. Mason. Uniform in bandwidth estimation of integral functionals of the densit y function. Sc andinavian Journal of Statistics , 35:739761, 2008. [17] M. Goria, N. Leonenk o, V. Mergel, and P . L. Novi In v erardi. A new class of random v ector entrop y estimators and its applications in testing statistical h yp otheses. Non- p ar ametric Statistics , 2004. 89 [18] Peter Hall and J. S. Marron. Estimation of in tegrated squared densit y deriv atives. Stat. Pr ob. L ett , pages 109–115, 1987. [19] A. O. Hero, J. Costa, and B. Ma. Asymptotic relations b et w een minimal graphs and alpha-entrop y . T e chnic al R ep ort CSPL-334 Communic ations and Signal Pr o c essing L ab or atory, The University of Michigan , Marc h 2003. [20] A. O. Hero, B. Ma, O. Michel, and J. Gorman. Applications of entropic spanning graphs. Signal Pr o c essing Magazine, IEEE , 19(5):85 – 95, sep 2002. [21] Marc M. V an Hulle. Edgeworth approximation of multiv ariate differential entrop y . Neur al Computation , 17(9):1903–1910, 2005. [22] A. T. Ihler, J. W. Fisher I I I, and A. S. Willsky . Nonparametric h yp othesis tests for stat- istical dep endency . IEEE T r ansactions on Signal Pr o c essing , 52(8):2234–2249, August 2004. [23] A.K. Jain. Image data compression: A review. Pr o c e e dings of the IEEE , 69(3):349 – 389, Marc h 1981. [24] A. Lakhina, M. Cro vella, and C. Diot. Mining anomalies using traffic feature distribu- tions. In In ACM SIGCOMM , pages 217–228, 2005. [25] B. Laurent. Efficient estimation of integral functionals of a density . The Annals of Statistics , 24(2):659–681, 1996. [26] N. Leonenk o, L. Prozan to, and V. Sa v ani. A class of r ´ en yi information estimators for m ultidimensional densities. Annals of Statistics , 36:2153–2182, 2008. [27] N. Leonenk o, L. Prozan to, and V. Sa v ani. A class of r ´ en yi information estimators for m ultidimensional densities. Annals of Statistics , 36:2153–2182, 2008. [28] E. Levina and P . J. Bic kel. Maxim um likelihoo d estimation of intrinsic dimension. In A dvanc es in Neur al Information Pr o c essing Systems , Cambridge, MA, 2005. [29] E. Liiti¨ ainen, A. Lendasse, and F. Corona. On the statistical estimation of r´ en yi en trop- ies. In Pr o c e e dings of IEEE/MLSP 2009 International Workshop on Machine L e arning for Signal Pr o c essing, Gr enoble (F r anc e) , September 2-4 2009. [30] D. O. Loftsgaarden and C. P . Quesenberry . A nonparametric estimate of a multiv ariate densit y function. Ann. Math. Statist. , 1965. [31] Y. P . Mack and M. Rosen blatt. Multiv ariate k-nearest neigh b or density estimates. Journal of Multivariate Analysis , 9(1):1 – 15, 1979. [32] E. G. Miller and J. W. Fisher I I I. ICA using spacings estimates of en tropy . Pr o c. 4th Intl. Symp. on ICA and BSS , pages 1047–1052, 2003. 90 [33] D. S. Mo ore and J. W. Y ac kel. Consistency prop erties of nearest neighbor density function estimators. The Annals of Statistics , 1977. [34] H. Neemuc h wala and A. O. Hero. Image registration in high dimensional feature space. Pr o c. of SPIE Confer enc e on Ele ctr onic Imaging, San Jose , Jan uary 2005. [35] X. Nguyen, M. J. W ain wrigh t, and M. I. Jordan. Estimating divergence functionals and the lik eliho o d ratio by conv ex risk minimization. Information The ory, IEEE T r ansac- tions on , 56(11):5847 –5861, Nov ember 2010. [36] D. P´ al, B. P´ oczos, and C. Szep esv´ ari. Estimation of R \ ’enyi Entrop y and Mutual Information Based on Generalized Nearest-Neighbor Graphs. A rXiv e-prints , Marc h 2010. [37] B. Ranneb y . The maximum spacing metho d. an estimation metho d related to the max- im um lik eliho o d metho d. Sc andinavian Journal of Statistics , 11:93–112, 1984. [38] V. C. Rayk ar and R. Duraisw ami. F ast optimal bandwidth selection for k ernel density estimation. In J. Ghosh, D. Lam b ert, D. Skillicorn, and J. Sriv asta v a, editors, Pr o- c e e dings of the sixth SIAM International Confer enc e on Data Mining , pages 524–528, 2006. [39] Xavier Saint Ra ymond. Elementary Intr o duction to the The ory of Pseudo differ ential Op er ators . CR C Press, 1991. [40] H. Singh, N. Misra, and V. Hnizdo. Nearest neighbor estimators of en tropy . The Annals of Statistics , 2005. [41] K. Sricharan, R. Raich, and A. O. Hero. Global p erformance prediction for divergence- based image registration criteria. In Pr o c. IEEE Workshop on Statistic al Signal Pr o- c essing , 2009. [42] K. Sricharan, R. Raic h, and A. O. Hero. Empirical estimation of entrop y functionals with confidence. ArXiv e-prints , Decem b er 2010. [43] B. v an Es. Estimating functionals related to a density by class of statistics based on spacing. Sc andinavian Journal of Statistics , 1992. [44] O. V asicek. A test for normality based on sample en trop y . Journal of the R oyal Statistic al So ciety. Series B (Metho dolo gic al) , 38:54–59, 1976. [45] Q. W ang, S. R. Kulk arni, and S. V erd ´ u. Divergence estimation of con tinuous distribu- tions based on data-dep endent partitions. Information The ory, IEEE T r ansactions on , 51(9):3064–3074, 2005. 91
Original Paper
Loading high-quality paper...
Comments & Academic Discussion
Loading comments...
Leave a Comment