Growth Patterns of Subway/Metro Systems Tracked by Degree Correlation
Urban transportation systems grow over time as city populations grow and move and their transportation needs evolve. Typical network growth models, such as preferential attachment, grow the network node by node whereas rail and metro systems grow by adding entire lines with all their nodes. The objective of this paper is to see if any canonical regular network forms such as stars or grids capture the growth patterns of urban metro systems for which we have historical data in terms of old maps. Data from these maps reveal that the systems’ Pearson degree correlation grows increasingly from initially negative values toward positive values over time and in some cases becomes decidedly positive. We have derived closed form expressions for degree correlation and clustering coefficient for a variety of canonical forms that might be similar to metro systems. Of all those examined, only a few types patterned after a wide area network (WAN) with a “core-periphery” structure show similar positive-trending degree correlation as network size increases. This suggests that large metro systems either are designed or evolve into the equivalent of message carriers that seek to balance travel between arbitrary node-destination pairs with avoidance of congestion in the central regions of the network. Keywords: metro, subway, urban transport networks, degree correlation
💡 Research Summary
The paper investigates how urban subway and metro systems evolve over time by analyzing historical maps of several major cities. Unlike classic network growth models that add nodes one by one (e.g., preferential attachment), real-world rail networks expand by introducing whole lines, each comprising multiple stations. The authors digitized historic schematics for cities such as New York, Paris, London, Tokyo, and Shanghai, converting each snapshot into an undirected graph where stations are nodes and direct track segments are edges.
Two primary topological metrics were examined: Pearson degree correlation (r) and clustering coefficient (C). Degree correlation measures the tendency of high‑degree nodes to connect to other high‑degree nodes (positive r) or to low‑degree nodes (negative r). Clustering quantifies the prevalence of triangular connections, reflecting local density. The authors first derived closed‑form expressions for r and C for a suite of canonical graph families—star, lattice, ring, and a “core‑periphery” (WAN‑like) model—providing theoretical baselines against which empirical data could be compared.
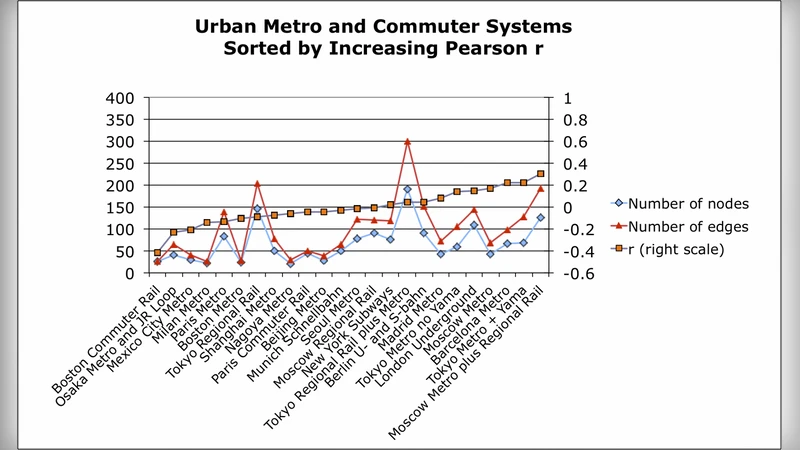
Empirical results reveal a clear trajectory. In early stages (networks with fewer than ~30 stations), r is consistently negative (‑0.2 to ‑0.4) and C is near zero, indicating a star‑like, hub‑spoke configuration where a few central stations dominate connectivity. As the system expands beyond ~100 stations, r approaches zero and then becomes positive, reaching values of 0.2–0.5 for networks exceeding 300 stations. Simultaneously, C rises from ~0.05 to >0.2, suggesting increasing local redundancy. The only canonical model that reproduces this positive‑trend is the core‑periphery structure, in which a dense core of high‑degree nodes coexists with a peripheral ring of low‑degree nodes that are interlinked both to the core and among themselves.
Visualization and community‑detection analyses confirm that large metro systems indeed develop a distinguishable core (major interchange stations) and periphery (outer‑city stations). Additional metrics—average shortest‑path length and betweenness centrality distribution—show that while the mean path length grows modestly (1.5–2×) with size, betweenness becomes more evenly spread, reducing the overload on any single hub. This pattern aligns with the notion that mature subway networks behave like wide‑area communication networks: they aim to balance travel demand across many origin‑destination pairs while avoiding congestion in the central core.
The authors interpret the findings in two complementary ways. First, from a design perspective, planners may deliberately adopt a core‑periphery topology to distribute passenger loads and improve resilience. Second, from an evolutionary standpoint, as urban populations and travel demands diversify, new lines are more likely to connect peripheral districts directly rather than merely extending spokes from the central hub, naturally driving the system toward a positive degree correlation.
In conclusion, the study demonstrates that the structural evolution of subway systems cannot be captured by simple node‑by‑node growth models; instead, they follow a line‑by‑line expansion that gradually reshapes the network into a WAN‑like core‑periphery architecture. This insight has practical implications for future transit planning: expanding peripheral connectivity and reinforcing secondary hubs can enhance overall efficiency and robustness. The paper also opens avenues for further research, such as integrating multimodal transport layers (bus, tram, bike‑share) into a multiplex network framework and simulating policy interventions to assess their impact on topological evolution.
Comments & Academic Discussion
Loading comments...
Leave a Comment