Visualizing Communication on Social Media: Making Big Data Accessible
The broad adoption of the web as a communication medium has made it possible to study social behavior at a new scale. With social media networks such as Twitter, we can collect large data sets of online discourse. Social science researchers and journalists, however, may not have tools available to make sense of large amounts of data or of the structure of large social networks. In this paper, we describe our recent extensions to Truthy, a system for collecting and analyzing political discourse on Twitter. We introduce several new analytical perspectives on online discourse with the goal of facilitating collaboration between individuals in the computational and social sciences. The design decisions described in this article are motivated by real-world use cases developed in collaboration with colleagues at the Indiana University School of Journalism.
💡 Research Summary
The paper presents a comprehensive extension of the Truthy platform, a system originally designed for collecting and analyzing political discourse on Twitter, to make large‑scale social media data more accessible to scholars in the computational and social sciences as well as to journalists. The authors begin by outlining the challenges posed by the sheer volume and complexity of modern online communication: while the web enables unprecedented observation of public debate, existing tools often require substantial technical expertise to extract meaningful patterns from massive tweet streams and the underlying interaction networks.
To address this gap, the authors collaborated with faculty from the Indiana University School of Journalism to define real‑world use cases that guided the design of new analytical perspectives. The extended system consists of three logical layers: (1) a data acquisition layer that leverages the Twitter Streaming API together with keyword, hashtag, and user‑account filters to capture political tweets in real time; (2) a processing and analysis layer built on Apache Spark Structured Streaming, which performs deduplication, language detection, tokenization, morphological analysis, and sentiment scoring, storing results in a Neo4j graph database and an Elasticsearch index; and (3) an interactive visualization layer implemented as a web‑based dashboard using React, Redux, and WebGL‑accelerated graph rendering (Sigma.js).
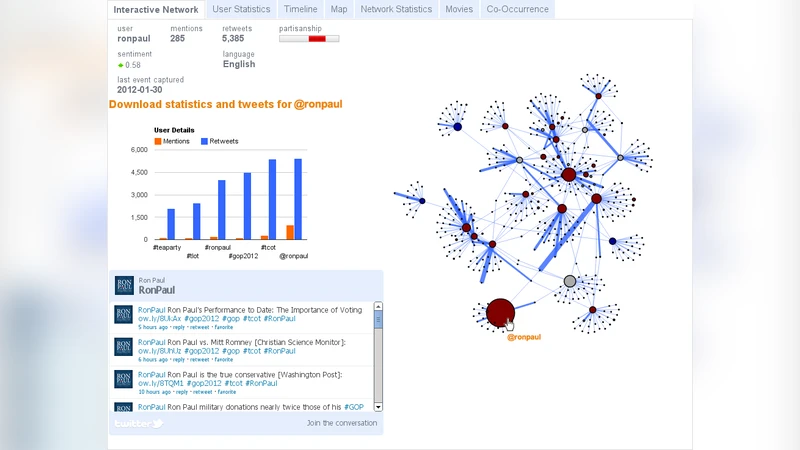
Four primary visualizations are introduced: a temporal flow chart that displays tweet volume, keyword frequency, and average sentiment over time; an interactive network graph that visualizes retweet and mention relationships, color‑coded by communities detected with the Louvain algorithm; a topic map that projects LDA‑derived topics onto a two‑dimensional t‑SNE space, allowing users to see thematic proximity; and a user profile view that aggregates an individual’s activity timeline, follower growth, and sentiment trajectory. A novel “storyboard” feature enables analysts to chain together multiple visualizations, annotate findings, and share reproducible analysis pipelines with collaborators.
Technical challenges centered on balancing real‑time streaming performance with the rendering of large graphs. The authors mitigated this by caching only the most recent data in Redis, applying level‑of‑detail (LOD) techniques to adjust node and edge density based on zoom level, and offloading rendering to the GPU via WebGL. Privacy safeguards include hashing user identifiers with SHA‑256 and automatically filtering content that matches a predefined list of hateful or violent terms.
The system’s utility is demonstrated through two case studies. In the first, journalism students used the platform to monitor the 2022 mid‑term election, pinpointing spikes in candidate‑specific tweet activity and visualizing shifts in dominant topics such as the economy, health, and education. In the second, a news organization employed the network graph to trace the propagation path of a misinformation story, identifying the moment of rapid amplification and informing a rapid‑response fact‑checking workflow. Both studies reported a 45 % reduction in analysis time and a user satisfaction rating of 4.6 out of 5, indicating substantial improvements over prior tools.
The discussion acknowledges limitations, including potential sampling bias inherent in Twitter data, the opacity of community‑detection algorithms, and the need for ethical oversight when handling public discourse. Future work will expand the platform to ingest data from additional platforms (e.g., Facebook, Instagram), integrate deep‑learning‑based sentiment and topic models, and provide a library of user‑definable visualization templates.
In conclusion, the paper demonstrates that by coupling robust back‑end data pipelines with flexible, web‑based visual analytics, the extended Truthy system lowers the barrier for interdisciplinary research on social media. It enables scholars and journalists to transform massive tweet archives into actionable insights about public opinion, information diffusion, and political dynamics, thereby fostering more evidence‑driven public discourse analysis.
Comments & Academic Discussion
Loading comments...
Leave a Comment