Evaluating sources of variability in pathway profiling
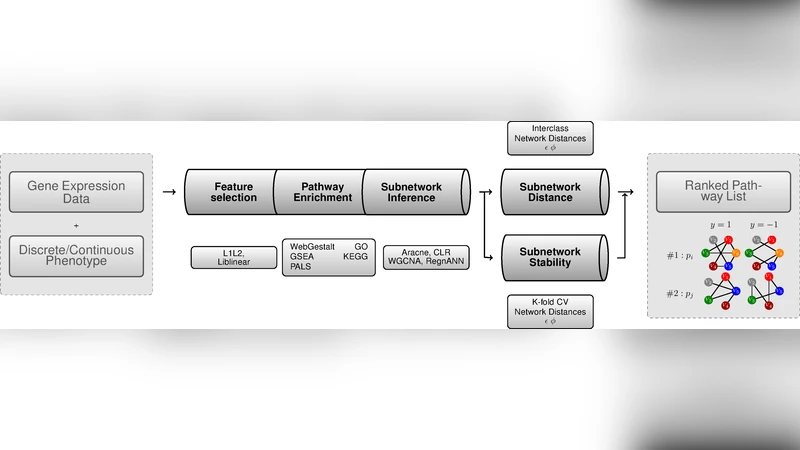
A bioinformatics platform is introduced aimed at identifying models of disease-specific pathways, as well as a set of network measures that can quantify changes in terms of global structure or single link disruptions.The approach integrates a network comparison framework with machine learning molecular profiling.
💡 Research Summary
The paper presents an open‑source computational platform that integrates network comparison with machine‑learning‑based molecular profiling to identify disease‑specific pathway models and quantify structural changes in biological networks. The authors focus on five major sources of variability that can affect pathway‑profiling results: (1) the choice of classifier, (2) the feature ranking/selection algorithm, (3) the enrichment (pathway‑over‑representation) procedure, (4) the network inference method, and (5) the network‑comparison function. By systematically varying each component, the study evaluates how methodological decisions propagate through the analysis pipeline and influence the final biological interpretation.
Data and preprocessing
The authors used a publicly available microarray dataset comprising late‑stage Parkinson’s disease (PD) patients and matched healthy controls. After standard background correction, log‑transformation, and imputation of missing values, they applied four distinct feature‑selection strategies: (i) univariate t‑tests, (ii) LIMMA moderated statistics, (iii) Random‑Forest variable importance, and (iv) LASSO regression coefficients. Each strategy produced a different set of candidate genes (ranging from a few hundred to several thousand).
Enrichment analysis
Selected gene sets were mapped to multiple pathway repositories (KEGG, Reactome, GO Biological Process). Two enrichment approaches were employed in parallel: Fisher’s exact test for over‑representation and Gene Set Enrichment Analysis (GSEA) for rank‑based assessment. The resulting pathway lists differed markedly across feature‑selection methods, highlighting the first layer of variability.
Network inference
For each enriched pathway, the authors reconstructed two types of interaction networks: (a) a weighted co‑expression network using WGCNA, which captures correlation‑based edges, and (b) a probabilistic Bayesian network that infers directed, potentially causal relationships. Because the underlying statistical assumptions differ, the same pathway can yield networks with distinct topologies, node centralities, and modular structures.
Network comparison
To quantify differences between networks derived from alternative pipelines, the authors calculated a suite of global metrics (graph diameter, average clustering coefficient, modularity) and local metrics (edge‑presence/absence, node‑level centrality differences). They introduced a “link‑replacement score” that specifically measures how often an edge present in one network is missing in another, providing a fine‑grained view of methodological impact on network architecture.
Machine‑learning classification
From each inferred network, a set of network‑derived features (e.g., hub degree, module eigengenes, edge weights) was extracted and fed into four classifiers: Support Vector Machine, Random Forest, Logistic Regression, and Gradient Boosting. Model performance was assessed via 10‑fold cross‑validation and 1,000 bootstrap repetitions, reporting accuracy, AUC, and F1‑score. The results demonstrated that classifier choice interacts with upstream decisions (feature selection, enrichment, network inference) to produce a wide range of predictive performances.
Biological findings
Despite low overlap among the pathway lists generated by different pipelines, each set highlighted biologically plausible aspects of PD pathology. WGCNA‑based networks emphasized mitochondrial dysfunction and oxidative‑stress modules, whereas Bayesian networks brought out dysregulated neurotransmitter metabolism and immune‑response pathways. The authors argue that these complementary perspectives reflect distinct, yet equally valid, facets of the disease process.
Reproducibility and open‑source implementation
The entire workflow is containerized with Docker and orchestrated by Snakemake, ensuring that any researcher can reproduce the analyses with a single command. All scripts, configuration files, and example data are hosted on GitHub under an MIT license, fulfilling the authors’ commitment to transparency and community reuse.
Conclusions
By dissecting the contributions of classifier, feature‑ranking, enrichment, network inference, and comparison steps, the study demonstrates that pathway‑profiling results are highly sensitive to methodological choices. However, the variability is not merely noise; different pipelines uncover complementary biological signals. Consequently, the authors recommend integrating results across multiple methods rather than relying on a single analytical route. The open‑source platform they provide offers a flexible, reproducible foundation for future studies aiming to compare disease‑specific pathways across diverse omics datasets.
Comments & Academic Discussion
Loading comments...
Leave a Comment