Homo denisova, Correspondence Spectral Analysis, Finite Sites Reticulate Hierarchical Coalescent Models and the Ron Jeremy Hypothesis
This article shows how to fit reticulate finite and infinite sites sequence spectra to aligned data from five modern human genomes (San, Yoruba, French, Han and Papuan) plus two archaic humans (Denisovan and Neanderthal), to better infer demographic …
Authors: ** - Peter J. Waddell (Department of Biological Sciences, Purdue University) - Jorge Ramos (Department of Computer Science, Purdue University) - Xi Tan (Department of Physics
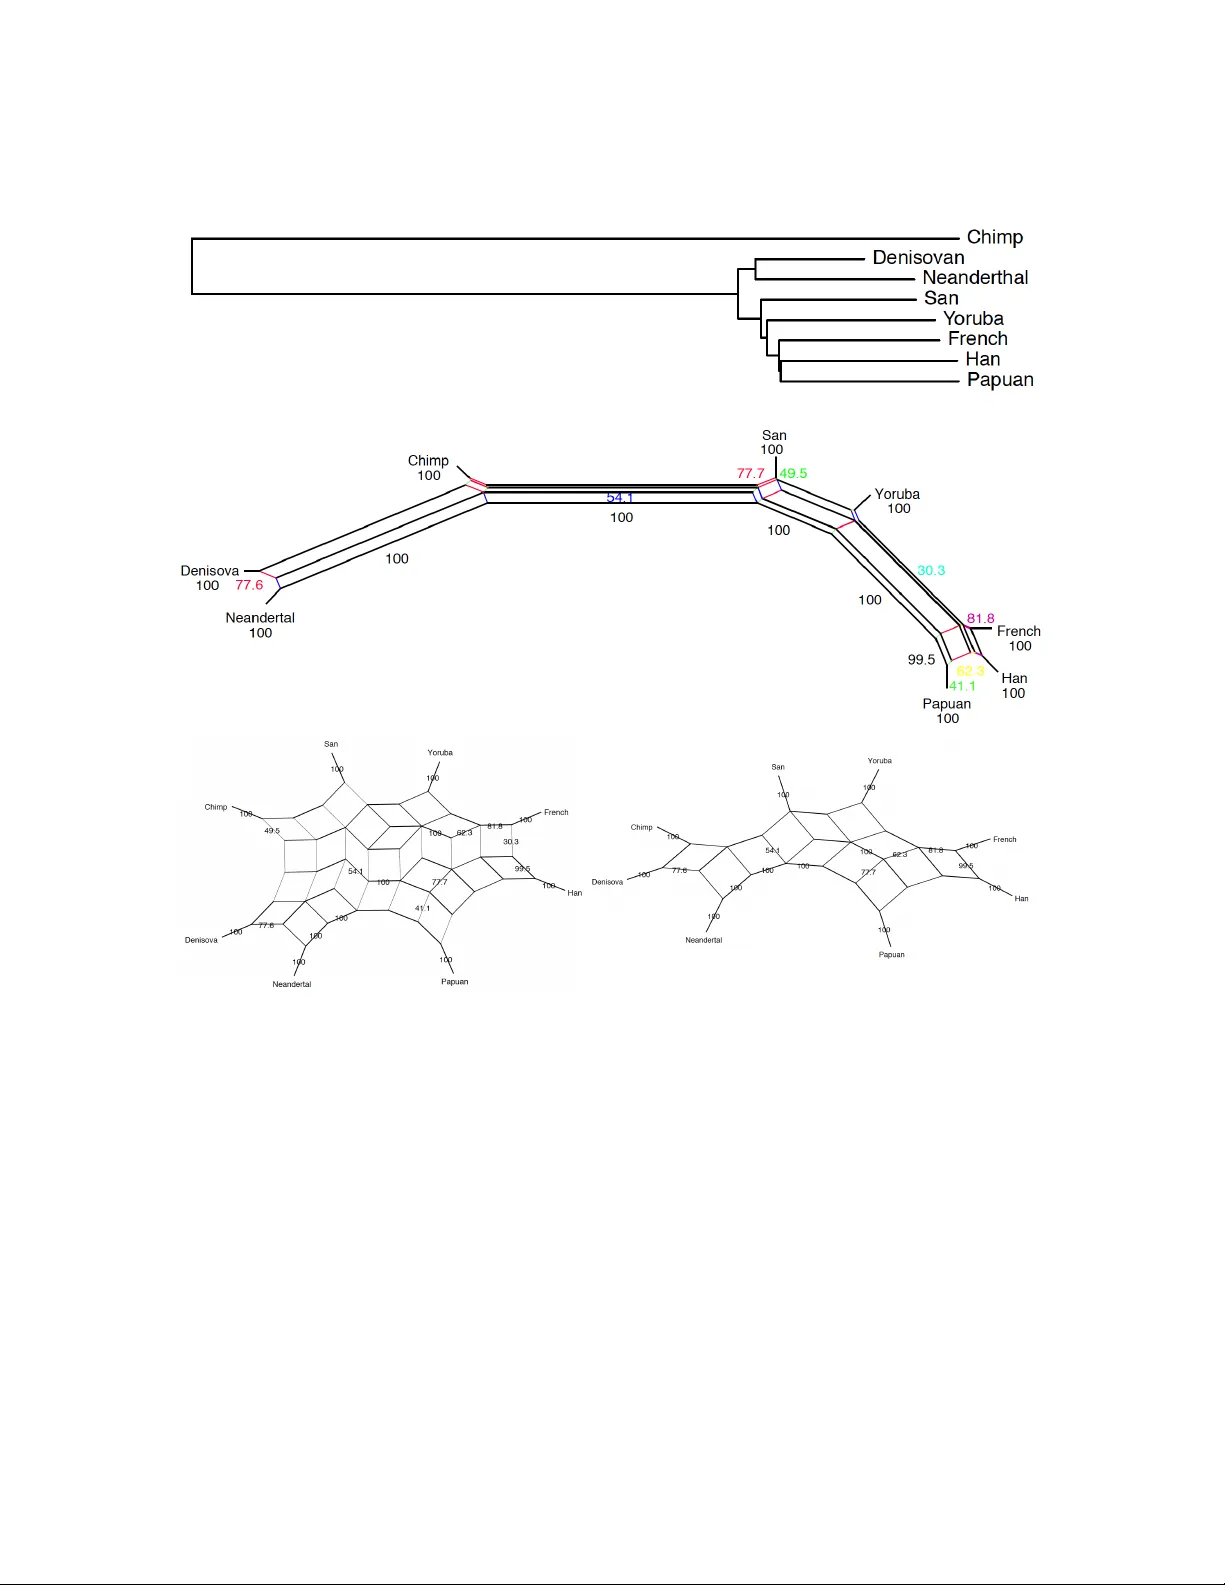
Waddel l , Ramos and Xi (2011). S pectral An alysis of H omo den isova and relatives Page 1 Homo denisova , Correspondence Spectral Analysis, Finite Sites Reticulate Hierarchical Coalescent Models and the Ron Jeremy Hypothesis Peter J. Waddell 12 , Jorge Ramos 3 , and X i Tan 2 pwaddell@purdue.edu 1 Depart ment of Biologic al Sciences, Purdue University, West Lafayette, IN 47906, U.S.A. 2 Depart ment o f Comput er Sc ience , Pur due Uni versi ty, West La fayet te, IN 4790 6, U. S.A 2 Depart ment o f Phys ics, Purdue Unive rsit y, West Lafa yette , IN 47906, U.S. A . This articl e show s how to fit reticulate finite and infinite sites sequence spectra to alig ned data from five modern human genom es (San, Yoruba, French , Han and Papuan ) plus two archaic humans (De nisovan a nd Ne anderthal) , to bett er infer demographic parameters. These in clude interbreedin g be tween distinct line ages. Maj or impr ovem ent s in the fit of the sequ enc e spect ru m are made w ith successively more com plicated models. Findings include some evidence of a male biased gene flow from the Denisov a line age to Papu an ancest ors and possibly even more archaic gene flow. It is unclear if there is evidence for more than one Neanderthal interbreedi ng, as the evidence suggesting this l argely disappears when a finite sites model is fi tted. Keywords : Homo neanderth alens is , Hom o den isova, phylogen e tic spectral analysis, Hadam ard conjugation, correspondence analysis, hierarchical coalescence model s , interbre eding, hybridization population genet ics Waddel l , Ramos and Xi (2011). S pectral An alysis of H omo den isova and relatives Page 2 1 Introduction The year 2010 marked the publicati on in Nature and Science Magazine of the first large amounts of genomic data from archaic hu mans. In M ay 2010, Green et al. (2010) publi shed a partial Neanderthal Genom e, along with analyses that suggested there was 2 - 5% interbreeding between Neanderthals and the ancestors of the modern p eople that left A frica. Shortly after, it was announced that the mitochon dria l genomic sequence of a bone fr om the Denisova cave in Siberia sh owed another lineage of archaic humans had survived in Eurasia until the time that moder n humans star ted to set tle the area (Krause et al. 2010) . F inally, Chr istmas 2010 was marke d by the publica tion of a set of data and analys es that st rong ly sugges ted that modern humans had interbreed w ith at least two distinct lineages of ar c haic homin i ds (Reich et al. 2010). Remar kably, their data set now had a geographical diverse array of modern human and two geographically widespread archaic human genomes (a Neanderthal an d a Denisovan ) . The analyses suggested that while the Denisovan seque nce was closes t to that of Neander thal s, it was a highly distinct line age. Further, it appeared that the modern P apuan sequence an alyzed had received app roximately 5% of its genome from this archaic hominid , in addition to all the out of Africa g enomes sharing 2 - 5% N eanderthal genes (Reich et al. 2010 , Reich et al. 2011 ) . Rem arkably , the fraction of Nean derthal genes in all the o ut of African sequences was ver y simi lar. There wa s no evidence that the relatively gracile Han Chinese person sequenced had any fewer Neandert hal genes that the French person sequen ced, indeed if anything, they seemed to show more such genes . Apart from gi ving us a unique and exc iti ng ins ight to our orig ins, the da ta th rew th e spotlight once again on the gaps in our existing methodology for analyzing genomic sequences. The genomes mostly seemed to foll ow a single species tree, but ther e was not enough time for nearly complete inbreeding or coalescence along edges of this species tree. Therefore gene trees, or m ore accurately, unlinked regions of the genome, could follow branching patterns different to that of the species tree. Further, there seemed to be distin ct cases o f interbree ding between lineages of the main species tree , which is a tricky issue for phylo genetic a nalysis. Finally, the data suggested rather high rat es of sequencing error in the various genome sequences, up to approximately half of all the polymorphisms in som e of the genomes gathered appeared to be sequencing errors (Reich et al. 2010, particularly supplement parts 2 and 3). In a ddition, there would also be mistaken cases of the true identity of the ancestral state as the Chimpanzee outgroup was about 14 million years separating the human sequences from the Chimpanzee outgroup. Unfortunately, no full likelihood based analysis combines all these featur es, although metho ds develope d in Wadde ll (1995) come clo se, showi ng how to combine fin ite sit es models with hierarchal coalescent models, and showing also how to deal with r eticulate evolution. It is th erefore im portant to lo ok in detail at the analysis of this data and how it might be improve d. For example, s o me of the stat ist ics used in Rei ch et al. (201 0) are a redevelopment of earlier published methods , suc h as those in Waddel l e t al . (1 995 , 200 0 and 200 1) . T he E - statistics of Reich et al . for quartet s are essentiall y the same as the binomial P statistics for testing disagreement of three taxon rooted tree s under a coalescent model (e. g. , Waddel l et al. 2001 ). These statistics are based on fo u r tax on patte rns AABB, A BAB and A BBA, which in the rooted triplet form are 011, 101 and 110 since the outgroup with state 0 is always the left most taxon (thus giving the pa tterns 0011, 010 1 and 0110 , Wad dell et al. 2001 ). In deed, many of the statistics explored by Reich et al. (2010) are subsets of the more genera l spectral methods deve loped in phylogenetics by authors such as Hen dy and Penny ( 1990), wit h a particula r connec tion to population genetics as described in Waddell (1995). Reduced sub - spectral methods such as those in Waddel l et al. (2 000 , 2001 ) and Reich et al. ( 2010) are powerful methods for probing complex population histories, including hybridizati on, but they ultimately lack power com pared to using the full spec trum of e dge length s/substitutio n patterns. Waddel l , Ramos and Xi (2011). S pectral An alysis of H omo den isova and relatives Page 3 Looking at the spectra of multip le gr oups in cludes the need to recognize the fact that some sites in the sequence may follow a different history to others. T his is often called the “ gene - tree species tree proble m. ” However, this focus on ge nes may be unfort unate and can lead to some fundamental misu nderstandings along with mis leading estimates . A num ber of authors independ ently de veloped metho ds of estimating the ancestr al popu lation size of d ifferent sp ecies using DN A sequences. The method’s of W addell (1995) which led to the first robust estimates of the anc estral pop ulation s ize of humans an d chim ps w ere insp ired by direct com municatio n with Dick Hudso n, one of the ori ginat ors of coal esce nt theor y. This incl uded discussion the seminal paper, Hudson (1992) , th at pointe d out th e need to consid er not only the probability that a stretch of DNA follows a parti cular history, but also the probability of observin g it (which is a function of the mean edge lengths of the different gene trees as well as the probability of those trees ). In addition, the probabi lity of o bserving a pa rticular “g ene” tre e, is d ependen t upon how many potentially identically segregating sites it includes, which is, in t urn a function of the local recombination rate. Such concepts fit in naturally with the concept ual framework of the Hadamar d conjug atio n (Hendy and Penny 1993) . In these method s, si ngle site patt erns are t he object of interest. This in turn leads to a certain freedom from the tyranny of being unable to know where precisely recombination has occurred, since a single orthologous site may be corre lated with it’s neighbor, b ut is itself in divisible (giv en a reliab le alignme nt). Independen t a ttempts to stud y ancestral p olymorp hism (e .g. , Ruvolo 1997 ) te nd to infer population history by counting how m any trees of different typ es are reconstructed by different genes. This is unfortunately a misleading m ethod given unequal numbers of potentially segregating sites and/or recombination (Waddell 1995) . Dir ectl y counting “gen e trees” is an inherently unreliable and biased - method . In d eed, such methods may be called “ Dick - less ” since they do not tak e to he art the e ssential in sights of Hudson (1992) on link be tween what is observe d and what the underlying genetic model is . In contr ast, spe ctral m ethods allow an unbiased reconstruction of the poly morph ism prese nt in anc estral specie s (Wad dell 199 5, see al so Wa ddell et al. 2000, 200 1, 2002 ). S uch a pproaches are very m uch the “F ull -M onty ” (a n English term meani ng “ the full deal ” ) as they can be extended to in clude a variety of ways to correc t for multi ple cha nges at a site due to ongoin g mutation . In this w ay they are ab le to give unbias ed estimates of ancient ancestral diversit y and hence to escape the bias created b y spectral methods based purely on the infinite - sites model (W addell 1995) . Wit h mu ch going for this appro ach , i t does have one weakness , t hat is , i t can be di fficult to est imate t he preci se vari ance of the estimates, since it is not determinable precisely where recombination has occurred (and hence how many genetic “unit s” or loc i are involved). This problem is addressed in this art icle. Finally, we conside r the old question of what a species is , partic ularly as it pertains to humans . It is generally accepted by modern biologists that living human s comprise a single species (e.g. , Waddell and Pen ny 1996), yet it is also increasingly recog nized that there is no single essence to a species. The opinion tha t all living humans are a single species is based o n a variety of criter ia including evidence for l ow genetic differentiat ion and a surprisingly recent time of origin (e.g., Penny et al. 19 95,) . Fu rther, it is also often argued that extinct populations, such as Neander thal s, might best be co nside red a subspecies or even a population of modern humans. The latter view is re inforced by recent find ings that N eanderthal g enes have apparently entered the whole no Af ric an mod ern gene poo l , at levels of 2- 5% (Green et al. 2010) . On the other hand, human groups show a strong cultural capacity to self - identify. T his may incl ude ac tive genoci de against groups not considered “like.” A well - studied exam ple of this was the extermi nati on of Tasmania n aborigi nes by European Austr ali ans. Such a powerful ability to nearly com pletely repla ce the gene poo l of initially num erically sup erior competing popu lations wo uld seem to generally be more a property of different species than members of the same species. So far it is unclear whether this property is readily found within other taxa called species , including the other apes. This is an area t hat genomics is now capable of unraveling. Waddel l , Ramos and Xi (2011). S pectral An alysis of H omo den isova and relatives Page 4 Actin g as devi l’s advo cate is an i mport ant part of scie ntif ic proce ss a nd i n th at s piri t, here we ma y treat each human population sampled as a different “species.” As on e esteemed Anglo - Saxon Americ an g eneticist colleague commented on hearing som e of these argum ents, he was not sure about the other groups, but could see how the French could be a different species, i.e ., Homo frog gieii . Thus we fi nd oursel ves in the clo se company of Darwin when he asked "The question whether ma nkind cons ists of one o r several sp ecies (D escent of M an, 187 1, p. 24) ” saying “ it is a hopeless endeavor to decide this p oint on sou nd grou nds, until so me definitio n of the term "species" is generally accepted; and the definition must not include an elem e nt that c annot possibly be ascertained, s uch as an act of creation. ” A concept of species that seems particularly apt to tes t in describing hominid evolution is the ability o f a sm aller group to replace a large population of close relatives through direct competition with minimal genetic exchange. This an ul timate form of the expre ssion of a selfish genome. Darwin predi cte d this f or the hu man future , writ ing “ At some future point, not dist ant as measur ed by cent urie s, the civili zed races of man will almo st certainly exterminate an d replace the sa va ge races throughout the world ” (h ere, civilized refer r ed to European cultures ). While thi s now hopefully seems less like ly to occur, the era of genom ic data is allo wing us to a ddress questions on matters of the closure of gene pools, such as which homi nid gr oups have acted mor e like differen t species , when co mpared to othe r ta xa o f our own order Primates. 2 Materials and Methods The data come directly from Reich et al. (2010). The p rocessing of this data is rewri tten here as best we underst and it based on discussi ons/correspondence with the authors (particularly Nick Patt erso n and Martin Kir cher) and details largely in the supplement to their article ( for example, p32) . T he chimp reference genome is u sed as the ou tgroup to call the ance stral state . This genome comprise d the super - contigs of 23 autosomes (the same as human except human chromosome 2 is represented as two separate chromosomes 2a and 2b , as in the ch imp). In addition, the chimp reference genom e con tain s collections of contigs that are located to particular chromosomes, but do not fit well into the known sup er - contigs of those chromosom es. These are called random blocks and also serve as targets for alignments of the hominid genomic reads. Next , i ndepend ently, the short reads of five modern humans and the Denisova spec imen were aligned to this genomic target using the B WA aligner. Only reads showing a high confidence of a close and unique m apping w ere kept. The reads of the three Vindija Neande rtha ls were pooled and these were m apped in the same basic way except that the aligner u sed was ANFO as it was deemed to have a bett er capacity to deal with the unique s equencing error spectrum of the Neander thal dat a (Reich et al. 2010) . A sc ript was th en wri tten ( by N. Patterson) to read along these alignm ents. Wh enever a site in chimp was aligned to at least o ne read of each of the other seven taxa (the five modern humans, Homo san or S, Homo yoruba , Y, Homo froggi eii , F , Homo han , H, an d Homo papuan , P, H. deniso va , D , and H. neandertha lens is , N) that met their specified quality standards was the site pattern kept. If a taxon had m ore than one read, the read to represent that taxon was randomly chosen. Only transversional changes were kept which is equi valent to r ecoding the d ata as R = A or G and Y = C or T. This is a standard approach in spectr al analysis (e.g. , Hendy and Penny 19 93 ) and ensures rob ustness as (1) transversions occur le ss frequ ency than transition s in these sequences, reducing the rate of double m utations at an aligned site (2) Many of the sequencing errors in the Neanderthal in particular are transitional ch anges. Despite this, perhaps up to half of all the base changes i n t his data a re sequencing errors (Reich et al. 2010 , SI 2 and SI 6 in particu lar ). The results were written out for each chromosome separa tely and also separatel y for chunks of the random blocks from each chromosome. These are t he dat a that under lie the Waddel l , Ramos and Xi (2011). S pectral An alysis of H omo den isova and relatives Page 5 analyses of Reich et al. SI6 - 8 and figure 3 in the main article (p lus th e X c hromosom e which was not reported in that secti on, but was inve stigated elsewhere, e.g. SI2) . The inde xing used was basically identical to the binary numbering of Hendy and Penny (1993) , excep t they were written left to r ight rather than right to left . For e xample, the original ordering used was FHPSY NDC. We reord er the se to CDNSYFHP so that they conf ir m to the sta nda rd bina ry ord eri ng wher e the outgroup (state 0) is always on the left and so that they follow a linearization of the expected “species” tree, wh ich is (C ,( (D,N),(S,(Y,(F ,(H,P)))))) (such reorderin g has immense advantages in remembe ring and in terpreting this ty pe of data). Thus, a patter n where D and P alone share the derived state (p attern DP) is expressed as the bin ary num ber 010 00001. This binar y number is 2 i ! 1 + 2 j ! 1 (where i is the inde x of P (1 in this case) and j is the index of D (7)), w hich is 2 1 ! 1 + 2 7 ! 1 = 1 + 64, or 65, which is it’s base 10 index. The analyses of these raw counts , kindly communicated by Nick Patterson, began with exploration with homogeneity statistics (us ing Mi cro sof t Exce l and R , Ih aka and G entleman 1996, R Core Develop ment Team 2005 ) . These ana lyses were then duplicated (and automated) with PERL script s. In partic ular , the deviati ons of pattern s frequenc ies from mean values were inferred by looking at the pairwise distance between all chromosomes (and their grouped random chro mosome b locks), between all pattern s a cross chromos omes (with or with out random blocks included) and between each pattern on each chromosome wi th it’s expected fr equ ency based on independence (the product of the row total times the column total, divided by the total number of patterns , a type of homogeneity test ). These were further ex plored and vis ualized by building trees using PAUP * (Swofford 2000 , versions b108 to a122 ) and building trees and networks using SplitsTree4 (Huso n an d Bry ant 2006 ) . Corresp ondence ana lysis was performed in R using the package CA ( Ihaka and Ge ntleman 1996, R Core Development T eam 2005 ) , alon g with a variet y of modi fic atio ns an d ext ensions we made t o th e visualizatio n of the plot s. Analys es based on a coale scent m odel for eight sp ecie s (represe nted as a seven taxon rooted tree with C himp serving as the outgroup) were based on an Excel spread sheet. The calculations in t his spread sheet are a generalizat ion of those in Hudson (1993). That is, the excepted internal edge lengths of e ach type o f ge ne tree w ere calculated under a Wrigh t - Fisher infinite sites model using integr ation (Maple was used to check th e form of the integrals) . Then, after mu ltip lication of each expected internal edge length by the relative probability of that type of gene tree, the sum of the expected len gth all internal edges of a particular index was made. This yields the expecte d f requency of t hat biparti tion (or substi tut ion pattern) based on the assumptions of an infinite site s mode l. These in turn are the basis for estimat es of hierarchically structures co alescent m odels , with or w ithout c orrection for mu ltiple subs titutions pe r site ( Hudson 1992, Wad del l 1995 ). The cor r ection for multiple substitutions per site is generally based on a first order Markov transition matrix. In theory , th is shou ld be made over every single realization of a gen e tree (and for every single site rate if som e sites are assum ed to mu tate m ore th an others), but it can be simplified with a variety of integrals (e.g. , Steel et al. 1993). For the divergences considered here, a Hadamard conjugation allowing for a proportion of invariant sites and a gamma distribution of the substitution rates of sites free to vary, offers good accuracy ( Wadde ll and Pe nny 1996, Waddell et al . 2007) . If this is de emed to o slow (typically greater than ~20 taxa w ith 2 - state models) , the fa st appro ximatio ns of Ste el and W adde ll ( 199 8) may be used instead . The program M S (Hu dson 2002 ) was also used to test the predictions of our Excel spreadsheet calculations and to m odel the expected infinite sites spectrum. In turn, MS was run by a PERL script we wrote . This called MS , fee d in the param eters for a hierarc hically s truc tured model of populati ons , with a single h aplotyp e sam pled fro m eac h popu lation. Us ually, 10 million independ ent samples of gene trees were taken and stored, then o ur script processed each tree, adding each internal edge length encountered to a table of all pos sible bipartitions. The edge parameters of this model are time m easured in coalescent units, that is , the numbe r of ge nerations X 2 X 2 Waddel l , Ramos and Xi (2011). S pectral An alysis of H omo den isova and relatives Page 6 divided by the effective population si ze of the gene s. We cal l the se “g ” u nits. 3 Results The results below begin with a prel iminary exploration stru cture in the data using up to date and appropri ate methods of phylogenetic analysis , including residu al res ampling and Neighb orNet s . The re lation ship b etween t he wei ghted site pat tern vectors and tre e space is discussed, part icularly a s the likeli hood function is c losely approximated by a weighted Euclidea n space in the form of a statistic. Fol lowing this, the si te pat tern spectrum is i ntensivel y examined for various types of homogeneity, culminating in visualization of structure be tween chromosomes with Correspondence Analysis tweaked to reveal what seems to be the m ost interesting details , including pote ntial details of male dom inated gen e infusion betw een Denis ovan and Papuan lineages (the so called “ Ron Jer em y Hypothesis ”) . Follo wing this we fit a single “species” tree to the data using a va riety of fit criteria with tweaks, and explore the stability of the key coalescent parameters. We the n int errog ate the data wi th a va rie ty of sets of li near invariants on both the full spectrum , and on subs ets o f it (using the P 1 and P 2 statistics of Waddell et al. 2000 and 2001). These highli ght differ ent aspects of m isfit to a single hierarchi cal coalescent model withou t reticul ation . We then des cri be a coal esc ent model wi th ret icu latio n (hybr idization ) between specified lineag es and mod el a single mixing of Neanderth als with the ancestors of the ou t of Africa modern people. The fit of the predict ed sequence spectr um is examined in detail. Following this we explore the model of a furt her m ixing event between the Denis ova n and the Papuan lineage, using MS. We then move fro m an infini te to a finite sites reticulate coalescent model with mutation and / or seq uencing/proce ssing errors using Exc el spread sheet calculations. This brings a m ajor improv ement in fit of data to m odel. The fit the X chromosome data to the models generated by the autosomal data is checked , an d the implied effective population size of X compared to other chromosomes to test the hypothesis that m ale effective population size i s smaller than that of females (the so called “ Genghis Khan Hypoth esis ”). Finally, we discuss how sub spectral methods, suc h as P, D and E sta tis tics , are treated in a finite sites m odel fram ework . 3.1 Preliminar y explo ration In this section we sho w a f ew useful phylogenetic methods for explo ring inte r populatio n site spectrum data , in cluding som e te chniqu es w e have developed in the past fe w y ears . T hese are metho ds are not suffi cien t in themse lves , but they are more advan ced than those used in Reich et al. ( 2010 ) for preliminary explora tion, thus it is useful to demonstrate them to readers . Confron ted with dat a like th is there is a strong tendency to want to l ook at a tr ee. In particular, since the data represents many predominantl y unlinked sites with incomplete coalescence, it is wise to use a le ast squ ares distance method (e .g., Bryant a nd W addell 199 8) since distances can remain additive in expectation on the spec ies tree under a neutral infinite sites model (we confirm this em pirically by running s im ulations with M S given the optimal parameter values found in later sections) . Also, sinc e the data are transv ersions only and the greate st distance to chimp is only 0.003 substitutions per site, it seems appropriate to work with an uncorrected Hamming or p - distance (sometimes called ! in population genetics as opposed to phylogenetics , Sw offord et al. 1 996 ). In terms of a tree selection criterio n , a flexi - weighte d least squares model with weights proportional to the observed distance raised to powe r P , should give a m uch higher likelihood of the distance data than a BME or N J tree (Waddell et al. 2011 ). In theory, the optimal weigh t for P with this data should be very close to 1 since the variance of a scaled binomially dist ributed dist an ce like the proporti o nal Hamming di stan ce , p, is approximately proportional to p, w hen p is small (here all p - distances are less than 0.01) and if the only sourc e o f e rror is the multinom ial ( although the co alescent proc ess does add som e ov er - X 2 Waddel l , Ramos and Xi (2011). S pectral An alysis of H omo den isova and relatives Page 7 dispersion wh en ther e is any linkage ) . For the data of Reich et al. (2010) , the m inimum value o f P by the g% SD criterion (which is monoto nic with likelihood, Waddell et al. 20 07, Waddel l and Azad 2009) is found at P = 0.2, with a value of 0.235 . At P = 1, the fit is s lightly w orse at g%SD = 0.251 . Since a value of P = 1 is support ed a priori , we w ill w ork with that. T he res ulting tree from PA UP* is shown in figure 1 a . It is id entical in topology to the N J tree of Reich et al. (2010) with similar edge lengt hs. Applyi ng re sidual re sampling procedure s ( Wadde ll and Azad 2009 , Wad dell et al. 2011 ) to th e distance data, all edges receive support values of 100% , ex cept for the groupin g of Han with Papuan , which rec eives supp ort of 85% . Whil e a g%SD value of 0.251 seem s very sm all, it is important to note that the external edges hugely dominate the data , suc h that the internal edge s are just 2.4% of the total. This can make da ta wit h poorly r esol ves an y int erna l edge s see m very t ree l ike by the g%S D stat istic (Waddell et al. 200 7) . If the g%SD is s caled in p roportio n to just the inte rnal ed ge w eights, then the ig%SD rises to 10.3% ( or 14.1% in the reduced bias form , Wadd ell et al. 2011 ) , taking into account the num ber of fitted parameters. T his is not nearly as tree like as w ould be expected for so many sites scattered across the genome. Anothe r potent ially usef ul way to vie w this data is with Neigh borNe t ( Bryan t and Moul ton 200 4) co mbined w ith residual resampling (Wa ddell e t al. 2011 ) . The resultin g labeled Neighb orNet is shown in f igure 1 b. The data is , at a first gla nce f airly tre e - like, a lthough there a re alternative splits showing up. The fit to a planner networ k is g%SD = 0.0769 , wh ich corrected for fitted parameters inc reases to 0.166%. Further, the sum of internal edge wei ghts is 2.6% of the total weigh t, so ig%S D ta king into ac count fitted p aramete rs, is eq ual to 6.32% . This is a considerable improvement over a tree. This improvement in fit can also be queried using informatio n statistic s (W addell et al. 2011) . The planne r Neigh borNet graph beats the bifurcating tree by 47.2 AIC units and by 35.2 BIC units. However, since the number of paramet ers (s p lits = 22) in the NeighborNet is approaching the num ber of distances, 28, the AICc measure sever e ly penalizes it and it ends u p 129.2 AICc units worse than the bifurcating tree. H oweve r, if we were to drop either the Neighbo rNet edges with less then 5 0% residu al resampling support (fig ure 1 d ) or filter all edges wit h a length of less than 0.00 03 ( figure 1 d , except that the split DNP is r etai ned in place of YFH ) , then the Neig hborN et comes back to about eq ual with the tree in AICc units . Thus, unlike the example in W addell et al. (2010) com paring the NeighborNet and t ree of genetic distances t o trace the origins of Je wish populatio ns, a Neighbo rNet can be favored over a tree. Equal ly impo rtant , and unlike Wadde ll et al. (2010 ) , in the f ace of the com petitive nature of residual resampling (w hich is ne cessary with such com plex model selection ), ma ny o f the Neighb orNet splits hav e grea ter th an 50% s upport (figure 1b and c ) . T he mo st strongly suppo rted split that is n ot com patible w ith the tree is th e grouping of Han + French with 88.5 % suppor t at P = 1 . This grouping is r epresen ted by a relative ly short alterna tive split, with weight (l ength) of 0.0017 . By contr ast, the weighti est internal split separating mode rn h umans fro m all oth er s has length 0.014, while th e ex ternal edges to hu man sequences are around 0.11 (based o n th e sc aled distance matrix in the appendix of R eich et al. 2010, where the Chimp -S an distance is 1). This split may be real as, to date, it is unclear exactly how to recon struct the deeper genetic origins of Chinese (some thing we wil l con sider furt her b elow). Other well supported splits t hat conflict with the tree are P apuan with Chi mp + Neander thal + Deniso va having 83.2 % supp ort (we ig ht 0.0010) and a split of Denisova with Chimp having 87.3 % (0.0010) (fig ure 1b and 1c ) . While it is unclear exac tly what is causing these, one interp retation might b e that Denisova is harb oring some more “primitive” alleles than Neander thal. That would be possibl e if the Deniso vans ha d incor porated alle les from an even earlier out of Africa radiat ion, such as Ho mo erect us . The antiquity o f som e Papuan alleles in particular seems to be sugge st ed by the split with Ch imp + Denis ova + Neande rtha l. Aspects of this sp lit are sug gested by mix ing of Papuans with Neand ertha ls (somethin g share d with other non - Africa n moder n humans ) and with a Denisovan relat ive (Reich et al. 2010). However, the Waddel l , Ramos and Xi (2011). S pectral An alysis of H omo den isova and relatives Page 8 Chimp being included in the split seems n ew and may also suggest the introgression of Homo erectus - like alleles particularly into Papuans . On e interestin g aspect of the se splits is that they a re both more than five times the le ngth of the Han + Frenc h split ( at ~0.0017 versus 0. 0010 ) Figure 1. Fit ting flexi - wei ghted least squar es tre es and Ne ighbor Nets t o the s ite pa tter n frequ ency spectrum. (a) The flexi weighted least squares tree b ased on H ammin g p - distances, with P = 1. A ll edges have residual resamp ling support of 100% except for the Han + Papuan spli t, which has support of 85%. The g%SD value (uncorrecte d for the fitted paramet ers) is 0.251% and correct ed for fitted para meters is 0.336%. (b) The weighted NeighborNet with resampling support values (shown) estimated with P = 0. The g%SD value is 0.0769% and 0.154% corrected. All external edges except for chimp have been shrunk by a factor of 100, while the edge to chimp is sh runk by a factor o f 1000 to improve viewability (the unsca led external edges a re v ery similar to those of the tree in (a)). (c) The unweighted NeighborN et (YF split filtered out) and (d) The unweighted NeighborN et filtered to show on ly edg es w ith g reater than 50% residual resamp ling support. Sw itching to P = 1, yie lds the sa me netw o rk, but residua l support values generally increase, that is HP:99.7%, HF:88.5, (CD) = NSYFHP:87.3, SYFH :83.2, N FHP:64.2, YFH:63.8, DNP:48. 1, (CS ) = DNYF HP:46.6 , YF: 39 and DNPH:34. 7, wi th a ll ot her edge s upport sta ying a t 100 . Other spl its ar e no t so well supported, but do appear in more than 50% of replicates. These include a narrow (0.00013) split of Han + French + Yoruba from all others, with 63.8% support. Whether this might reflect migration of the last 30,000 years amongst the more accessible parts o f the world is unclear. The split of Neanderthal with all the out of African moder ns has a length of 0. 0005 and support of 64.2%, and at least in its exist ence, is consi stent Waddel l , Ramos and Xi (2011). S pectral An alysis of H omo den isova and relatives Page 9 wit h Rei ch et al. ’s (2010) anal yses. Finally, there appear a number of splits wit h between 40 and 50% support. One of these is the split of Neand erthal + Deniso va + Papuan, that woul d be antici pated from the work of Reich et al. (2010) with a le ngth of 0.00 0 35 and support of 48.1 %. Ther e is also a spli t of San + Chimp with 46.6 % sup por t but a very low weight of 0. 0001 . A split of DNHP receiv es suppo rt of 34.7% and a low weight of 0. 000 17. Finall y, there is a very weak split of French + Yoruba with a length of 0.00004 and support of 39 %. Such a weak spl it is p ossibl y below the level of s equencing/assem bly error in this data. The San + Chimp split is also, to a fair extent , compatible with sequencin g er ror due t o its simple pairwise st ructure and l ow weight . Overal l, one of t he most sur pris ing featur es of the pl anne r N eighborNe t model is that it does not reverse the positions of Neanderthal and Denisova, so that Papuan could have a unique split with the D enisovan (as R eich et al. 2010 suggest the Papuan lineage received ~5 % o f its genes from that lineage ). As we w ill see later, the appare n t re ason for this w ould seem to b e th at the d istance from D enisova to Chim p is m ore strongly und erestima ted th an that from Denis ova to Papuan . The unde restima tion of the Denisova to Chimp distan ce could be due to Denisova harboring some very archaic allele s, or it c ould be sequencing error . T hat is, it might be direct convergence of Denisova to Chimp due to sequenc ing errors on the Deni sova lin eage . However , Denis ova is repute d to have a parti cularly low seque ncing error rate (Reich et al. 2010). It might a lternative ly be all the other genom es havin g a mu ch highe r sequen cing erro r rate than Deniso va, although if these are occu rring independently and at a low rate, their main effect should be to simply extend the terminal edge length to each of these tax a. Al l in all, the Ne ighborN et an alysis clearly sugge sts tha t there is consid erable structure in the res iduals of the data fitted to a tree, that is clearly depict able with a pla nne r graph. Th is is n ot to say that th e rem aining residual is ne gligible, b ut it d oes clearly suggest that m ore than a single species tree. This applies even to a d istance based “ species” tree , wh ich can, in theory and simulations (unpu blished data) adequately represent a hierarchically structured coalescent model, from which these da ta would a priori , be expected to come from. 3.2 The li kelih ood sur face o f mult iple phyloge netic/ populat ion g enetic spect ra The counts of the different types of site substitution pattern (the f vectors) define a proportional sequen ce site pattern ( s ) vector for each chromo some (W addell et al. 199 4). If each site pattern is sam pled independently, then the f vector for each chromo some is a multinomia l l y distributed , while the s vector has a scaled multinomial distri bution . In turn, if these vectors are lined u p against each other and indexed by the region they come from, then they jointly have a multi nomial di str ibut ion when sampl ed i ndepe ndent ly. Unde r the infinite sites m odel, th ere is a natural and perfec t correspondence between the bipartition patterns and the spectrum of the potential edges of all possible trees. Thus, the likelihood surface of the collective tree edge spac e (or more generally, the ! vector , Hendy and Pe nny 1993 ) is that o f the s vector. Deviat ions i n this space may be meas ured with a like li hood ratio s tatistic (such as G 2 or the Kulback - Leibler distance measure) or it can be cl osely approximated with the X 2 deviance distance statistic (which has the advantage of intuitive interpr etability since each cell has an asymptotic ! 1 2 distributi on under s tandard assump tions). As we move away from the infinite sites m odel due to an increasing probability of there being more than one change of character state per site , there is a g radual b reak do wn of th is approximation of the likelihood surface. The rate a t which this appro ximation breaks d own c an be much redu ced if a Hadama rd conj ugati on (Hen dy and Penny 19 93) is perfor med (W addell 1995) , or, with more speed but less accuracy , conjugation approximations of Steel and Waddell (1998) may be used. The exact re lation ship requires the inte gration over co ntinuously v ariable (gene tree edge lengths and site rates) and d iscontinuous (tree topology and coalescent history) space, w hich Waddel l , Ramos and Xi (2011). S pectral An alysis of H omo den isova and relatives Page 10 is currently no t practical in an y exact form . Of course, appr oxima te numerica l inte gr ation with metho ds su ch as Markov Chai n Monte Carl o is also available, but often preclude a direct intuitive understanding of what is going on . Howev er, these too can break do wn wh en the likelih ood function itself is too complicated to estimate, necessit ating approximate Bayesian chain or ABC type appro aches . Comparis on of t he s vectors for different chromosomes with a X 2 or K L st atistic is a useful metric for detecting anom alies from the assumed i.i.d model (Wa ddell 1 995) . To fac ilitate this, it is useful to visu alize the resulting full pa irwise “distance” matrice s between chromosomes with clust erin g or with mu lti - dimensional scaling. Pref erably, both are done with t he same measu res of fit so tha t th e re sult s may be direct ly compar ed i n a likel ihood , AI C o r BIC framework ( Wadde ll et al. 20 10 ). By good fortune, a X 2 space (which may be thought of as a weighted Eu cli dean space) can also be analyzed w ith C orresponden ce Analysis (e. g., Gree nacre 2007 ). This allows the interrelations hip of th e rows a nd the c olumn s of suc h a space to be explored and cont rasted w ith i.i.d assumption s . Here we use all these approa ches to exp lore this inter esti ng data set, to assess previous hypotheses and consider novel ones, and as important preparation for more explicit phylogeneti c/populati on genetic models. 3.3 Mode l f ree e xplor ati on of th e d ata wi th cl uster ing First calculate d is the pairw ise X 2 contingency - table statistic (or distance) between all pairs of ˆ s chromosomal vectors for all the site pattern vectors from Reich et al. (2010). Asympto tica lly (as the numb er of site patterns observed or the sequence leng th c ! " ), and given i.i.d. assumptions, if the two vect ors are samples from the same tr ue parameters, the X 2 statistic should converge to a ! 2 distributi on with degrees of freedo m equal to the number of site patterns, minu s the n umber of estimated parameters. In this case, we start by considering all possible bipartitions, therefore our number of site patterns is 2 t -1 (where t is the numbe r of sequences being considered ) per seque nce, which in this case is 2 7 – 1 = 127 indepen dent p atterns so there are 254 patterns in total (since two sequences are being compared). The number of estimated parameters is the row averages (les s o ne) of which there are a lso 127. Thus the deg rees of fre edom are equal to 12 7 , or m ore gener ally n - 1, where n is th e number of patterns . This is effectively a two - vector test of hom ogeneity (e.g., Agresti 1990) . Wit h th is type of data it is important to examine carefully a num ber of subdivisi ons of the data. In terms of sequence site patterns, two prominent subdivis ions are to first ignore the constant sites and secondly to ignore the singletons as w ell, leaving just the p arsimony informativ e sites (e.g. , Hendy and Penn y 199 3). Ignori ng the cons tant si te patt erns adjusts for a potentially powerful scalar e ffect of the overall rate of ev olution on a chromosome. Ign oring the singletons, or site patterns w ith just one sequence different to all others leaves just the bipartitions corresponding to all possible inte rnal edges in the tree o r network linking the sequences. The singleton counts are particularly susceptible to sequencing errors . In this data, the true sign al is of a similar magnitude to the sequencing error signal according to the supplementary material of Reich et al. ( 2010 ). Here it is reported that a transversio n per site occurs at a frequency of ~10 -4 in the hum an seque nces, which is roughly the same size sequencing error rate in many of th ese sequences . Independent sequen cing errors h ave a p roportio nately greatest impact on singletons, followed by the sim plest in formative site patterns, such as two different from all the others, and less eff ect on com plex p atterns such as four d ifferent to all th e othe rs. In terms o f the genomic blocks, we treat the random blocks diff erently to the remainder of th eir c hromosom e, since they are m ore poorly localized. In addition, Chromosome X is typically fou nd in two copies in a female, bu t only one in a male, w hich giv es it an effective population size of only 75% th at of the autosomes if the eff ective pop ulation size of males and fem ales is equa l . Waddel l , Ramos and Xi (2011). S pectral An alysis of H omo den isova and relatives Page 11 It is also important to bear in mind the samp le size when assessing convergence to asymptotic conditions for the statistic or distance . A general rule of thum b is that a s long as 75% of all expected entries in a comparison of f vectors are equal to or greater than 5, and no expected values are less than 1, a reasonable approximation holds. To facilitate use of this rule, we re port the expe cted values i n each c ompari son. A n example of visualizing the clustering of site pattern vectors is g iven in figu re 2 using Neighb orNet and NJ . Notice th at th e ge neral impression is very similar. T he o utliers include the identity pattern , the singleton to ch imp (DNY SFH P), and a se lection of patterns that may be linked to relatively rece nt inter breeding. Th ese include NP , DNP, D P, and NH. The pattern NYSFHP is also particularly uneven across autosomes, which is inte rest ing since it is the pattern that would mos t obvi ousl y mark gene flow fr om H. erectus to the H. denis ova lineag e , w hich is not so recent . When th e X ch romo some is added in, th e same patte rns appea r as outl ier s, whi le removing constant sites and singleto ns, the outliers remain the in formative patterns mentioned earlier in this paragraph (with or withou t X included ). When fi tting an least squ ares tre e with P = 0 the resid ual e rror reported was su rprisingly large, which cautions us corroborat e the observations above in other ways. Figure 2 . Visualizi ng t he heterogeneity of site patterns based on the pairwise X 2 distance between their frequencies across autosome chromosomes. (a ) Using Neigh borNet in S plits T ree 4 with a reported fit of 0.8035 (b) Using Neighbo r J oining with a reported fit of 0.8092 . Note, the fit reported by splits tree is the percentage of all variance in the data explained (see Waddell et al. 2007 describing how t his related to %S D me asures). The flexi - weight ed lea st squa res tr ee wit h P = 0 tree is broadl y similar but reports and a g%SD fit of 87.4 % which is not terribly good . The expected X 2 asymptotic dista nce between a pair of site patterns if there are no dif ferences in thei r true frequenci es across chromosomes is 22 in this c ase. The scale bar indicates a distance of 10 units . In the electron ic version it is possible to zoom in several times to view these plots in detail . A useful featur e of the pairwis e dista nces betwee n site pattern vectors is that objects for which the dist ance is being measur ed can be included or excluded from the visualization analysis simply by removing them. W ith other diagnostics used he rein, such as de viation from the global X 2 Waddel l , Ramos and Xi (2011). S pectral An alysis of H omo den isova and relatives Page 12 average (equals the e xpected values under independence), then the analysis typically need s to b e rerun from the exact initial data matrix (for example, with corresponden c e analysis ). 3.4 Gaugin g t he e ffec t of linkag e A nother useful feature of the X 2 statistic is its relatively simp le asymptotic relationship to the number of indep endent objects be ing sampled . F or examp le, if we wer e to halve the effective number of inde pendent random samples by automaticall y choosing two of an object (rather than 1), then the va riance of the o bserved count per cell w ould basically double. If this logic is coupled with the biological knowledg e tha t, no matter how de viant the mating beh avi or, the assortm ent of ch romoso mes from the mo ther and th e father is ra ndom, th en it allow s a direct estimate of the scale of variance increase due to linkage. Also bundled with this vari ance will be presently unm odelable factors such as spec ific instances of selection, so these statistics w ill also give an upper bound estimate of the potential size of these factors on overall fit . Such an estimate on the expected precision measure d by fit statistics is very useful when used in a quasi - likelihood framework. The visualiza tion in figure 3 a is based on pairwise X 2 distance between rows (chromosom es) of the original joint tab le . It can be seen that c hromos ome X and ch romoso me 16 appear to the tw o m ost marked outliers . Much o f this is due to the e ffect of con stant sites, wh ich are heavily influenced by the average rate of subs t itution . Rem oving this site pattern , chromosome X appears to be th e only marked ou tlier (result n ot shown) . Finally , after removing the singleton site pa tterns as well , figure 3 b shows the results based on just the parsimony infor mative sit e pat terns. The t rees in this fi gure are not to s cale and t he averag e distan ce between chromosomes is hugely reduced. Here we see that chromos ome X appears the only real outl ier and it is not nearly as pronou nced as previously. In addition, the fit of the distances to a tree is far better with a g%SD of 8.6%. Figure 3 . Vis ualizing the heterogeneity of chro mosomes based on the X 2 distance between their pairwise frequencies across site patterns. (a) Using a ll site patterns the N J tree has a reported fit o f 0.8348 (b) Using j ust the informative site patterns the fit im proves to 0.9346 . When fitti ng with least s quares P = 0, the tree (not shown) is nearly iden tical to the NJ tree of figure 3 b and the average geometric percent standard deviation has dr opped to 8.6%. Overal l, the t ree of figu re 2b i s not that far from a star tree . In a ddit ion, it i s usef ul to note that th e tw o arm s of chro mosom e 2 (which are two sepa r ate chromosom es in the chimp) are not particularl y close to each other, sugges ting they may be f unctional as independe nt as most chromosomes. If we tak e all the random block s and add them together they approa ch the 75% rule for asymptotic approxim ation discussed below. When they are added into the visualization shown in figure 2 they appear very no rmal, that is, they are near the midpoint of the tree without a Waddel l , Ramos and Xi (2011). S pectral An alysis of H omo den isova and relatives Page 13 long e xternal edge. Ho wever, later, we see that whe n ana lyzed with corre sponden ce ana lysis, while the y have a very low in ertia , the y do appear to have high inertia on the firs t two axes, and appear deficient in patterns close to the species tree but enriched in patterns far from either the species tree or probab le major introgressions. Th is might be a sign that they are derived from an increased proportion of re ads that d o not c orrectly alig n to their homologues and w e generally discard them f rom analyses (t hey comprise less than 1% of al l the data) . Figure 4 shows the result of m easuring the fluctuations of inform ative pattern frequencies with th e X 2 distance of each chromosom e against the ir global average across all chromosomes (which is the same as the expected values based on a global multi nomial i.i. d. model ). This is the same as look ing at the marginal column sums of the X 2 statistic in an n x m contingency table test of in depende nce, where columns are chrom osomes and rows are the site patterns. In the language of Correspondenc e Analy sis, conside red below, these are the total inertias of each column of the original data table (which are the X 2 col umn sums renormalized t o sum to 1000) . Figure 4. A histogram of the distance of each chromosome to the global average of s ite pattern frequencies weighted assuming indepe ndence (proportional to inertia). The blue line is the result of fitting a smoothed curve based on a normal distribution k ernel density, while the green and red lines are the shapes of a non - central and a scaled chi - square distribution, respectively. Except for the outlying ch romosome X that is at the far rig ht, the chi - square distributi ons offer a modest approximation to what is observed. If site patterns were i.i.d. across chromosomes then the expected value would be total site patterns (128) minus constant columns (1) minus singletons (8) m inus 1 degree of freedom = 118. The actual mea n (excluding X) is closer to 155, so ~ 30% bigger than expected under indep endence . The orderin g of chromosomes from left to right is 7, 21, 10 , 17, 6 , 1, 15, 19, 12, 16, 4, 3, 13, 18, 2b, 5, 1 1, 14, 2 2, 20, 9 , 2a, 8 and X. Removing chromosome X makes almo st no difference to the rank or relative inertia of the autosomes, as might be exp ected as X is a low mass or count chromo some (here mass refer s to the number of informa tive site patterns recorded from it, not its physical size). It is also p ossible to lo ok at the row sums, which record the fluctuation of the frequency X 2 Waddel l , Ramos and Xi (2011). S pectral An alysis of H omo den isova and relatives Page 14 of each informative si te pattern acr oss chromosomes. Figure 5 shows such plots. There are clearly a number of outliers, and these are the same ones identified in the pairwise statistics of t he previous section. That is what we will call the D enisova / H. erectus pattern, plus the NP, DN P, NH, DP patt erns. All th ese pat tern s would see m to be assoc iat ed with pot ential in trogr ession events. In that regard, it is interesting that D NP ap pears as hig h on the list as DP, perhaps due to the Deni sovan lineage that intr ogres se d into Papuans being a distant relative of the sequenced Denis ovan and not being particularl y co alesced for the patterns found in that individual. These are followed by the HP patter n, which is intriguing, as this may be due to the recent (past few thousand years) introgression of Austro ne sian genes from East A sia into Papuans, or simply due to this bein g the las t split in the species tree. It is intrig uing tha t these pa tterns retain their iner tial ranking w ith or without chromoso me X included. This m ay be a reflectio n of their overall higher standard deviation due to being gen erated b y relatively recent events (which, with the exception of the D / H. erectus pattern, would all seem to be less than 60,000 years befor e present ) while the coalescences generating m ost other patterns are m uch older on average and have had much more time to u nlink fro m each other. O ther patte rns logica lly associa ted with the hypo thesized Neander thal / out of Africa popul ati on , which inclu de NF, NFP, NFHP , coincide with what may be a second mode in the distribution of figure 5 . It is un clear wh y the other s pecies tree p atterns, including SYFH P, YF HP, D N, and finally, FH P, all app ear high in the inertia list (with or without X included) , alth ough these a re pre domin antly g enerate d by more recen t coale scence s, and hence it may be a n expecte d linkage effect incre asing their v ariance acr oss chrom o so mes . Figure 5. A plot of mass versus in ertia for the chromosomes . All the chromosomes except 19, 21, 22 and X easily m eet the 75 % g reater than or equal to 5 and none less than 1 ex pected value rule for approximating the asymptotic properties of the statistic. Chromosome 19 has 26% of values below 5, but not less than 1 , while 21 has 29%, 22 has 39 %, and X has 24% . Only X is an outlier . We hav e ment ioned the D / H. erectus pattern (NSYFH P) as sho wing high deviance and inertia. There are two oth er p atterns that might readily ref lect a n e arlier out of A frica mixi ng with even m ore archaic hominids such as H. erectu s . Th ese are N / H. erectu s (D SYFHP ) and DN / H. erectus (SYFHP). The last one is also a species tree pattern, while the former two are only 1 coalescent event shy of it. It is interesting to note that two of the se patterns do show very high inertia (NSYFHP and SY FHP) w hile the third o ne is in the middle of pac k in this regard . Also confusing this interpretation at present is the fact that while D enisova has a sequencing error rate that appea rs very low (as low or lower th an the modern hu man s eque nce s used according to tables in the supple mentary material of R eich et al. 2010 ), Neand erthal sequen ce has spotty coverage and an apparently high sequencing error rate. Neanderthal flick er ing off and on , re spect ively , in a background of common DNSYFHP and SYFHP patt erns coul d be a cause. H owever, other patterns readily generated in this way, such as NY or NS do not show high inerti a at all, in fact they are be low ave rage). Overal l, then , the cons tant si te pattern and the s ingleton s have very high mass and high 0 10 20 30 40 50 60 70 80 0 10 20 30 40 50 60 70 80 90 Inertia Mass Mass versus Inertia X 2 Waddel l , Ramos and Xi (2011). S pectral An alysis of H omo den isova and relatives Page 15 inertia, patterns related to the introgressions propo sed by Reich et al. (20 10) generally have low mass and hig h inert ia, while patt erns on the speci es tree tend to have int ermediat e mass and ofte n high inertia. Howe ver, in terms of inertia per unit of mass, doubling th e m ass should increase the in ertia by a factor of two, tri pling the mass by a factor of three and so on. On this scale the singletons have low in ertia per unit mass . The patterns related to hypoth esized introgression events tend to have very high inertia per unit of mass, while the patterns coinciding with the species tree are intermediate. Figure 6 (a) . H istogram of the X 2 statistic for each site pattern on each chromosome against the g lobal frequency (p roportional to the inertia of rows in this case) for all c hromosom es includin g X . (b) As in (a) but excluding chromosome X. The blue line is the result of fitting a smoothed curve based on a normal distribution kernel density , while the gre en and red lin es are the shapes of a non - central and a scaled chi - square distribution , respectiv ely. If site pa tterns were i.i.d. acro ss chromos omes then the ex pected value would be 23 i n (a) and 22 in (b). The actual mean values are ~30% bigger than expected under inde pendence. The ordering of site patterns from left to right is DSYH, DNSY P, DF H, D YP, D NFH, YH, SF, NYFH P, NSYH P, DYH , DSF, DSFP, DNYH, DNYFH, DNSHP, DNSFP, DNSFHP, DNSY, DNSYF, SP, SFH, NHP, NFH , NYH, NYFH, NS, NSF, NSYFP, DFHP, DYHP, DYFHP, DSHP, DSFH, DS YF, DNFP, DNYP, DNYFP, DNS, DNSP, DNSYH, SFHP, SY, SYH, NY, NYHP, NYFP, NSH, NSHP, NSFP, NSYP, NSYFH, DH, DFP, DYFP, DYFH, DS, DSYP, DSYFHP, DNYHP, DNYFHP, DNSH, DNSYFP, DNSYFH, FP, YP, YF, YFH, SFP, SYHP, NSFH, NSYH, DSH, DSYFP, DSYFH, DNHP, DNY, YHP, SYP , SYFP, NYF, NSYF, DHP, DSFHP , DSYHP, DNYF, DNS FH, FHP, SH, SHP, SYFH, NF, NFP, NFHP, NYP, NSFHP, DF, DY, DYF, DNF, FH, YFP, NSP, DSP, DSY, DNH, DNFHP, DNSYHP, YFHP, NSY, DN, DNSF, SYF, SYFHP, HP, DP, NH, DNP, NP, and fin ally, NSYFHP. Removing chr omosome X makes almo st no diff erenc e to the rank or relati ve inert ia of the site patt erns; the most not iceab le diff erence being that the “erect us” pattern now has second highest inertia across the chromosom es. The vectors used all meet the 75% rul e for asymptotic c onvergence . Table 1 show s a different w ay of assessing the imp act of linkage and erratic selection on any overall fit statistic. Here all chromosomes are rando mly assigned to two nearly equally sized se ts. This half and half approach should provide a rob ust estimate the X 2 statistic s mean and variance between the data and a m odel prediction. Note that the relative proportion of constant sites is implied to fluctuate betw een chromo somes, as is the propo rtion of singletons. Th e extent o f this d eviation in relation to the informative sites is exa ggerated by the fac t that only 0.043% o f sites are informative, and only 0.491% of si tes are non - constant. Waddel l , Ramos and Xi (2011). S pectral An alysis of H omo den isova and relatives Page 16 Table 1 . Th e statistic between randomly split sets of chromosomes (based on 10,000 repl icates, with Chr2a a nd 2b f used). The first n umber in each cell is the mean v alue an d the second the st andard deviat ion. Autosome s Autosome s + X Autosome s + Ra ndom All s ites 334.2561 (171.0058) 342.4778 (181.8389) 333.0322 (170.8260) Minus Ident ity 233 .4396 (65.2 967) 238.5651 (67.9386) 233.7334 (66.2594) Informative On ly 163.4504 (26. 0422) 165.8860 ( 26.8971 ) 162.8040 (26.4666) This approach to asses sing infla ted X 2 values should have som e robustness in suggesting the cau se is lin kage a nd not something more localized. For exam ple, if the deviation w as caused by just one cell (that is, one type of pattern in one chromosome), then the chromosom e w ith this cell should appear as an outlier in figu re 4 , wh ile the site patter n should als o appear as an outlier in the row sum p lot of figure 6 . Corres pondence analysis , applied below, is ideal for visuali zing such associations. The degree of inflation we infer here is around 1.35. This amount is neither excessively large nor sm a ll, b ut it does give us a good g uide to how well w e could hope to m odel this d ata w ith s pectral species - tree coalesce nt m ethods that do not explicitly mo del re combin ation events (or any other method that ignores recombination events). In futur e it m ay be useful to further d iagno se this overdispersion by looking in close detail at where specific patterns m ay be linked in the genom e . Obviousl y, the exte nt of overdi spersion coul d ris e sub stan tial ly with new data , as the present data set sa mples on ly 3 0 0 million sites or 146,019 info rmative sites , wh ich will on averag e be appro ximat ely 25000 bases apart. If the amount of data rose 5 fold, then the average informative site would be only 5kb apart, which is much closer. How rapidly evidence of linkage rises by this gross statis tic will depend on how factors such as recombination hotspots are scattered across the genome and how they h ave shifted throug h time in different populations , plus the age of th e differen t haplotyp es that spec ifically gene rate particula r site patterns . 3.5 Corres pondence analys is The result of applying correspond ence analysis to the autosomal plus X infor mative si te patterns is show in figures 7 and 8. While the four axes in these two plots show only 20 % then 34.7 % of the total iner tia , the previous anal yses suggest that random nois e due to fairly low levels of linkage ma y ex plain much of the rem aining deviatio ns from an i.i.d. multin omial model. T here may also should be some biological effect due to the lower effective population size of chromosome X, and this t oo can be checked for. However, it is intere stin g that the normal ized inertia of th e species tree p atterns shows alm ost no change when the autosom es are c onsidered alone without X (68 versus 67) , sugges ting that the sm aller effective popu lation size of X i s n ot having a very s trong effect on variance of patterns . Since X is an outli er, thi s suggest s it may have more to do wi th its spe cif ic sex - linked prope rties The first two axes are defined predominantly by chromosome X and 8, with les ser contributions b y chromosomes 20 and 12. The speci es tree patterns show up prominent ly, but while one is drawn towards X (YFHP), with anothe r two being drawn very slig htly towards X (DN and FHP) and the remainder (SYFHP and HP) are being drawn more stron gly towards chromo some 8 and they are decreased in X relative to the autosomal average. Anot her point is that the Neandert hal patterns for out of Africa are deficient on chromosome 8, while a Neander thal plus SY patt ern (not as sociated with any speci fic event as yet) is enr iched on 8 . Finally, the DP pattern and the D / H. erectus pattern are both deficient on X i n particul ar. The decrease in frequency of the DP patter n on X, particularly when compared to the N P pattern (which is near autosomal average frequ ency on X) sugges ts the possibility of asymmetric gene flow in this introgre ssion e vent. I f so, it w ould seem that th is m ight be mo st read ily exp lained by greater survival and reproduction of the offs pring of Denisov a m ales impre gnat ing the moder n human female ancestors of Papuans rather than the other way around . X 2 Waddel l , Ramos and Xi (2011). S pectral An alysis of H omo den isova and relatives Page 17 Figure 7 . The first tw o dime nsions of the correspondence analysis applied to the informative site patterns of all chromosomes (not including the random blocks). The first dimension explains 11.6% and the second 8.4% of the total variance (inertia). In these and subsequ ent plots the co lor coding r ed is for a species tree pattern, orange, a pattern that can be generated by missing one coalescence on the species tree, yellow, a pattern that can be generated by missing two coalescences on the species tree, dark green a pattern readily generated by int rogress ion o f ou t of Africa modern with a Neandert hal African ( e.g., NP, NH, or NF) , lig ht green, as previousl y but shared by more than 1 modern , blue, a pat tern readily expl ained by introgressi on of a member of the Den isova lineage with Papuans (DP and DN P), while violet might be leftovers of a previous out of Africa, which could be Denisova or Neanderthal ancestors meeting H. erectus (patterns NSYFHP or DSYFHP; the thir d pattern SYFHP is cryptic since it is also a specie s tree pattern). Chromosomes are ma rked by purple triangles. Labels and symbols are sca led according to th eir mass, while the nam e is followe d by unders core th en the quality of a point round ed to the n earest in teger in the range of 0 to 10. O nly objects with a quality of 3 or above (thus th e diagram represents at least ¼ of their total inertia) are show n to reduce clutter and hop efully focus on the most salie nt results . Excess of the pa ttern NSYFHP over DSYFHP is consistent wit h a “Denisova / H. ere ctus ” interbreeding. This hypothesis is Waddel l , Ramos and Xi (2011). S pectral An alysis of H omo den isova and relatives Page 18 sup ported to some degree by the mtDNA evidence (e.g. Krause et al. 2010, although somewhat dismiss ed by Durand and Slat kin in Reich et al. 2010). Furthe r, the pat tern DSYFHP is more readil y generat ed by convergence of N eanderthal t o Chimp via a sequencing error, by a factor of nearly 4 to 1 according to the error estimates in table S10.3 o f Reic h et al (2010) . On the other hand, a p attern such as NSYFH P is m ore likely than DS YFHP du e to Neander thals mixing w ith out of Africa peo ple (although the observed ratio is slightly larger at 1.17 that of NFH P to DFH P at 1.09) . Diff usion of Neander thal ge nes int o Africa in addition, might also help to explain this imbalance. Inferring the relev ance of suc h an outlying pattern , such as NSYFHP , re quires deta iled mod eling of mixed hierarchical coalescent scenarios, w hich is attempted in later sections. Figure 8 . As for figure * but the third a nd f ourth dimensio ns ar e sho wn, which, respec tively, explain 7.7% and 7.0% of the total inerti a. Whil e th e ori gin of the unusual features of the NSY FHP patte rn is just a hypothesis at this stag e, it is te stable and deserve s a nam e, so we call it the “ Ron Jeremy hypothesis ” (after the accomplished A merican thespian Ron Jeremy, wh o is adro it a t debauching modern young women, whose f athe r ’ s mig ht well call him a Neanderthal or a Den isov an , and who loo ks remarkably like reco nstructions of these archaic hu mans in museu ms, including being ve ry big boned ). Supportin g the hypothesis that this was an asymmetrical matin g event is the finding that Waddel l , Ramos and Xi (2011). S pectral An alysis of H omo den isova and relatives Page 19 the recombin ation rate on X is similar to that on other chromosom es , so its intrinsic varian ce should be no higher ( Jensen - Seaman et al. 2004). Combined with th e fact that the density of marke rs (si te patt erns) on X is consid era bl y lower than that on the autosomes (at least partly due to its lower mutatio n rate), it se ems probable that the ge neral lin kage disequilibrium between site patterns on X is lower than on most autosomes. Similarly, we may refer to t he low frequency of the NSYFHP on th e X chromosome as “Ron’s Grandfa ther hypothe sis” which is the mixi ng of the Denis ovan linea ge with a n even m ore ancie nt homin id lineage d ue to a m ale biased in fusion. On the third and fourth axes (figure 8) there is no genera l theme of partic ular types of pattern emerging as there was in axes 1 and 2. There are a few scattered implications, such that the patter n NP i s parti cularly enriched on chromosome 9, but nothi ng su ggest ing a gener al pattern. 3.6 Fitting the f ull s pectrum to a species - tre e with coalescen ce model Her e we expand on the type of paramet ric spectr al fitting ini tiat ed in Wadd ell (1995) based on the calculations of Hudson (1992). The key point, as discussed elsewhere herein, is to calculate the total length of all b i partitions induced by all possible gene trees. More colloquially, in Hadam ard parlance, it would be to calculate th e expe cted ed ge leng th spe ctrum. Under th e infinite sites m odel and assuming random mutations and recom bination falling away with some fixed fu nction of distance , the sequenc e s pectrum is exp ected to conve rge to the edge length sp ectrum as c , the sequen ce length , goes to infi nity. In order to mak e these calculations it is necessary to find p opulations of ge ne trees for which we can calcula te t he expected edge lengths. To do this we break all gene trees down by the pattern of their coalescences , then by th eir shape, and, finally, if n eed be, by their h istory (that is, wh ich coalescence happened first, second, etc. ) . Fo r the case of a seven speci es rooted tree w ith the shape (C,((D,N),(S,(Y ,(F,(H,P)))))), the problem was set to an second year undergraduate in physics as a research credit exercise (see Ram os an d Waddell, arXiv article ) and the results implemented into an Excel spread sheet. Optimiz ation of parameter values used the robust numerical optimizer within Excel, which we have found to be generally reliable with the se ty pes of calcu lations in prev ious instances (e.g., W addell 199 5) , and best che cked by trying d ifferent rando m starting po int s . To check the accuracy of the results MS was set to the same parameters and run to produce millions of independ ent ge ne tree s. Res ulting in ternal edges were th en gathered together with a PERL script and represented as a binary inde xed vecto r following He ndy and Penny (1993). The complexit y of these calculati ons explode as a rather nasty exponential, so the complexity of the calculations is thousands of times larger than with a three or even four species tree. Comparing the resu lts with MS revealed a s eries o f mistak es in terms of w hich v alues w ere pu t into which cells o f the spreadsh eet. After refin ing these, there w ere still some differences, but on a percentage basis these are relatively small in all cases. To alleviate these erro rs w e instituted an it erative local correction metho d. The first choice to be made is which objective function to optimize (here m inimize) between the obs erved and the ex pected informative site pattern frequencies. T wo obvious cho ices are the G 2 likelihood ratio statistic (thereb y making a maximum likelihood estimate of the free parameters, namely g1 to g5 , which are tim e measured in generations divided by effective population size of the genes ) or alternatively the X 2 statistic. As in Wa ddell (1995) we will explore both and expect both to give very similar answers. For G 2 the minimum achiev ed was 3231.4 8 with param e ter s g1 to g5 taking value s of 0.028483, 0.173353, 0.094845, 0.348033 and 0.273664, respectively . For min imu m X 2 the optimal so lution was 0.026829, 0.171210, 0.092990, 0.342386, 0.266800 , resp ectively for g1 to g5 to ach ieve a n optimized X 2 statistic of 3473.97. For the X 2 statistic we then ran M S fo r 10 m illion samples at these p arameter setting s. The resulting predicted spectrum w as compared to the observed spectrum and the fit was indeed better, although not on all cells. Numerical error due to doing 10 million versus a larger num ber w as small Waddel l , Ramos and Xi (2011). S pectral An alysis of H omo den isova and relatives Page 20 (lat er estimated to have a variance of about 6 units) . A t this p oint a local co rrection to the value s being predicted by the spread sheet was made (by adding the difference of the MS v alu es to the predicted spectrum at the first set of optimal values). D oing th is the fit im proved from 3473.9 7 to 31 75.02 (we denote this augmented X 2 statistic X 2 ' ) . Next, we reoptim ized the free param e ters to find the new optimum with the locally corrected predicted values. This reduced X 2 ' to 3172.83 with parameter values 0.024947, 0.171766, 0.092427, 0.339571 and 0.266852. At these parameter values another MS simulation was run for 10 million samples and the sp ectrum again used to locally correct the values predicted by t he spreadsheet . R eoptimiz ing the fr ee parameter values according to the re - locally corrected spreadsheet values, w e arrive at the solution with X 2 '' = 3150.39’’ and parameter values of 0.025994, 0.171378, 0.092534, 0.339331 and 0.267358. Go ing one iteration further yields X 2 ''' with an optimized fit of 3152.53 and parameter values 0.027933444, 0.175100731, 0.095006025, 0.344262573 and 0.27306159. At this point there is convergence in the fit value with the tolera nce of 10 m il lion random replicates fro m MS , b ut the param eters are s till wanderin g somew hat. However, as we will see later, all estimat es are withi n 2 s.e. on the final round of iterat ion of their previo us cycles values. To check w hether there is a clear local attract or we st arted at a dif fere nt set of paramete r values. In this cas e, 0.1, 0.1, .1, 0.3 and 0.3 were used as the starti ng values and an MS prediction with 10 m illion replicates was m ade, then continued with the iteration sequence. The first cycle X 2 was 5077.75 and X 2 ' was 4852. 92. Opti mizin g with X 2 ' improve s the fit to 3 254.93 with paramet er values 0.024195, 0.172100, 0.091807, 0.339959 and 0.267993 for g1 to g5 (at this point the X 2 value was 3476.52). Updati ng with new MS predict ions an d o ptimizing with X 2 '' yie lded a minimum of 3130.76 with paramet ers of 0.0232710081, 0.1687159905, 0.0906498093, 0.3343395592 and 0.26127382 59. Optimi zing with X 2 ''' in turn gave a solution of 3149.55 with values of 0.0227709286, 0.1689006031, 0.0903369873, 0.3342731036 and 0.2606716073. Some of these are about 2 s.e. from their expected values, and it is probably partly due to the M S correction factor having a s .e. itse lf of abo ut 6 units (which w ith two different ran dom c orrection facto rs suggests a s.e. o f about 10 units between random starting points). Doing the same thing for G 2 with correc tion the M S co rrection term ba sed o n p arameter values of 0 .1, 0 .1, 0 .1, 0 .3, and 0 .3 (for g1 - g5) the optimiz ed G 2 ' was 2997.95 and parameter values were 0.026312, 0.174663, 0.093496, 0.345733 and 0.274174. Iterating aga in we arrive at G 2 '' = 2900.82 and parameter values of 0.0295613399, 0.1774256720, 0.0957332632. 0.3510034118 and 0.2794670139 . One more i tera tion with G 2 ''' had a minimum of 2911.69 and parameter values of 0.0276910902, 0.1745604708, 0.0936033294, 0.3455494590 and 0.2728650303. These paramet er values are al l very close to those found pr eviously with G 2 as the fit criter ion. As in Wadde ll and Azad (200 9) it i s usef ul to co nvert likel ihood s into root mean square percent standard deviations between data and expected values to give them both a geometric interpretation , and an intuitive feel for th e quality of the m odels predictions . For the X 2 statistic this is straightforward . In the cas e of the unite rated solutio n we hav e % SD [ X 2 ] = d . f . exp t i i = 1 N ! " # $ $ $ $ % & ' ' ' ' 0.5 1 d . f . (obs i ( exp t i ) 2 exp t i i = 1 N ! " # $ % & ' x 100% Eq(1) or 1 5.42% in the ca se of the first minimum X 2 model run above . The sum of percentage absolut e deviations is similar at 14.83%. If these data were perfectly multino mial we can calculate the expected deviation by no ting that the se cond su m, un de r th e model, is the exp ected value of the X^2 statistic, which in this case is Waddel l , Ramos and Xi (2011). S pectral An alysis of H omo den isova and relatives Page 21 119 - k ( k = 5 fit ted paramete rs) , so the who le second terms g oes to 1. Thus, with 146,019 sit es we w ould expect this number to be around 2.79 %, whil e if they foll owed our pre diction of the X 2 showing an inflation factor of arou nd 1.5 then we would expect around 3.42 %. Thus, worsen ing of the % SD by about 12% from its expected value might be caused by Neandert hal, Deni sova and perhaps even “ Ron’s grand father ” interbreedin g . Table 2. Fit of a single “species tree” hierarc hical coalescent model to the autosomal spectrum of informativ e characters sorted by cell - wise X 2 fit for the minim um X 2 model. The second set of values are those predicted by minimizing G 2 '' starti ng from the more distant parameter val ues. The colors correspond to the particular types of pattern emphasized in figure 7. Pattern Obs. Exp( X 2 ) X 2 Exp( G 2 '' ) X 2 Sign NH 1213 669 .3 441.6 650.7 485.8 1 NP 1172 669.3 377.5 647.7 424.4 1 NF 1165 698.3 311.8 684.6 337.1 1 FHP 5340 4197.6 310.9 4400.9 200.4 1 DP 1071 669.3 241.0 652.9 267.8 1 DNP 1116 824.7 102.9 787.6 137.0 1 SY 3862 3281.5 102.7 3454.1 48.2 1 DSYFHP 4069 4624. 7 66.8 4640.0 70.3 -1 SF 2432 2061.4 66.6 2155.3 35.5 1 YF 3141 2765.9 50.9 2805.3 40.2 1 DYFHP 866 1093.0 47.1 1074.0 40.3 -1 SYFH 1643 1389.5 46.2 1374.9 52.3 1 YFH 2064 1778.6 45.8 1827.0 30.7 1 DNYFP 413 563.8 40.3 547.6 33.1 -1 DFHP 513 673.2 3 8.1 619.2 18.2 -1 DSHP 218 329.5 37.8 311.0 27.8 -1 NSFP 204 310.0 36.2 292.1 26.6 -1 DYFP 245 355.3 34.2 324.0 19.3 -1 YFHP 4234 3873.4 33.6 3889.0 30.6 1 SYP 1014 1215.0 33.2 1223.7 35.9 -1 DYFH 241 346.3 32.0 326.5 22.4 -1 DNSYFH 1179 1013.8 26.9 990.9 35.7 1 DNSFHP 1866 1657.5 26.2 1646.4 29.3 1 NSHP 237 329.5 26.0 309.8 17.1 -1 YH 2912 2651.6 25.6 2682.8 19.6 1 SYFP 1204 1390.3 25.0 1377.5 21.9 -1 NYFHP 931 1093.0 24.0 1077.3 19.9 -1 DNSFH 402 512.3 23.7 528.1 30.1 -1 DNYFHP 2456 2227.2 2 3.5 2254.4 18.0 1 DYH 261 351.0 23.1 332.1 15.2 -1 DNSY 898 1052.4 22.7 999.6 10.3 -1 DN 11849 12374.3 22.3 12548.4 39.0 -1 NYFP 267 355.3 21.9 325.1 10.4 -1 FP 4601 4928.8 21.8 4930.8 22.1 -1 DSF 286 376.1 21.6 357.0 14.1 -1 DNS 1666 1860.2 20.3 1867.9 21.8 -1 Table 2 sorts the d eviance on a per pattern basis. Any cell with a d eviance of greater than 20 under the minimum X 2 criterion is show n (also shown are the w orst fit cells with G 2 , to s how they are gene rally the same) . T he ob served values o f the patterns N H, N P an d N F are all abou t twice as large as the mo del e xpects. This excess is consistent with the hypo thesis that N eanderth als m ixe d with the out of Africa peop le . In con trast, the value for FH P is als o markedly underes timat ed by the model . Waddel l , Ramos and Xi (2011). S pectral An alysis of H omo den isova and relatives Page 22 This may be direct consequ ence of the model shorten ing the species tree internod e FHP in order to better explain the high freque ncies of the afore mentioned patterns. The next two m ost devi ant patterns are those associated with the D enisova n mixing wi th Papu an ance stor s. Not e the hi gh frequency of the DNP pa ttern, which may be du e to the D enisovan relati ve s that mix ed no t b eing closely related to t he Denisovan sampled. It is intere sting to consider if the eviden ce sugge sts one mix ing of the ou r of Africa m oderns with Neandertha ls, or priva te mix ing fo r each of th e thr ee li neages . This is unclear, since the single species tree model is distorted and it is h ard to predict the exact frequencies expected. However, the shared p attern NF HP (not shown) has a deviance of 19.4 and is underrepresented by this model , w hile other mixing pa tterns s uch a s NF H are also not showing up as highly overexpressed . W hile th is le aves open the door to multiple mixings, the evenness of the pairwise patterns frequencies plus the difficulty of imagining how the Han and Papuans would have mixed with Neanderthals separately, is in fav or o f just one mixing. The lower frequency of NF comp ared to NH corroborates the view there is no evidence of further surviving gene infusion from Neanderthals in Europe. Thus, Homo froggie i i is apparently no more Neanderthal than the gracil e Homo han . The SY pattern is the n ext m ost de viant. T his m ay be du e to introgre ssion b etween these two populations , but it m ight a lso b e d ue to seq uencing erro rs. The pattern isolatin g N eandertha ls fro m the rest of the spe cies is underreprese nted. The followin g two patterns of A frican w ith Frenc h are overrepresented, again perhaps reflecting low levels of gene - flow o ver long p eriods due to relative proximity , or sequenc ing e rrors. A lot of th e oth er p atterns show defic iencies and these ma y be du e, at least in part to Papuans havin g 10 % or m ore o f their geno me derived from archaic species of Homo . It is d angerou s to o ver interpret this spectrum since the model is clearly quite to rtured with a to tal deviance about 20 times as larg e as it should be due to that pred icted by intra - chromosom al comparisons, such as table 1 . One in teresting pattern m issing from table 2 is N SYF HP which supp orts the hypothesis of d enisova mixing with erectus . This is a relatively com mon pattern that is on ly overrepresented by about 100 out of 4800, giving a small signed deviance of about + 5. 3.7 Rob ust model ing As shown in Waddell (1995), inadequa cies of the mod el may act up on deviant patterns with high l everage t o dist ort parame ter e sti mates . In th e cas e of the pre sent d ata se t, it is clear th at there are signals str ongly d eviating fr om the single s pecies tree coalescent m odel due to a m ixing of N eanderthals with the m odern out of Africa people, and a Denisova relative mixin g Papuan ancestors. Likeliho o d and minimum X 2 fitting give high leverag e to rarer patterns , su ch as thos e spe cifically produced by these mixing events . One way to r educe this effect is to minimize th e absolute deviat ion divided by the expected val ue, or even si mply minimize t he sum of the absolute deviations. The former is basically minimizing the mean percent er ror. Doing this the best fit is 13.14% and the parameter values are 0.023445, 0.159497, 0.101626, 0.379833, and 0.333237, respectively. The values deepest in the tree have increased m arkedly due to the fit not being so concerned about reta ining deep ancest ral polymorp hism to ex plain patterns such as NP or DP. However , minimi zing jus t the su m of the absolute deviations , th e average dev iation per cell becomes 126.68, and the parameter values return to som e thing like those seen w ith likelihood, n amely 0.01321 2 , 0.179201 , 0.112174 , 0.339766 and 0.243950 . Anothe r way to gauge the effect of highly leve raged o utliers, wit hout access to a bett er model , is to com pletely deleverage the worst of the disagreeing site patterns and fit only the remaining partial spe ctrum . In this c ase, we comp letely dele verage the pattern s NP, N H, NF , DP and DN P since these are the ones m ost imp licated in the interspecies breeding (we do this by subtracting their dev iance from the total deviance ; a simila r solution is obtain ed later if we renormalize the sum of the expected values of site patterns still bein g weighted to equal the observed sum of these patterns ) . R eestim ating we ob tain a fit o f 1756.0 and parameter estimates of 0.032526, 0.185391, 0.100423, 0.361597 and 0.286615 . If we als o turn of the other patterns amongst the 10 most deviant (FHP, SY, DS YFHP, SF and Y F) we end up with a fit of 1263.0 and Waddel l , Ramos and Xi (2011). S pectral An alysis of H omo den isova and relatives Page 23 parameter values of 0.025549, 0.170123, 0.106303, 0.360353 and 0.277789 which remain higher than tho se fou nd previously for the stand a rd minim um X 2 fit. The overall fit howeve r, remain s far worse than expected by inter - chromosom al variability , so the misf it of the data may be marke dly more complex than antici pate d ev en wi th a t wo ev ent ret icul ate model. In the above ex amples, we did not renormalize the expected vector to sum to the exact value of the observed values being fitted. D oing this, the estimates remain close and are again increased over w hat they w ere p reviously with a f it of 185 4.8 a nd par ameter estimate s of 0.032808 , 0.186022 , 0.100740 , 0.362463 and 0.287183 . Combinin g both a robust fit criter ia, absolut e percent standard deviat ion and ignori ng the NP, NH, NF, DP and DNP cells offers an insi ght int o what els e may not be fit ting wel l. Doing this th e abs olute p ercent standard deviation drops from 13.14 % to 9.85%, with p arameter values of 0.037276, 0.170392, 0.102488, 0.403647, and 0.316599, which are about as large as seen in any of the sp ecies tree - fitting model s conside r so far . The residua l rem ains large thou gh compared to the 3 .5 % or so we ar e shoot ing for in the long run . T he most deviant cells are no w DNSYFH (28.1% over) , NFH 27.3%, NSYFH 26.9%, DSHP - 25.9%, NSFP - 24.5%, DN SFHP 22.2%, NY 22.0%, FHP 22.0%, DYFP - 21.9% and D NYFP - 21.6 %. Two of these overexpre ssed patterns (DN SYFH, NSYFH) m ight suggest that Papuan and Denisova are h arboring ancient alleles . Th e pattern FHP is still und erestima ted. This may be due to the tips below (F, H and P) showing more diversity in fixation patterns than expected when FHP is fitted well (wh ich may be an enduring issue with Papuan getting a fair few genes from Denisova , or pe rhaps comple x mixin g bet ween the out of Afri ca populat ions ). One of these pattern s, NY, coincid es wit h a hypothesis that Reich et al. (2010) were suspici ous of, that is, that some Neanderthal genes may have gotten back into Africa. Supporting the possibility of this, the N S pattern is also higher than it should be (by 17%). W hen devia nce is the mea sure of misfit but parameters are estimated by robust o ptim ization , D N (signe d dev iance - 365.7), SYFHP - 287.3, FHP +211.8, SY +78.8, DNSFHP +75.3, DSYFHP - 73.7, D NSYFH +72.5, DNY FHP +54.5, SF +49.4 and NY +45.0 top the list of deviants . The direction of the patte rns DN and SYFHP suggests these edge lengths may no w be overestimated due to “less homoplasy” (more technical ly, “less polymorphism” ) than the mod el expects occurring below these edges . Th e patterns SY and SF (with Y F just off th e list) sug gest post - moder n mi xing withi n Africa and Europe and / or sequencin g errors . The underestimate of patterns DNSFHP, DNSYFH and DNYFHP (wi th DNSYFP and DNSYHP appeari ng not much further down the list) are all suggestive of either sequencing error or convergent m utations in Y, N, P, S, H and F respecti vely , in the observ ed d ata . This is because th e long est pairs of edges in this tree are chimp with the terminal ed ges to each of these species ; the patterns m ost readily generated by sequencing error or homoplasy . I n co ntrast NSFYH P n ow has a very low de viance from the m odel, in agreement w ith the analyses in Reich et al. that suggest a very low rate of sequence error in Denisova. These are the patter ns that are expected to better fit the model when the additio nal correc tion of a finite site s model is used with a hierarchical coa lescen t model (Waddell 19 95). However, the pat tern DSYFHP (genera ted by an appare nt sequenci ng error in Neander thal) is consi dered like ly if Nean derthal h as an abnormally high sequencin g error rate , however, this pattern is clearly under estimated in the da ta. These resu lts with more robust fit statis ti cs suggest that parameter values are not only being screwed up by Neanderthal and Denisova n screwing, but also, at least partly by sequen cing error. There is, how ever, a limit to how much can be inferred from a mo del with a lot mo re misfit than is expected. Here we hav e ma de som e pr edictions of wh at mig ht be going o n, in the hop e that these may be t ested a s more complex model s become available . 3.8 Parameter free co alescent model l inear i nvariant s Invariants are functions that should take a particular value irrespective of the parameters Waddel l , Ramos and Xi (2011). S pectral An alysis of H omo den isova and relatives Page 24 used in the model. They therefor provi de a useful test of some of the most fundamental aspects of a m odel, such as that the data are described by coalescence around a single s pecies tree. A very useful form of invariants are linear functions of the input data. They allow the user to gauge potential fit before running the sp ecific cases of the models they appl y to. For hierarchically structured coalescences , assuming the infinite sites mod el , the se are identif ied in Wad dell (1995 ) with an exac t bi nomial tes t, while a X 2 approximation is d escribed in Waddell et al. (2000, 2001 ). F or example, on the rooted three species tree 01 1 (that is spec ies 1 and 2 sister to each other) and assuming the infinite sites mo del, a nd eit her assuming that all the external lineages have fixed all the polymorphic sites or random ly sa mpling to create this effect (as is the case with the pseudo - homozygotes generated by the data collect ion/processin g procedure of Reich et al. 2010 ), then the frequ ency of site patterns 101 and 110 should be equal. That is, f(101) = f(110), so E[ f(101) - f(110 ) ] = 0 is true for hierarchically structured coalescent models. Assuming all sites are unlinked then a binomial exact test can be used to statisticall y test this statement with sampled data. When using the X 2 versi on of the test, the sum of the test statistics should asymptotically have a chi - square distribution with degrees of freedo m equal to the sum of the deg rees of f reedom of the tests if they are operating on disjoint sets of patter ns (when they are not operating on disjointed sets of si te patter ns then their expected value remains the same, but the covariance structure becomes m ore complicated, but still predict able from the observed site patte rn frequencies) . These test s al low a look at problems with the single species tree model that are insensitive to the n ature of th e popula tion size f luctuations , for ex ample, b ut basic ally s ay the data does not fit a single species tree. Note, if ther e is signif icant struct ure withi n an ancestra l lineag e, this to o violates the assumption o f a single species tree , acc ording to the phylogene tic sp ecies concept, since these sub - divided populati o ns will be fixing dif ferent allel es at different rates. For the seven species tree ((D,N),(S,(Y ,(F,(H,P))))) there are many invari ants on the full site pattern spectru m in duced b y the tw o cherrie s of this tree. We have cod ed in PERL a simple algorithm to id entify all the simple linea r inv ariants induced by cherries of a tree . In table 3 the most deviant pairwise invariants are sorted a nd listed . Only those larger with devian ce > 6 are shown, since this is roughly the critical 95% valu e of a chi - square with 1 degree of freedom scaled by 1.5 to account for probable linkage (likewise, later only q uartets w ith a deviance of at leas t 1.5 times as larg e as the 95% critical value of a chi - square w ith 3 degrees of freedom are show n) . For this tree there are 30 pa ir wise invariants and 8 qu artet invariants . Their combined deviances a re 465.4 and 313.3, respectivel y. Together they ar e about a quarter of the total deviance recorded for the fit statistic when a hierarchica l coalescent model was fitted in the previous s ection. The pairwise linear invari ants identi fy the largest deviat ions being the pair NF versus DF . This is consisten t w ith French getting genes from Neand erthals and not Denisovans (Reich et al. 2010) . The next pattern show s a much lower frequ ency of the p attern of an allele shared by S an, Yoruba or French with Papuans, compare d to with Han. Th is is consistent with Papuans getting a unique infusion of archai c genes. The next pa ttern is no t s o specific , but shows that D enisovan generally sha re s fewer ge nes w ith the modern humans sampled than do Neanderthals (one of these patterns is consistent with the H. denisova / H. erectus hypothesis , th at is the patte rn NSYFHP ). The other in variants tend to suggest either that modern human allelic patterns are rarer when Papuan is exchanged for Han , or else emphasize Denisova pat terns be ing more common with Pa puans while Neander thal patterns are relativ ely more common with Han. Overall, these invari a nts are consistent with the hypothes es in Reich et al. (2010) of Neandert hal genes flowing into the out of Africa population and Denis ova genes flowing uni quely into the Papuan lineage. The full spectrum quartet invariants in table 3 are even m ore discern ing per pattern than the pairwise invariants. The first s hows that the D H pat tern is much rarer than its equivale nts involving Neand erthals and Papua ns, consiste nt with D enisov an gene s flowing only into Papua ns. The deviance of the next pattern seems to be an echo of thi s same feature when the “bystander” states of 1 in San an d French are added in, except that now it is an excess of Neanderthal with moder ns exc ept Pa puans . Thi s is an inte rest ing subtlet y. If Neande rtha ls had spread their genes Waddel l , Ramos and Xi (2011). S pectral An alysis of H omo den isova and relatives Page 25 evenly amongst the out of A frica people, this would not be expected. Th ere may b e some subtle evidence of French an d Han having some Neanderthal gen es that the Papuans do not have. The Papuan might have lost up to 8% or so of its genes originati ng on the out of A frica Neanderthal mixin g by bein g overwr itten by the later Deniso van mixi ng, b ut the differences observed here seem larger than that in percentage terms. Table 3 . Simple linea r invariants for coalescent model s with the species tree ((D,N),( S,(Y,(F,(H,P) ))))) with the infinite site s assumptio n. The firs t th ree colum ns track the pairwise only invariants, while the columns on the right are quartet linear invariants. These are assessed it the sixth column based on arbitrary pairs determined by the numerical order of the patter ns (using binary indexing). The seventh column gives the deviance of each pa ttern within t he quartet, while the final column is the de viance of the quar tet overall. Pattern O bs X 1 2 Pat tern obs X 1 2 X 1 2 X 3 2 NF 1165 171.4 NH 1213 177 .9 35.0 203.2 DF 613 DH 639 144.6 SYFP 1204 67.7 NP 1172 4.5 21.5 SYFH 1643 DP 1071 2.2 NSYFHP 4776 56.5 NSFH 325 13.8 22.3 32.5 DSYFHP 4069 DSFH 237 0.7 DNP 1116 35.1 NSFP 204 2.2 8.5 DNH 853 DSFP 235 0.9 FP 4601 28.4 NSYFH 502 6.7 15.7 25.9 FH 5127 DSYFH 423 0.0 YP 2523 27.8 NSYFP 359 2.1 9.1 YH 2912 DSYFP 399 1.1 YFP 1777 21.4 NFH 429 15.6 13.9 19.4 YFH 2064 DFH 321 3.9 SFP 1210 19.3 NFP 347 0.1 0.4 SFH 1436 DFP 337 1.3 SP 1966 7.0 NYFH 320 10.0 10.0 14.8 SH 2136 DYFP 245 2.0 SYP 1014 7.0 NYFP 267 1.3 0.0 SYH 1137 DYFH 241 2.8 NSF 350 6.4 DSF 286 Anothe r set of invari ants , the three infor mative site patterns ind uced by rooted triples, are described in detail in Wadde ll et al. ( 2000 and 2001). Table 4 shows the result of app lying the full set of these invariants to the curre nt data set. Also shown i s the P 1 statistic of W addell et al. (2000, 2001) that m easures the likelihood ratio of the rooted binary triple sugge sted by the species tree, verses the n ull hypo thesis of a root ed trinary triple (an unresolved three taxon rooted tree). Note that the w orst fit by the P 2 statistic involves the triple ((D,N),H). The P 1 statistic is very large and significant and indicates that this is a highly resolved triple consistent w ith the spe cies tree of figure 1a, but the two patterns DH and NH are significantly different in frequency , when they should be equ al under a hier archical ly struct ured coale scent mode l based on a single species tree. D itto for the second m ost deviant pattern. The thi rd strong est vio lator o f the expected equality of the non - species tree informative sub - patterns is the tripl e (F,(H,P)). This triple is much less stro ngly res olved a nd ther e is a substantia l deficie ncy of the F P patte rns in the data. This triple is consist ent with suggestions that H an may be a approximately 50 :50 hybrid of member s of the French and Papuan line ages , althoug h lat er we will look at this more closel y and Waddel l , Ramos and Xi (2011). S pectral An alysis of H omo den isova and relatives Page 26 consider other possibilities. The misfit of triples such as (Y,(H,P)) to (S,(F,P)) may be part of the proximal cause of the NeighborNet splitting SYFH from all the others. It is interestin g to n ote that the rooted triples for ((D ,N),Y) an d ((D,N ),S) are both of a similar de gree of misfit on P 2 in favor o f N with m odern . This might indicate a mem ber of the Neander thal lin eage mixing with the ancestor of all moderns, but it migh t als o be Denisova picking up a significant fraction of genes that lie outside the Neand erthal, D eni sova, m odern human, clade. This has not been confirmed yet, but is consistent with the rather old m tDNA form found in Deniso va (Krause et al. 2010). Here, t here is little evidence here for NY being better supported than NS, a possibility considered by Reic h et al. (2010). Finally, it is interesting how little evidence there is for specific mixing between, for example, San, Yoruba and Han. It would be very much anticipated, a priori that the San and Yoruba , being relat ivel y close to each other for a very lon g period of time, may have experienced appreciable gene flow. In contrast, it is very hard to see how San and Han would experience appreciable gene flow since the out of Africa ev ent, perhaps 60,000 y ears ago. Howev er, the d ata seem to suggest that the S Y signal is actually weaker than the SH signal. Thus, the general misfit of the model does not seem to point towards gene flow within Africa. It w ill be im portant to w ork with a muc h - improv ed version of this data set (e.g. confidently calling diploid versus haploid states) to be confident errors are not hiding these finer details fr om view. Table 4. The full set of rooted triples for the species tree in figure 1a under an infinite sites hierar chical coalescent model for all sub spectra of rooted 3 species tr ees. The P 1 statistic of Waddell, Kishino and Ota (2001) is the G 2 likelihood ratio of th is data und er the spec ies tree hyp othesis vers us a three - way coalescent. The P 2 statistic of Wad dell, K ishino an d Ota (2001) is the X 2 statistic for the deviation from the expected equality of the two nonspecies tree signals. The results are sorted by the magnitude of the P2 statistic's deviation from expectation. Here, x is the leftmost of the two most closely related lineages, y is its sister lineage, and z is their m utual sister. Rooted Triple f xy f xz f yz P 1 statistic P 2 statistic ((D,N),H): DN(23176 ), DH(10064 ), NH(11980 ), P1= 3069.57, P2= 166.53 ((D,N),F): DN(23323 ), DF(10026 ), NF(11851 ), P1= 3186.18, P2= 152.24 (F,(H,P)): HP(15601 ), FH(15580), FP(13604), P1= 22.57, P2= 133.79 (Y,(H,P)): HP(22385 ), YH(12963 ), YP(11427 ), P1= 2102.76, P2= 96.73 (Y,(F,P)): FP(21015), YF(13557 ), YP(12054 ), P1= 1379.91, P2= 88.20 (S,(H,P)): HP(25784 ), SH(11624), SP(10277), P1= 4312.26, P2= 82.85 (S,(F,P)): FP(24359), SF( 12173), SP(10849), P1= 3272.57, P2= 76.14 (N,(S,H)): SH(26192), NS( 994 9), NH(11199 ), P1= 4805.27, P2= 73.88 (N,(Y,H)): YH(30064 ), NY( 924 3), NH(10333 ), P1= 7674.59, P2= 60.69 ((D,N),Y): DN(23580 ), DY(10290 ), NY(11294 ), P1= 3395.66, P2= 46.70 ( N,(S,F) ): SF(26271), NS(10051 ), NF(11025 ), P1= 4874.36, P2= 45.01 ((D,N),S): DN(23670 ), DS(10256 ), NS(11224 ), P1= 3471.08, P2= 43.62 (D,(S,P)): SP(25885), DS(10021 ), DP(10969 ), P1= 4713.07, P2= 42.82 (D,(F,P)): FP(36955), DF( 769 8), DP( 852 9), P1= 14464.22, P2= 42.56 ((D,N),P): DN(23028 ), DP(10562 ), NP(11497 ), P1= 3001.49, P2= 39.63 (N,(S,P)): SP(25240), NS(10344 ), NP(11259 ), P1= 4160.48, P2= 38.76 (S,(Y,P)): YP(17866 ), SY(14333), SP(13317), P1= 349.45, P2= 37.33 (D,(Y,P)): YP(29598 ), D Y( 9309), DP(10133 ), P1= 7467.13, P2= 34.92 (N,(Y,F)): YF(30087 ), NY( 929 9), NF(10113 ), P1= 7774.93, P2= 34.13 (N,(Y,P)): YP(28861 ), NY( 957 6), NP(10331 ), P1= 6801.92, P2= 28.63 (D,(H,P)): HP(38596 ), DH( 752 7), DP( 817 3), P1=16114.55, P2= 26.58 (N,(H,P)): HP(37701 ), NH( 854 8), NP( 821 3), P1=14595.75, P2= 6. 70 (N,(F,H)): FH(37626), NF( 821 8), NH( 849 4), P1=14578.83, P2= 4. 56 (D,(S,H)): SH(27147), DS( 993 6), DH(10238 ), P1= 5719.09, P2= 4. 52 (S,(Y,H)): YH(18596 ), SY(13527), SH(13858), P 1= 507.03, P2= 4. 00 (S,(Y,F)): YF(18525 ), SY(13489), SF(13797), P1= 504.47, P2= 3. 48 (D,(F,H)): FH(38832), DF( 759 9), DH( 778 4), P1=16561.96, P2= 2. 22 Waddel l , Ramos and Xi (2011). S pectral An alysis of H omo den isova and relatives Page 27 (D,(Y,H)): YH(31032 ), DY( 920 7), DH( 938 5), P1= 8809.83, P2= 1. 70 (N,(S,Y)): SY(26096), NS(10184 ), NY(10344 ), P1= 5008.75, P2= 1. 25 (D,(S,Y)): SY(26790), DS( 991 0), DY(10034 ), P1= 5628.12, P2= 0. 77 (D,(S,F)): SF(27188), DS(10000 ), DF(10117 ), P1= 5766.95, P2= 0. 68 (N,(F,P)): FP(36142), NF( 871 0), NP( 865 1), P1=13027.46, P2= 0. 2 0 (Y,(F,H)): FH(21915), YF(12481 ), YH(12514 ), P1= 1796.34, P2= 0. 04 (S,(F,H)): FH(25322), SF(11160), SH(11183), P1= 3932.66, P2= 0. 02 (D,(Y,F)): YF(3104 1), DY( 92 49), DF( 92 42), P1= 8873.88, P2= 0.00 The roote d trip le test s of Waddell et al. ( 2000, 2001) are readily extended to rooted quartets. The off species tree sub - spectral inv ariants of these quartets are shown in table 5. They give a bit more discrimination that the triples. The first five most significant results point out the generality of the pat tern of Papu an sharing more alleles wit h Deni sovan and marked ly les s derived alleles than ex pected with other modern h umans. The next set of d erived all eles on symmetric rooted quartets su ggests the pattern that Papuan shares exclusive derived a lleles with Denis ova is too high, Neandert hal shari ng alleles with Han or Frenc h is too high, while Denis ovan with French or Han is too low, yet Neanderth al with Papuan is relativ ely, neith er too high nor too low. Table 5 . The full set of rooted quartets fo r the species tree of figure 1a under an infinite sites hierarchical coalescent m odel of all sub spectra for rooted 4 spec ies trees . The fre quency (f) of each invariant pattern is shown, along with its signed P 2 X 2 test statistic , follow ed b y the total P 2 statistic for that qu artet and finally, the de grees of fre edom to b e use d w hen forma lly testing against the null hypothesis . To clarify, in the first row, f 13 is the allelic pattern 10 10, where 0 is the ancestral state, thus D and F alone show th e d erive d state. Similarly, for the first row, f 14 is pattern DP, f 23 is YF, wh ile f 24 is YP. The signed P 2 statistic of Wad dell, Kishin o and Ota (2001) is the X 2 statistic for the deviation from the expected value of these invariants of the hierarchically structu red single species tree coalescent model . The results are sorted by the magnitude of the total P 2 statistic's deviation from expectation . Rooted Quartet f 13 (P 2 ) f 14 (P 2 ) f 23 (P 2 ) f 24 (P 2 ) P 2 total df (D(Y(FP))) 3743 - 47.4 4634 47.4 9602 58.6 8159 - 58.6 212.01 2 (D(S(FP))) 3814 - 42.8 4666 42.8 8289 55.6 6986 - 55.6 196.75 2 (D(Y(HP))) 3698 - 34.4 4446 34.4 9134 61.1 7700 - 61.1 190.86 2 (D(S(HP))) 3658 - 33.2 4389 33.2 7755 55.9 6493 - 55.9 178.19 2 ((DN)(HP)) 2661 - 83.3 3159 - 0.1 3682 80.9 3199 0.2 164.42 3 ((DN)(FP)) 2712 - 93.2 3248 - 0.1 3724 65.0 3370 3.5 161.73 3 ((DN)(FH)) 2706 - 40.4 2744 - 32.1 3325 23.5 3454 51.5 147.39 3 ((DN)(SH)) 3722 - 5.6 3530 - 29.8 3735 - 4.7 4491 99.8 139.91 3 ((DN)(YH)) 3475 - 4.9 3249 - 35.7 3511 - 2.6 4197 96.2 139.38 3 (D(S(Y P))) 4525 - 43.8 5460 43.8 9549 22.5 8644 - 22.5 132.57 2 (N(S(YP))) 4720 - 40.4 5635 40.4 9477 20.2 8621 - 20.2 121.34 2 ((DN)(SF)) 3671 - 4.1 3441 - 33.2 3722 - 1.4 4349 80.6 119.33 3 ((DN)(YF)) 3456 - 2.7 3192 - 36.9 3506 - 0.7 4063 72.8 113.11 3 (N(F(HP))) 4 460 - 1.4 4617 1.4 11492 51.2 10008 - 51.2 105.15 2 (N(Y(FP))) 4555 - 2.6 4773 2.6 9402 42.8 8176 - 42.8 90.6 2 (N(Y(HP))) 4529 0.0 4527 0.0 8944 43.4 7741 - 43.4 86.74 2 (N(S(FP))) 4579 - 2.9 4813 2.9 8042 35.3 7011 - 35.3 76.44 2 (N(S(YH))) 4622 - 36.2 5477 36.2 8906 - 0.3 9002 0.3 72.9 2 (S(Y(HP))) 5654 13.6 5113 - 13.6 6993 20.1 6263 - 20.1 67.38 2 (Y(F(HP))) 6125 9.0 5665 - 9.0 8742 24.4 7842 - 24.4 66.79 2 Waddel l , Ramos and Xi (2011). S pectral An alysis of H omo den isova and relatives Page 28 (N(S(HP))) 4475 - 0.2 4535 0.2 7551 32.0 6599 - 32.0 64.45 2 (S(F(HP))) 5477 5.3 5143 - 5.3 9433 25.9 8470 - 25.9 62.3 2 (S(Y(FP))) 5952 10.1 5472 - 10.1 7336 15.5 6677 - 15.5 51.16 2 (N(S(YF))) 4692 - 23.0 5373 23.0 8882 - 0.9 9057 0.9 47.78 2 ((DN)(SP)) 3716 - 23.3 4022 0.0 4039 0.1 4312 20.9 44.26 3 ((DN)(YP)) 3440 - 17.2 3712 0.1 3707 0.1 3910 12.8 30.24 3 ((DN)(SY)) 3576 - 7.1 3610 - 4.5 3850 3.3 3920 8.8 23.61 3 (D(S(YH))) 4527 - 2.3 4731 2.3 8847 - 3.5 9204 3.5 11.56 2 (D(S(YF))) 4574 - 0.4 4657 0.4 8814 - 4.4 9212 4.4 9.53 2 (N(Y(FH))) 4393 - 2.7 4613 2.7 8656 0.0 8633 0.0 5.4 2 (N(S(FH))) 4409 - 1.7 4583 1 .7 7351 0.2 7272 - 0.2 3.79 2 (D(Y(FH))) 3798 - 1.3 3941 1.3 8680 0.0 8671 0.0 2.65 2 (D(S(FH))) 3799 - 1.0 3920 1.0 7360 0.1 7319 - 0.1 2.01 2 (S(Y(FH))) 5626 - 0.2 5687 0.2 6947 - 0.2 7018 0.2 0.69 2 3.9 A n infinite sites reticulate model The first retic ulate model considered is that of Neanderthal mixing only once with the out of Africa group. T his model is based on the models described in W addell (1995), wher e hybridization can be described as a sum of the spec tra of distinct binary trees. In this ca se, the spectrum of each “tree” is in fact produced by a hierarchically structured coalescent model following a single species tree. This is described fu rther in figure 9. Fitti ng this model produces a minimum X 2 fit of 2 554.51 with p aramet er values of g1 = 0.029130, g2 = 0.167078, g3 = 0.116756, g4 = 0.371688, g5 = 0.283454, g6 = 0.25153, g8 = 0.0 and P(N) = 0 .054453 . Tu rning off th e sign als D P an d DN P th at are most s tron gly a ssoc iat ed wit h a Denisova n mixing with Papuan , th en th e m inimum X 2 fit of 2178 .71 is achiev ed with parameter values of g1 = 0.033921 ( 0.027455 - 0.040440), g2 = 0. 169044 (0.163607 - 0.174520), g3 = 0.116076 (0.110668 - 0.121526), g4 = 0.375043 (0.368325 - 0.381804), g5 = 0.282431 (0.274312 - 0.290606), g6 = 0.383276 (0.317097 - 0.452853), g8 = 0 (0 - 0.008409), and P(N) = 0.046551 (0.042092 - 0.051083). The numb ers in the b rackets are a 95% confidence interval based on the point where the fit becomes 6 units worse than the optimum , when all other par ameter values are held constant (which is basically the 95% point o f a chi - square with 1 d.f. multiplied by the inflation factor 1.5 due to linkage). Thus, the fit of this model has improved considerably over that of a single species tr ee model. The p arameter esti mates fo r g1 - g5 of the single Neanderthal introgression reticulate model are higher than those of the single species model except for g2, but they are all fairly similar to previou s estimates . T he new parame ter g6 takes a modera te size in bo th versions of the mode l. T his in turn suggests that the eff ective population size leading from the comm on ancestor of modern hum ans and Neanderthal s down to the Neanderthals of the last 100,000 years in both Europe and the middl e East (which is where the Neanderth als that mixe d with all the o ut of Afric a people would seem to need to be located) w as only slightly smaller than that leading to moder n humans head ing out of Africa . This may be in disagreement with Reich et al. who suggest a very strong constriction in the Neanderthal lineage. Howev er, they a re comp aring European Neanderthals of the last 50 thousand year s or so Europe , and not a Middl e Eas ter n population of around 50 to 80 thousand years ago . T he propo rtion of genes co ming from Neander thals into modern humans is aroun d 5%, which agrees well with estimates in Reich et al. (2010). The data/model is unable to reject the hypothesis that the N eanderthal population which breed with modern humans w as a direct ancestor of the European Neanderthals sequenced (since Waddel l , Ramos and Xi (2011). S pectral An alysis of H omo den isova and relatives Page 29 g8 takes a va lue close to zero) . Figure 9 . The reticu late model we use. Parame ters g1 - g9 are measured in units of the number of generations divided by the effective population size (males and fem ales together). T he asterisks mark the reticulate interbreedin g points, P (D) is the p roporti on of genes contributed by the D enisovan relative to the Papuan population, while P(N) is the proportion of genes for the ou t of Africa peop le contributed by a Neander thal popul ation . R is a parameter that only appears if it is known the Neanderth al population contributing to the out of Africa people is directly ancestral to the sequenced Neande rthal, else parameter g8 i s necessary . A ll terminal edges are effectively inf inite in length as full co alescence in tha t period is forced upon them by the process o f scoring the sequence variants to create pseudo - homozygotes. Following from Waddell (1995 ) this model ind uces fou r sp ecies trees (which could also be called four hierarc hical coalescent models) . T hese four frequency spectra are ind uced , with p robability (1 - P(D))(1 - P(N)) by T(s ) = ((D,N):g5,(S,(Y,(F ,(H,P):g1):g2):g3):g4 )), wi th probab ility P(D)(1 - P(N)) by T(D) = ((( D,P):g 7),N):g5,(S,(Y,(F, H ):g2):g3):g4)) , with probability P(1 - P(D))P(N) by T(N) = ((D,(N,(F,(H,P):g1 ):g8):g6):g5,(S,Y):g4 )), an d finally, with probability P(D)P(N)) by T(DN) = (((D,P):g7,(N,(F,H ):g8):g6):g5,(S,Y):g4 )). All terminal edges are effectively infinite in leng th since the diploid allelic data was called as a pseudo - homozygote. T hus the edg e to P in T (D) and T(D N) equals g9 plus infinity, which remains infinity, thus parameter g9 is not identif iable with this data . Each of these fou r trees in duces a spectrum und er a hierarchic al coalescent model, and the reticulate informative spectrum is the sum of each f spectra (sum of all elem ents equals 1) m ultiplied by the proba bility of that species tree element (e.g. P(D)P(N)) for T(DN)) . In general s (re ticulate m odel) = s ( T i ) i ! . H oweve r, when conditioning on, for example, just the informative sites , it is important to preserve information on their scale ! i relative to all events (i.e., no change or a singleton event, in this con ditioning ) . In tha t ca se w e have s (reticulate model: conditional) = ! " i s ( T i ) i # , where ! is just a renorm alization term so the complete sum equals one. Correct ing the m inimum X 2 with the MS results at the above poin ts, a new solut ion is found with X 2 ' = 2224.74, and parameters g1 = 0.028335, g2 = 0.167548, g3 = 0.116392, g4 = Waddel l , Ramos and Xi (2011). S pectral An alysis of H omo den isova and relatives Page 30 0.371222, g5 = 0.284098 , g6 = 0.24 6541, g 8 = 0.000 000, an d P(N) = 0.0560 85. The se rema in close to their previous values. Correcting for the m inimum X 2 with the DP and DPN signa ls off results in X 2 ' = 1793.65, and parameters g1 = 0.033178, g2 = 0.169 677, g3 = 0.115752, g4 = 0.374702, g5 = 0.282093, g6 = 0.377347, g8 = 0.000000, and P(N) = 0.047389. Again, these remain close to their prev ious values and all are co mfortably w ithin their previous 95% CI. Next, the data is re duced to si x species b y removing the Papuan sequence. The optimal fi t of 1276.65 is achi eved with parameter values of g2 = 0.181111 (0.174079 - 0.188194), g3 = 0.116802 (0.110947 - 0.122702), g4 = 0.377066 (0.370219 - 0.383955), g5 = 0.288641 (0.280594 - 0.296741), g6 = 0.366361 (0.282191 - 0.454756), g8 = 0 (0 - 0.016258), and P(N) = 0. 037692 (0.033171 - 0.042701). The numbers in the brackets are a 95% CI based on the point where the fit becomes 6 worse than the optimum (which is basically the 95% point of a chi - square with 1 d.f. multi pli ed by the inflation fact or 1.5 due to linkage). A formal test of the hypothesis that thi s edge is zero ma y be ma de using a 50:50 X 0 2 + X 1 2 distributi on due to the edge length of the tree havi ng a boundary at zero (Ota e t al. 2 000) and this approac h sh ould also be used to construc t a 95% C I which would run from 0 to 0.011076. The parameters remain fairly close to their expected values with the most notable change being a decre ase in the proport ion of Neandert hal in the da ta. Th is may be due to this parame ter no longer having to explain extra DN patt erns due to the hypothesized Denisova - Papuan inter breeding. The overal l fit of this model has improved considerably from the sing le spec ies tree hierarchical coal escent model. However, it would be expected to have a value of 2 6 - 6(singletons) - 1(constants) - 1(constraint on sum of all observations ) – 7 fitted parameters or 49 assuming independ ence . Since th e actu al va lue is over 1200 , the overa ll mod el is not a c lose m atch to expectations . The lar gest deviants for this m odel are sho wn in table 6 . Whil e fitting of a Neander thal mixin g event has helped the fit, there is still a poor fit in terms of the exact details. T here are too few shared NFH pa tterns and far too many NF and N H patterns. T his could be due to multiple private interbre eding events with Neande rtha ls . Howe ver, it m ight a lso be du e to selection favoring the retenti on of different Neanderthal alleles in differe nt pop ulatio ns or data errors . What eve r t he cau se, t his is p rob abl y a pr imar y caus e of t he edg e lea din g f rom Nea nder thals to t he common ancestor of French and H an having zero length (indeed, it very much wants to go negative). If so, this edge b eing zero length may no t simply be the Nean derthals of the midd le East be ing indistinguishable f rom an ancestor of those in Europe. Notic e t hat there are further pairwise site patt erns (such as SF and SY) where the observed value is greater than the expected (often by 100 to 200 ) . This could be due to interbreedin g am ongst g roups o f mod ern hu mans. However, it d oes no t fit geo graphic expectations well. For example, the pattern YF is over by nearly the same amount as YH, which has exactly the same expected value (the pair are an invariant of this model) , yet biogeographically, the former would be expe cted to be boosted by migration far more readily than the latter. Misfits of this s ort of siz e do not seem to be readily explained by uniform sequencing error howev er . Data in the sup plemen ts of Reich et al. (2010) suggest that the error rate after their filtering of the data is less than 1/10 00 sites. Sinc e long term inal edges dominate the data, the most likely way to generate the pattern YH w ould be two ind ependen t e rrors at an otherwise constant site. If we look at the raw data then, assum ing independe nce, the probability of a do uble hit of YH is equal to 9 7234 x 89751 / 335821175 or about 26. However, if there are hotspots of either substituti on or sequencing error, the freq uency of d ouble hits co uld climb appreciably. However, pat tern s such a s DSYFH migh t see m to be even m ore likely to be generated by sequencing errors in this reduced data and they show a n underrepresentation . Thus to cla rify w hether the pro blems in fit are likely due to sequencing errors, it is necessary to fit finite sites m odels explicitly . There is still some excess for the patte rn placing Deni sova wi th Chimp, but t he si ze of it s deviance is s wamped by many other worse f itting pat terns. Waddel l , Ramos and Xi (2011). S pectral An alysis of H omo den isova and relatives Page 31 Table 6. The most deviant patterns when a single Neanderthal - mixing event is allowed fitte d to the data by minimum X 2 with Papu an removed. Pattern Observe d Expt Devian ce Pattern Observe d Expt Devian ce NH 1626 1200.9 150.4 NY 1445 1276.2 22.3 FH 10467 9501.6 98.1 SFH 4007 3719.9 22.2 NFH 988 1320.6 - 83.8 DYF 550 660.5 - 18.5 NF 1512 1200.9 80.6 DNYF 881 1015.1 - 17.7 SF 3642 3167.7 71.0 DNS 2152 2356.2 - 17.7 DNFH 1455 1791.8 - 63.3 DYH 555 660.5 - 16.8 DYFH 1107 1391.3 - 58.1 NSYH 628 735.6 - 15.7 SH 3614 3201.2 53.2 DSF 521 618.5 - 15.4 DSYFH 4492 4974.0 - 46.7 YFH 6298 6026.1 12.3 DFH 834 1045.1 - 42.6 NSY 807 910.7 - 11.8 DNSYH 1704 1493.1 29.8 DNSFH 2268 2111.9 11.5 YF 4918 4553.4 29.2 DNSF 909 1008.9 - 9.9 YH 4914 4553.4 28.5 NSYFH 5278 5065.8 8.9 DN 12965 13579.4 - 27.8 DSFH 887 979.4 - 8.7 SYFH 9534 10036.2 - 25.1 DNYH 923 1015.1 - 8.4 DSH 494 618.5 - 25.1 DSYH 661 735.7 - 7.6 DNSYF 1685 1493.1 24.7 NSF 554 622.2 - 7.5 NYFH 1251 1433.6 - 23.3 DF 950 1034.8 - 6.9 DSY 842 991.8 - 22.6 NYF 598 664.1 - 6.6 3.10 Th e Full M onty infinite site s mode l This brings us to some exploration of the most complete m odel as yet , oth erwise kn own as the “Full Monty”, possib ly d erived fr om a Sheffield colloquialism for a professionally tailored full suite . T his mode l allows for bo th Ne anderthal and Denisova gene intromission as d escribed in figure 9 . To explore this model more dir ectly, we wrote a P ERL script to control MS and to process the results into the informative site pattern spectrum. It was determined that 10 million repl icates per “ species” tree with M S were sufficient for our purpose. After summing up the edge lengths of these 10 million t rees, the length o f all the in formative edge weights was also approximately 16 million. The fluctuation in the X 2 statistic between in dependent replicates of this size, rescaled to sum to th e observed num ber of inform ative patterns (149,019), was about 1.22, which is less than 1/100 of the expected value for a m ultinomial of lengt h 149,019 (and close to that expected for a rescaled multi nomial of length 16 m illion). The fluctuation of the X 2 statistic with res pect to the real data is larger , due to th e poor fi t of data to model (wi th a mean X 2 of close r to 1 800 r ather tha n ~12 0), thu s the distance of simu lated da tasets of 10 million to th e observed data had an intrinsic fluctuation of ~6. This effect of the quadratic term increasi ng fluctuations betwee n replicates the further the observ ed is from the expec ted can be n egated by using the robust weighted L 1 metric obs ! exp exp " , whi ch is close to the ML estimator w hen the error on each cell is symm etrically exponentially distributed (e ither up or dow n) , w ith s.d. equal to the s ize of the c ell value. Starting at the parameter values found for the Neanderthal mixing model desc ribe d abo ve, we took steps of ~4.s.d. in all possible pairs of directions. Fitting a quadratic model we then stepped towards an optimum. The best X 2 fit w e achieved had a value of ~1831, which we now diagnose. At these paramet er values, either weighting and sum ming site pattern frequencies across species trees first then normalizing, or normalizing then weighting and summing, made very little difference (e.g., X 2 = 1831.5 versus 1831.2, with very similar parameter values, respec tively ) , most likely due to the very s imilar sum of inform ative patterns acro ss all Waddel l , Ramos and Xi (2011). S pectral An alysis of H omo den isova and relatives Page 32 four s pecies trees . Here will focu s on the techn ical ly more corr ect approach of summin g first , then norm alizing. The paramet ers, the X 2 fit and most d eviant patterns at the b est optimum found for the fu ll mod el shown in figure 9 are given in table 7 . The edge lengths of the model remain similar to those see n earlier with eithe r a sing le species tree or a single N eande rthal mix ing. The new parameters g6, g7 and g8 take on values of 0.28, 0 .0625 and 0, respe ctiv ely. It is worth noting that all thes e parameters have a sta ndard error approximate ly 10 tim es as big a s those o n g1 - g5, since they only app ear on the second ary species trees, which have m uch low er w eight than the main speci es tree. Pr ovis iona lly, then, th e value for g6 suggests a similar am ount of coalescence in the N eanderth al lineage prior to m ixing with the out o f Africa group of moderns, as they had experience themselves fr om the comm on ancestor. Again, g8 goes to zero suggesting that we cannot disting uish the Neand erthals that mixed with m oderns from the ancestors of the European Ne and erthals sequenced, given this data an d these models. Finally, g7 is relatively small, suggesting that the ability to clearly discriminate the creature that m ixe d with the ancestors of the Papuan as closer to the Denisova n lineage, rather than to the Neanderthal lineage is rela tively weak. Th is see ms quit e feasibl e, as t his cr eatu re seems to have exist ed in extre me Southeas t Asia, a long way from Denisova in Siberia. It may also have incorporated alleles from even earlier branching Homo lineages indep endently o f the De nisova linea ge. Table 7. The most deviant patterns with a single N eanderthal - mixi ng event and a single Denisova n - mixi ng event, as shown in figure 9. The total X 2 fit w as 1831.5 with summ ation of internal edge vectors first, and parameter values g1:0.0415, g2:0.1765, g3:0.116, g4:0.3725, g5:0.2895, g6:0.28, g7:0.0625, g8:0, P(N):0.0446 and P(D):0.0549. Produced by simulation s of 10 milli on gene trees f or each of the four species tree comp onents. Pattern Observe d Expt Devian ce Pattern Observe d Expt Devian ce NH 1213 740.5 301.4 YFHP 4234 3963.9 18.4 FHP 5340 4354.4 223.1 DFHP 513 619.3 - 18.3 NF 1165 784.5 184.5 DNH 853 737.8 18.0 DNFHP 990 1281.3 - 66.2 DNSYHP 1120 991.6 16.6 NFHP 559 785.2 - 65.2 SYP 1014 1150.9 - 16.3 SF 2432 2101.6 51.9 NSFP 204 270.0 - 16.1 DSYFHP 4069 4494.4 - 40.3 NHP 413 500.8 - 15.4 NY 1131 955.4 32.3 YH 2912 2709.3 15.2 DNSYFH 1179 1014.9 26.5 DNSFH 402 487.5 - 15.0 DNSYFP 1098 941.5 26.0 NYFHP 931 1054.8 - 14.5 DYFHP 866 1028.5 - 25.7 DFH 321 396.3 - 14.3 DNSFHP 1866 1661.0 25.3 SHP 1478 1341.0 14.0 DNF 935 794.3 24.9 SH 2136 1972.5 13.6 NFP 347 451.8 - 24.3 DSYFH 423 505.1 - 13.3 YF 3141 2882.5 23.2 NSYH 239 300.5 - 12.6 NP 1172 1018.5 23.1 DNSFP 425 504.7 - 12.6 DNYFP 413 520.4 - 22.2 DNFP 483 564.6 - 11.8 DN 11849 12369.0 - 21.9 DSY 564 650.8 - 11.6 SFHP 2571 2356.2 19.6 NSYP 242 300.5 - 11.4 The main cause of misf it of the model seem s to be effectively that identified earlier w ith the single N eande rthal - mixing eve nt. The re are far too many patterns of a N eanderth al a llele being shared with just one of the out of Africa individuals, and generally far too few shared between archaics and m ore than one of the out o f A frica people (includ ing the pa ttern NFHP) . Contrad icti ng this , there are too many patter ns shared by the out of A frica people. Again, this could be data errors creating Neand erth al and moder n pat tern s . While th e p attern NY is als o overexpressed, the pattern NS is only about 45 out of 1419 too large and fits the model very w ell. This would seem to argue against this being solely sequencing error unless the San genome has a marke dly lower rate of sequen cing erro r than the other modern s (there is some evidenc e in Reich Waddel l , Ramos and Xi (2011). S pectral An alysis of H omo den isova and relatives Page 33 et al. 2010, t o suggest this). It is temp ting to p ut the b urden for some of this misfit shown in table 7 on the Han individual as b eing a potential mixture of a the lineages leading to European an d Papuan , separately (e.g. Reich et al. 2011) . Howev er, pattern s that w ou ld sugge st this, which are FH (misfit +0.1), H P ( - 6.3), NFH ( - 3.7), N H P ( - 15.4) relative to patterns FP ( - 0.8), or NFP ( - 24.3), suggest that it is only the Neanderthal w ith pairs of out of Africa peop le that fit poorly. It seems tempting then to thin k th at a model of three independent out of A frica lineages, with three independ ent m ixings w ith the same popula tion of Neanderth als (plus the independ ent Denisovan mixin g event) , w ould f it marke dly bette r than th e presen t mod el. The number of extra parameters would be the gain of a g01 and P(NP), g02 and P(NH) and g03 and P(NF) (while paramet er s g8, P(N) and g1 might all be los t). It w ould seem that the P paramete rs would likel y remain in the range of 0 to 0.5, w hile the g 0 parameters might need to be markedl y non - zero to explain the extent of alleles shared privately with Nean derthals. Th e anticipated improvement in fit could be to a value of 1000 or better (obtained by summing up the m isfit on the p atterns most readily explained by this more complicated demograph ic mo del) . T hat would seem a marked improve ment for a model a dding on ly 4 param eters or so . What is also inte res ting is the very minor su ppor t, if any, this da ta offe rs the hypot hes is of Han being a hybrid of European and Papuan lineages (prior to the Denisova n Papuan mixin g) . This can be further evaluat ed by comparing the deviance of the rooted triple (F,(H ,P)) from our best model’s expectati ons. The ob served value , expected value and signed X 2 deviance ar e, respectively, HP: 15601, 15842.7, - 3.7, FP: 13604, 14142.0, - 20.5 and F H: 15580, 16153.3, - 20.3. Thus in this best m odel there is no specific evidence for the pattern FH being overexpressed, indeed all these partial site patterns are under expresse d and the degree of under expression of FP versus FH is no differen t. In this, the m ixing o f mod erns w ith N eanderth al and Denis ova, by it self, seems to expla in why, i n the raw dat a, the patte rn FH appear s to be overexpressed rel ative to FP. It is also interesting to note tha t o f th e m ost deviant patte rns in Table 7 , quite a few can potentially be explained by sequencing / ass embly errors. The most likely conver gent patterns due to evo lution w ould be ch anges in tw o long edges com ing do wn from the an cestor. In this data a ll terminal e dges are lo ng, with th e chim p being by far the lon gest. This m akes pa tterns such as all but one of the ingroup sequences about equally likely by su bs titu t ion . The m ost lik ely independ ent data errors would probably be between pair s of the most poorly sequenced genomes . Interestingl y, if we fix all the g values (tree edge lengths ), but reop timize the proportions of the four trees, allowing them to be independent (hence, one more parameter over the P(N) + P(D) m odel, but not nested within it) th e devian ce impr oves co nsiderably , down ~ 100 units to 1714.0. The new proportions for the four trees in figure 9 are 0.9069, 0.00 01, 0.0485 and 0.0446, respectively, versus th e ap proximate proportions of 0.9022, 0.0422, 0.0531 and 0.0025 expected under the alter native previous model . This new mod el might suggest that there was not a common mixin g of all out of Afri ca people with Neandert hals , b ut rather th at the H an and F rench got their Neander thal - like genes via a mixing with Neandertha ls, perhaps in middle Eurasia, but the Papuans got their high er proportion of archaic genes solely via a mixing with a Denisova n like - creature (although how far its lineage might have been from the comm on ancestor of Denisova and Neanderthal is unclear) . The model itself is also not val id, since if th e ge ne m ixing w ere independ ent even ts, then w e still need four trees , with tree 1 being modifie d into hav ing Ha n + French closest and Tree 2 having a cluster of Neanderthal + Han + French. The sug gestion of this relaxed but not strictly valid model is directly testable, and assuming that there w ere two waves of moderns into Eurasia, with the first wave being the ancestors of Andamanese and Papuans , but the archaic Neandert hal mixing appeari ng late r, then there should be a defic it of archaic genes in Andamane se (in particu lar Neand erthal gen es) . Waddel l , Ramos and Xi (2011). S pectral An alysis of H omo den isova and relatives Page 34 3.11 Switching t o finit e site s models vi a a Hadamard conjugation The finite sites models used here follow the methods of Waddell (1995). They are based on the in finite sites spe ctrum, transformed with an invariant sites plu s gam ma distribution Hadamar d conjuga tion (Steel et al. 1993, Waddel l 1995, Waddell et al. 1997). The parameter s to be optimized are the parameters of the finite sites spectrum used above, allowing a single mixing of N eanderthals with the ancestors of the out of Africa people . The inf ormative si te spectrum produced by the infinit e sites hierarchi cally structur ed coalescent model w ith mixing is then imported into the c orrespon ding entries of the H adama rd gamma vector. The gamm a vector is a model of al l t he biparti t ion w eights in infinite sites space. Th e entries for the ga mma v ectors corresponding to the split of one taxon from all the o thers, e.g. , ! C, are entered as free parameters. In order to balance these against the informative in finite si tes fraction o f th e spectrum, w hich is not on a mutation scale yet , there is a free to op timize scale parameter. Finally, there is a free parameter a , for the fr action of in variant site s in the sequ ence and a shape parameter k , for the shape of the gam ma d istribution of site mutatio n / substitution /error rates. Thus, we have moved from a model with 8 free parameters to one with an additional 8 + 1 + 2 = 11 free parameters, to give a total of 19 parameters to be optimized. A gain, minimizing the total X 2 devian ce is the objective of the numerical opt imizer. Before we look at the result s it is useful to look at the predicted quality of the error rates in the vario us genomes. Estimate s of sequencing error rate are made in Reich et al. (2010) table S2.4. These are, for transversions on ly, De nisova 0.000127, N eanderthal 0.000940, San 0.001523, Yoruba 0. 001518, French 0.001008, Han 0.0015780, and Papuan 0.003159. The soluti ons to this finite sites single Neanderthal mix ing model ar e show n in tabl e 8 . There are four v ariants of the m odel show n, the first fits all site patterns, including u ninformative sites, w hich include singletons. The se cond fits all site patterns, except the DP a nd DNP p atterns, which misfi t due to our not having the a gene infu sion leadi ng from th e D enisovan lineage to the ancestor of the Pap uan (due itself to the unanticipated retirement of Jorge Ramos at the peak of his population genetics career). The third focuses on fitting just the informative sites. This is a better approximation to a model where there are two site spectra bein g combi ned. This first spectrum is a fin ite sites sp ectrum due to a coalescent pro cess and substitution , w hile the secon d is a indep endent error spec trum based on a star tree, with a u nique edg e length for each sequence , representing jus t the error rate in tha t sequence. F inally, there is th is model m inus the DP and DNP pat terns. The first model , labele d “ Finite ” in table 8, offers a better fit than the infinite sites m odel at 2393 verses 2554 X 2 units. This is due to t he extra 11 free parameters and despite having to fit another nine site patterns. T he parameter estimates are broadly similar to those seen earlier. Th e ! values closel y fit the relative proporti ons of the singleton site patt erns in the data, since these have huge weight compared to the informative site patterns. Turing off the DP and D NP signals, the model lab eled “Finite – DP” in tabl e 8 imp roves consid erably, and is aga in b etter than witho ut the Had amard co njugation , with a fit o f 2045 verses a fit of 2179 without . The two m ost notab le parameter changes are g6 becomes longer. This is because the single Neanderthal mixing is no longer being pressed by the high frequency of the D P and D NP patterns to explain them with a lineage bra nching closer to the common ancestor of D and N. Waddel l , Ramos and Xi (2011). S pectral An alysis of H omo den isova and relatives Page 35 Table 8. The optimal fit and parameter values for the finite site models fitted with one mixing of Neander thals with the out of Afr ica l ineag e. Model Finite Finite – DP Finite – Uni f Finite – Uin f – DP X 2 Fit 2393 .0 2044.7 1165.5 932.8 g1 0.025 0.029 0.036 0.036 g2 0.170 0.170 0.235 0.227 g3 0.122 0.119 0.134 0.128 g4 0.382 0.384 0.456 0.439 g5 0.285 0.281 0.349 0.329 g6 0.134 0.259 0.083 0.236 g8 0.000 0.000 0.062 0.000 P(N) 0.067 0.055 0.021 0.019 ! C 0.00270 0.00270 0.0054 0.0048 ! D 0.00017 0.00017 0.0039 0.0023 ! N 0.00028 0.00028 0.0068 0.0062 ! S 0.00024 0.00024 0.0066 0.0060 ! Y 0.00027 0.00027 0.0075 0.0068 ! F 0.00026 0.00026 0.0079 0.0074 ! H 0.00029 0.00029 0.0077 0.0072 ! P 0.00030 0.00030 0.0089 0.0065 k 178.480 385.982 0.474 0.554 a 0.000 0.000 0.050 0.008 Scale Facto r 0.995 0 .989 56.654 47.562 Majo r gains in the ove rall fit appear when the uninformative sites in the da ta are ignore d , as in the model labeled “Finite – U” in tabl e 8 , so that singleton gamma values are effectively acting m ore like free per sequence error rates if we ha d explicitly a dded in a star tree spectrum to model thes e values. In this case, they no longer closely match the terminal edge len gths , o r the singleton site pattern frequencies , havin g becom e 10 or m ore times larger in some case s . They now more cl osel y resemble the sequencing error rates in the sequences estimated by R eich et al. (2010) . That is very lo w in Deniso va, highe r in N eander thal and San , bu t h ighest in the gen omes of Yoruba, French, Han and Papuan. This m odel now fits much much better , w i th an improve ment of fit of about 1000 X 2 units ! The contr ast of this with the two prev ious “substitution only” models is also huge, w ith an imp rovement of about ~ 1000 units v ersus ~200 units, suggesting most of the problem is not substitutions, but data e rrors. The population genetic parameters have shifted noticeably. The inbreeding lengths of all the edg es in the coalescent - based primary species trees have increased mark edly , to val ues th at are on averag e high er tha n any seen in the previous analyses. The inbreeding edge g6 has become shorter ag ain as it is helping to explain the DP and DNP patterns now back in the model. T he fraction of Neanderthal mixin g has more than halved to aro und 2%. Addit ionally , the inva ria nt site s and gamma shap e parameters have taken values that suggest the rate of con vergent events due to the finite si tes model (wh ich is now modeling what is appare ntly mostly sequen cing /ass embly error) is highl y variable , with m uch higher r ates a t som e sites. Finally, turning o ff the DP and DN P patterns again, there is th e anticipate d impro vemen t in fit of around 200 units , down to belo w 10 00 X 2 units. The inbreeding edge lengt h g6 has increased again to around 0.24. Also, th e err or rat e implied by the free ! values has also reduced as, particularly on the D and P sequences, as they are no longer being call ed upon to help explain the high frequency of the DP and DNP patterns. The major r esidual s of t hese four finite sites model s a re shown in ta ble 9 . A ver y interesting featu re of the third and fourth m odels is that site patterns that are mo st likely to be due to sequen cing errors have , generally, either dropped of f the list o r have become deficient in their Waddel l , Ramos and Xi (2011). S pectral An alysis of H omo den isova and relatives Page 36 observed frequency. In the very best fitting model, the pattern NSYFH P has now appeared as that which is most overe xpres sed in the real dat a. This pattern is consist ent with th e hypot hesis th at Denis ovans may have picked up genes from an even more archaic human such as Homo erect us . It is a lso is consistent w ith the “ Ron Je remy ’s Grandfathe r ” hypothesis, that this event may have been dom inated by gene flow from the more archaic males into the more modern females , as suggested by the C A analysis earlier . Other patte rns that are still overex press ed include the FHP pattern, whi ch sug gests that the inbreeding m easure g2 w ants to becom e larger but is being held back by other features of the data. These may be the next two m ost overexpressed patterns, namely YFH and SYFH , w hich are anta gonistic to the pa ramete r g2 . Th e su ggestio n h ere seem s to be that these individuals share something derived that the Papuan sequence does not, or looking at it the othe r w ay around , the P apuan m ay have som e v ery arch aic alleles , perhap s a gene injection from the archaic hom inids thought to have been livin g in Ind onesia u ntil relatively recently. These include Homo flor esie nsis , w hich is may b e a d warfe d descend ant of Homo erectus that apparently lived un til less than 20,000 years ago in the very region the Papuan’s ancestors had to migr ate through ap p roxima tely 60,000 years ago . Table 9. The thirt y most deviant site patterns for the four finite site models fitted with one mixing of Neander thals with the out of Africa lineag e. They are, left to right , fitted to the full site spectrum, the full site s pectrum minus the DP and DNP patterns, the full site spectrum m inus the uninformative site patterns and, finally, the former minus the D P and DN P patterns also. For each the derived site pattern, the expected frequency predicted by the model and the signed X 2 statistic is shown. Model F F-D F-U F-U -D Pattern Expt. X 2 Expt. X 2 Expt. X 2 Expt. X 2 FHP 4347.1 226.8 NH 789.4 227.3 NSYFHP 4069.4 122.7 NSYFHP 4142.2 97.0 NH 809.4 201.2 FHP 4387.1 207.0 DNP 866.3 72.0 FHP 4744.1 74.8 DP 726.4 163.5 NP 790.1 184.6 FHP 4765.2 69.3 SYFH 1330.1 73.6 NP 810.1 161.7 NF 819.9 145.3 DP 841.2 62.8 YFH 1776.5 46.5 DNP 787.1 137.5 DSYFHP 4832.1 - 120.5 SYFHP 8580.8 - 55.5 SYFHP 8491.6 - 42.5 NF 834.5 130.9 SF 2025.8 81.5 SYFH 1371.2 53.9 FP 5038.2 - 37.9 DSYFHP 4 816.3 - 116.0 NFHP 812.1 - 78.9 DF 812.4 - 48.9 NY 1327.1 - 29.0 DNFHP 1323.4 - 84.0 DNFHP 1299.1 - 73.6 FP 5080.3 - 45.2 SFH 1252.6 26.9 SF 2022.9 82.7 SYFH 1346.2 65.4 YFH 1783.5 44.1 NSYFH 402.3 24.7 SYFH 1354.7 61.4 YF 2790.1 44.1 YP 2871.5 - 42.3 NS 1612.2 - 23.2 NFHP 746.1 - 46.9 NY 952.1 33.6 DH 787.5 - 28.0 YP 2771.6 - 22.3 YF 2792.8 43.4 NFP 472.8 - 33.5 SFH 1252.5 26.9 NP 1025.9 20.8 NFP 473.0 - 33.6 YFH 1828.4 30.3 DNYFHP 2218.9 25.3 NSFH 255.7 18.8 SYP 1214.7 - 33.2 SYP 1196.4 - 27.8 NH 1054.8 23.7 DNYFH P 2251.4 18.6 NY 959.3 30.7 DYFHP 1031.1 - 26.4 SF 2206.7 23.0 HP 5728.7 - 17.1 DYFHP 1037.0 - 28.2 YH 2656.8 24.5 SP 2188.7 - 22.7 SYP 1151.7 - 16.5 YFH 1839.5 27.4 SFH 1265.4 23.0 NY 1300.9 - 22.2 NFHP 661.5 - 15.9 DN 12406.1 - 25.0 DNF 800.0 22.8 HP 5754.9 - 20.0 SYFP 1345.8 - 14.9 DFHP 639.4 - 25.0 DN 12349.8 - 20.3 SYP 1163.2 - 19.1 NH 1090.1 13.9 DF 744.0 - 23.1 SYFHP 8300.2 - 20.2 NSFH 255.4 18.9 DSYFHP 4309.6 - 13.4 SFH 1267.6 22.4 SH 1940.4 19.7 YF 2914.6 17.6 DY 983.9 13.0 DFH 417.6 - 22.4 NYFHP 1076.4 - 19 .6 NS 1582.7 - 16.9 SF 2261.4 12.9 DNYFP 519.9 - 22.0 DFHP 619.1 - 18.2 SYFP 1349.8 - 15.7 DF 706.2 - 12.3 YH 2677.8 20.5 DNYFP 508.9 - 18.1 NSYFH 421.2 15.5 DYFHP 974.4 - 12.1 DNSFH 501.5 - 19.8 NHP 507.4 - 17.6 DNSFHP 1704.0 15.4 SHP 1354.3 11.3 DNFH 570.0 -1 9.3 NSFP 271.9 - 17.0 DNSFH 478.9 - 12.3 DNSFHP 1731.4 10.5 NSFP 275.7 - 18.6 DSHP 287.7 - 16.9 SHP 1352.2 11.7 DNSFH 471.1 - 10.1 SFHP 2363.1 18.3 DNSFH 491.4 - 16.3 DYFHP 967.9 - 10.7 DNYFP 482.3 - 10.0 DSHP 289.8 - 17.8 SYFP 1348.8 - 15.5 DNYFP 481.7 - 9.8 NSFP 253.6 - 9.7 SH 1950.5 17.6 FH 4855.8 15.1 DNS 1797.3 - 9.6 DNS 1793.6 - 9.1 3.12 Fittin g Chromosome X The most dist inctiv e fe ature of ch romosome X is its se x - linked characte r. Most males Waddel l , Ramos and Xi (2011). S pectral An alysis of H omo den isova and relatives Page 37 carry one copy of this chromosome, while most females carry two cop ies (although in extinct species such as Homo sovietu s , this was ne ver alwa ys clear). T hus if we fit chrom osom e X site patterns to the parameters estimated for the auto somes, then un der a homog eneous model, the main dif fer ence wil l be the effe ctiv e popula t ion s ize of the g enes. If w e call th is ratio z, then z = 2 N m + 2 N f N m + 2 N f , letting x b e the effective proportion of males (that is N m N m + N f ), th en x = 2 ! 2 z (and z must be in the range of 1 to 2) . Fitting to the corrected minimu m X 2 '' model parameters with z = 4/3 so that x is 0.5 (or N m = N f ), the fit of the 2253 site patterns from chromosome X has total deviance 288.6. When z is chosen to minimize X 2 '' (at deviance value 275.7), th en it ta kes on value 1.201 3 . T his cor respon ds to a value of N m of nearly exactly 1/3 of the total effective po pulation size of ma les an d females. A n approximate 95% confidence interval on z (assuming an inflation factor of X 2 '' 1.5 due to inter - chrom osomal variability ) is obtained when X 2 '' achieves a value of 6 above its minimum, whic h yields z in the range 1.2906 to 1.1149, which translates to x in the range 0.2061 to 0.4503. Switching to the robust fit criteria of minimu m perce nt devi ati on, th e value of z is 1.231 7. Thus there seems to be good evidence to suggest that the long term effective population size of males is c onsiderably sm aller than that o f females du e to the “Geng h is K han” effect (that is , som e males leaving many more offspring than others, and, therefore causing a la rger fracti on of males t o leave no genes in future generations). In te rms of fit, the w orst fitting p atterns on chromosome X from the abov e fitting are SYF (sign ed devianc e + 32.7 ) , DN SF + 13.1, YFP + 11.1, NSYFHP - 10.2, DNSP + 8.4, FHP + 8.2, DNFH + 7.1, YFHP + 6.8, - DSYHP 6.2, and - FP 6.0. In contrast to the a utosomes, no ne of the prime archaic inter breeding patterns show up as substantial ly over expressed on X . Many of the devi ant patterns are unexpected, except for pattern NSYFHP which is under expressed and is compatible with the hypothesis that Denisova sw apped genes with H. erectus but at a markedly lower rate than on au tosome s , that is the “Ron J eremy hypoth esis .” Fitti ng chromosome X to the parameters of the minimum X 2 model wi th Neander thal mixin g we find the opti m al fit of 281.62 w ith z = 1.134673 ( 1.049165 - 1.223907 ). This translates to x = 0.2374 but includes the previous value of z and x in the confidence interval . Howe ver, the hypothesis that N m = N f is strongly rejec ted w ith p << 0.00 01 even allowin g for an inflation factor of 1.5 . Switching o f f the deviance from the patterns D P and DNP m akes little difference since they fit w ith the observed values on X with very well ( again consistent with the “ Ron Jeremy ” hypothesis). Finally, fitting with the same model as above but allowing for the finite sites m odel and a one cycle MS iterative correction , and mod elin g only the infor mativ e patt erns, the optimal fit is 269.46 wit h z = 1.137797 . This trans lates to x = 0.2422 and again inc ludes the previous value of z and x in the confidence interval. The hypothesis that N m = N f is still strongly rejected with p << 0.0001 , again all owing for an inflation factor of 1. 5. 3.13 A not e on P and D tests wi th f ini te s ite s mode ls When deal ing wit h the co alesc ent plu s th e in fi nit e site s mod el, a root ed 3 s pec ies tre e has some special pro perties similar to those a scribed to Bunem an (1971) fo r the 4 species unrooted distance tree. These properties are that the dominant source of gene flow is indicated by which of the patter ns 011 , 101 and 110 is maxim al. Un der any hierarchical coalescent, without reticulate events (inclu ding w ithin m embers of the same “species ”) , th e tw o le ss f requen t pa tterns should have equal expectation. That one is clearly m aximal and indicated by the “species tree” may be tested using the P 1 test of Wadd ell et al. (2000, 2001). W hether the oth er two are equa l may be Waddel l , Ramos and Xi (2011). S pectral An alysis of H omo den isova and relatives Page 38 tested with a binomial test, the P 2 test of W addell et a l. (2000, 20 01). If this te st is rejected th en, assuming there is no d ata processing bias, it is an indication of introgression. Another version of this tes t, usef ul w ith fre quency counts g reater than 5 or so, is to use an X 2 statistic . U sing the technique s above, this can be recalibrate d into a sc aled X 2 statistic to take into acc ount the effect of genetic linkage plus other unbiased fluctuations as m ight be caused by selection, etc. If f[011] > f[101] and f[110] then, assum ing no other violations of the basic m odel, the ex cess of f[11 0] over f[101] indicates the degree of introgression between lineages 2 and 3. As a proportion this is f[110] - f[101]/(f[110 ]]+f[101]). This latter quantity used by Reich et al. (2010) for example, is thus in timately related to the tests o f W addell et al. (2000, 2001) . O bviou sly, what w orks for a triplet can be extended to predict a larger structure, the basic principal behind Split Decompos iti on, for exa mple ( Bande lt and Dress 1 992 ) . It can also be readily exte nded to reticulate diagrams for populations, when it is recognize d that these d ecompose in to a set of weight ed trees , with members hip equal to 2 x , where x is the n umber o f reticulate ev ents (W addell 1995) . To extend the P and D stat ist ics to fini te sites models is highly desi rabl e. A robust approach to do this was developed in W addell (1995) and is redescribed here. The critical step is to use a H adama rd conjug ation (a form of discrete fast F ourier transform , Hend y and Pen ny 1993 ) to make corrections between sequenc e space and the idealized infinite sites or tree space . When deali ng wit h line age s that coale sce relativ ely quickly com pared to the num ber of new mutat ions per li neage , the n the H adam ard conjug ation is a convenie nt ap proximation at intermed iate probabilities of parallelism or convergen ce. When dealing with the complex mixtu res of weight ed trees ge nerat ed by coales cent patt erns , it is even mor e appea ling as no more computational effort is needed. One apparent alter native is to discretize w eighted tree space into segments, conjugate (transform) them separately and reassem ble them , this will improv e the approximation in some cases . The conjugation on four species can be run either from sequence space to tree space , in which ca se the P- statistic can be likened to ! 5- ! 6 in the above exam ple. The significance of this difference, under an i.i.d. model , can be estimated by derivi ng the variance covariance matrix ( Wadde ll et al. 1994) of the transformed data . This may be called a finite sites P 2 statistic. In the same w ay a finite sites D stat ist ic may be defined as ! 5 - ! 6 / ( ! 5 + ! 6). This is fine in many circumstances as long as ne ither is substantially n egative . When oth er param ete rs of th e mod el are desir ed to be optim ize d at the sa me time , i t i s often more convenient to run the model in the direct ion gamma to s equence space and use a deviance s tatistic to m easure d iscord. Using the KL d eviance statistic, then the me thod is M L under certain assumptions. With a non - ins tant coalesc ence at splits, a true ML solution req uires discretizat ion of tree space . One such app roxima tion is d escribe d in W addel l et al. (2001) . A close approximation to the ML solution is obtained via the Hadamard conjugation as described above. The sign ificance of the result may be estimated using a likelihood ratio statistic (taking into accou nt the fact th at both ! 5 and ! 6 may have a bounda ry a t z ero enforced , Ota et al. 2 000) . 3.14 Solving f or ancestral populati on sizes It is pos sible to e stimate a pproximate ancestral effec tive pop ulation siz es using the metho ds in Wadd ell (1 995) . These req uire an estim ate of the duration of each internal edge of th e tree in te rms of the number of gener ations. Follow ing this we have x + 1 unknowns and x different equations. The extra unknown is the effective population size at the root of the tree. In Wa ddell (1995) this was dealt with with the assumption that the c omm on ancestor of human, chimp and gorilla had the sam e ef fective population size as that of human and chimp. Here there are multiple descendant lineages, so where to put such a const raint is less obvious. The alter native is to p lot o ut the estimated e ffective pop ulation size alon g in ternal edges of th e tre e f or a r ange of values of t he ancestral population si ze (Nr). Waddel l , Ramos and Xi (2011). S pectral An alysis of H omo den isova and relatives Page 39 Estimati ng the mean divergenc e times of populati ons given multi ple sources of error, including divergence time calibration uncertainties, edge length errors, unkn own ances tral population sizes, fluctuating m utation rates, deviat ions from a sin gle tree spectrum due to differing gene trees , a nd m odel misspe cifi cation all make divergence time estimation particularly challenging (Waddell 1995). Firstly, the estimat es of the duration of internal edges of the genome on the species gene tree in re al tim e need to be m ade, then transf ormed into n umbers o f generations. With the curre nt dat a , t o make estimates in real time is complicated by the fact that there has been reticulatio n in the tree, most nota bly the Neande rthal and Deniso va n intro gression events . A cautious app roach to this problem involves selecting specific pair wise dist ances over others that are expected to be m ore distorted by reticulate events . Th ere is a lso an issue of appreciable quantities o f sequencing error, although the table S6.2 of Reich et al. (2010) makes a correction for these to pairwise distances . The divergence of N eanderthal and Denisova genes is set at 644k years ago (appa rently unaffected by gene flow with later species, but perhaps distorted by earlier gene flow). Africans split from the se archaics about 810 k ago (based on the average of the YN , YD , SN and S D dis tance pairs) . San split from other humans about 593k ago (using the SY distance ). T he split of Yoruba from non - Afric ans is set at about 520k ago (a bit less than the YF and YH pair s to compe nsat e for the Neander thal gene inf low). The spl it of Pa puan and Ha n is set at 403k, but this is alm ost certainly biased up wards by u p to 10% of archaic gene s, and is barely older than the split of the French and Han pair. A more realistic number for H P might be 380k. It seems safer to set the earlier F(HP) time using the (very) appro ximate 20 ,000 year gap in evidence of modern human in western versus eastern Asia based on archaeology. Next, it is necess ary t o esti mat e the average generation time. W addell (1995) gives a range of g eneration times for m odern huma ns o f 18 to 25 years. Recent assessment s of genealogies by Matsu mura and Forster (2008 ) indicate generatio n times for Eskimos closer to 30 years and chimps at 19 and 24 years. There is evidence that earlier hominin populations had relatively few me mbers survivin g over 40 years (Trink aus et al. 2011, who ide ntify 45 versus 14 archaic adults under and over 40, w hile upper Paleolithic moderns are reported at 36 versus 13, for a Fisher’s exact 2 tailed test result of p = 0.82 or even more hom ogeneous than the original aut hors noted). Thus it would s eem appropriate to take a mean generation time estimate of earlier humans in the range o f 20 to 30 years , w ith 25 years as perhaps a reasonable m ean. Thus we arrive at durations of the i nternal edges of the species tree at t 5 = 166,000 years or 3320 generations , t 4 = 220,000 / 4400 , t 3 = 60,000 / 1200 , t 2 = 130,000 / 2600 and t 1 = 25,000 / 500 . The hie rarchic al coa lescent models edge lengt hs are measure d on units of generations divided by twice the effective population size (for autosom es in a diploid). We need to calculate how these relate to gene splitting times. Thus we come to a series of equations. For example, the difference in the splitting times of gene s ac ross th e ro ot no de v ersus the ancestral node of mod ern humans i s e qual to N r + g 4 N 4 – (p 4 c 4 N 4 + (1 -p 4 )N r + (1 -p 4 )g 4 N 4 ) or – p 4 c 4 N 4 + p 4 (N r +g 4 N 4 ). Here p 4 is th e prob ability of coalesc ing on edge 4, that is p 4 = ( 1 ! e ! g 4 ) , while c 4 is th e expe cted tim e it takes to coa lesce alon g edge 4 w hich is eq ual to c 4 = ( p 4 ! g 4 e ! g 4 ) / p 4 = (( 1 ! e ! g 4 ) ! g 4 e ! g 4 ) / ( 1 ! e ! g 4 ) . At the other extreme , fo r genetic divergences towards the tips of out species tree , the diffe rence of d istances m easu red at the n ode above and below edge 1 is equal to p 1 c 1 N 1 + (1 -p 1 )p 2 (c 2 N 2 +g 1 N 1 ) + … . While the distance measu red acr oss th e n ode below are equal to p 2 (c 2 N 2 +g 1 N 1 ) + … . The se altern ating terms mostly cancel when the first term is subtracted from the second term to give d 2 – d 1 = - p 1 c 1 N 1 + p 1 p 2 (c 2 N 2 +g 1 N 1 ) + p 1 (1 -p 2 )p 3 (c 3 N 3 +g 2 N 2 +g 1 N 1 ) + p 1 (1 -p 2 )(1 -p 3 )p 4 (c 4 g 4 +g 3 N 3 +g 2 N 2 +g 1 N 1 ) + p 1 (1 - p 2 )(1 -p 3 )(1 -p 4 )(N r +g 4 N 4 +g 3 N 3 +g 2 N 2 +g 1 N 1 ). This series of non - linear equations is best solved simultaneously as, logically, each solution of an ancestral population size at a h igher node affects the values f or each low er nod e. The num bers used above yield edge length durations on the m ain species tree of approximately ((D,N):164:0.26 7,(S,(Y,(F,(H,P):20 :0.027):120:0.17 1):73:0.093):217 :0.342) Waddel l , Ramos and Xi (2011). S pectral An alysis of H omo den isova and relatives Page 40 (where the first number is th e duration of the edge in th ousands of years and the second nu mber is the g edge length ) . A ssuming an ancestral population size of 20,000 gene copies, then s olving these equations, the in ference of the an cestral gene population sizes on the tree turn out to be ((D,N):15,400 ,(S,(Y,(F,(H,P):18,60 0):17,500):19,60 0):15,800), und er these v aried assu m ptions (that we have moderately accurate relative diverg ence time s, the assum ed gen eration times are correct and the assum ptions used in estimating g 1 -g 5 ). Even taking the most distinct values of g 1 - g 5 obtained under the best fitting G 2 ’’ mo del o f 0.029 56, 0.17743, 0.09573, 0.35100 and 0.27947, the estimated population sizes are little different a t ((D ,N):14,7 00,(S,(Y ,(F,(H,P ): 16,900): 16,900):19,100): 15,500). These ancestr al populat ion size numbers are all sur prising ly similar, which is hard to reconcile with the out of Africa event, for example (which here is shown as a minimal reduct ion in effective p opulation s ize from 1 9,600 to 17 ,500). T he com plex mixing of genes near th e out of Afric a event , along w ith som e relatively short and poorly estimated edge length s (such as that of HP) that migh t be off by a facto r of 2 or mor e (if modern huma ns expa nded from west to east Asia in 10,000 years of le ss as is possibl e give n the vagari es of the archeological evidence) and also potentially high data error rates. T he more ancient parts of the tree would seem more likely to b e s table to these effects, so that the po pulations of m odern humans and the archaic ou t o f Afric a (N and D) wou ld s eem t o be roug hly simil ar. 4 Discussion Overal l, the fit tin g shows th at a hi erar chical structured coalescent m odel with at least two introgressio n ev ents between archaic hum ans and out of A frica Moderns leads to a substantial increase in f it. Overall fit h oweve r, is still far far w orse than could be e xpected. It s eems that to im prove the fit a number of factors may come into play. Firstly, there are too many priva te N H, NF and NP p atterns. Secon dly, the latter o f th ese, NP, seems m arkedly less than the f ormer two. Thirdly, there may be to o many sequencing/a lignmen t e rrors in the present data to confidently move towards refining so many parameters and the overall fit. The marked improve ment in fit w hen a f inite sites mo del is emp loyed is co nsistent w ith this. One model that may do a better job of describ ing the data with fewer par ameters is independ ent mixing of N eandertha l genes w ith Han and Fre nch, but to a nearly ide ntical total degree. Also, lesser mixing of Neanderthal genes into Papuan , m ade up for by a la rger prop ortion of archaic alleles in Papuans coming f rom the mixin g w ith an arch aic th at is only sligh tly clo ser to De nisova than to Nea nderthal. This w ould in t urn suggest that the mixing with Neanderthals was not purely right out of Afri ca and it wa s not a single event. Instead , there may have been opportunity for European ancestors to pick up Neanderthal alleles , in the unkno wn p art o f E urasia they existed in prior to m oving into Euro pe, ditto and indepe ndently fo r the ancestors of the East Asia ns, while Papuan ancestors moved fairly rapidly through the zone of classical N eanderthals and picked up most of their archaic genes in the Indonesian region. The form of this ancestral population may have been about equally related to Neanderthals and Denisovans, but may also have had an appreciable proportion of even earlier (e.g., Homo erect us genes) in its genome. This last p oint c omes up in a num ber of analy ses in c lu ding the resampled NeighborNet and the finite sites mo del , b ut confirmatio n is dif ficult as the ra te of se quenc ing / ass embly e rror could be having a simil ar effect. Closin g with r eference to the quotations of Darwin in th e intr oduction , it is interestin g to ponder further the question of which human lineages are different species. In almost all ways, moder n human linea ges meet the defin iti ons of bein g at most diff ere nt races of the same species, and some would argue much closer to simply different populations. In term s of time sin ce origin, genetic distances, and fertile interbreeding, modern humans clearly constitute w hat any biologist would call a single species. Th e question of whether Neanderthals and Denisovans should be considered the same species is less clear, but again many would argue that they too might be Waddel l , Ramos and Xi (2011). S pectral An alysis of H omo den isova and relatives Page 41 included in the s ame species. How ever, by o ne species criteria little con sidered, we may not always behave as one species. This is the rate and / or amount of gene flow between hominid populations when they become sympatric. It seems that in the case of arch a ic hom inids the ou t of Afric an moderns were in iti ally a very sma ll group (perhaps wit h an eff ecti ve population size of less than 100 0) that mana ged to replac e all the archaic h ominids in E urasia (prob ably num bering at least in the tens of thousands , and su ppose dly fair ly well adapte d to th eir hab itats ) . Th at only 2- 5% of archaic genes survived genes over all , and this poten tially re stricted to a rela tively fe w mati ngs ear ly on , sug gests a rea l w hitewas h o f the arch aics. It is v ery unclear if this is the behavior excepted of the same s pecies genes when different populations come into contact. Fortunatel y, large scale genom ic sequencing and advancin g method s of phylogen etic - population genetic analysis should allow a clear answer to the qu estion o f how typically populations of Homo act in terms of gene flow in comparison to other Primate species in particula r . Ominously, the replace ment of archa ic homin i ds w ith minimal interbreed ing d oes n ot seem so far from wh at has happen ed in our own recent history, fo r exam ple w hen cultured w hite Austr alia ns encount ered a relati vely large stable popula tion of Tasmania n Ab origines and completely replaced them by means of w ar and disease in a few generations with almost no interbreedin g. It is interesting to ponder if that is th e beha vior ex pected of memb ers of the same species , o r if we need to recognize more clearly the ge netic ways in which we do not behave as member s of t he same sp ecie s . Darwin hi mself seeme d very unsur e on t his q uesti on, and we a t la st have the opport unity to l ook at it in unflinchi ng detail. Acknowledgements This w ork was supporte d by NIH grant 5R01LM0 08626 to PJW. Thanks to Dick Hudson, Nick Patte rson, David Br yant, Mart in Kirc her, Hiro Kis hino and Dave Swofford for helpful disc ussions and assistance with soft ware . Author contributions PJW originated the resea rch, developed methods, gathered data, ra n analyses, interpreted analyses , prepared figu res and wrote the manuscript. XT implemented methods in C and PERL, ran analyses, prepared figures, interpreted analyses and commented on the manuscript. JR implemented the 7 - taxon single tree hierarchical coa lescent calculation s for the infin ite sites mod el in Excel . References Agrest i A. 199 0. C atego rica l da ta a nalys is. New Yo rk: John W iley and sons. Bandelt , H. - J., and A.W.M . Dress. (1992). Split d ecomposition: A new and useful appro ach to phylogenetic ana lysis of di stance data. Mol. Phyl. Evol. 1: 242 - 252. Bryant, D., and V. Moulton. (2004 ). NeighborNet: an agglomerati ve algorithm for the construction of planar phylogeneti c networks. Mol. Biol. Evol. 21:255 – 265. Bryant, D., and P.J. Waddell. (199 8). Rapi d evaluati on of least squares and minimum evolution criteria on phylogenetic trees. Mol. Biol. Evol. 15: 1346 - 1359 . Buneman, P. (1971). The recover y of trees from measure s of dissimil arity . In Mathematic s in the Archae ologi cal and Historic al Scien ces (ed. F. R. Hodson, D. G. Kendall, and P. Tautu), p. 387 - 395. Edinburgh University Press. Darwin , C. (187 1). The descen t of Ma n, and se lection in relation to sex. Joh n Mu rray, Lo ndon. Green, R.E. et al., A dra ft seque nce o f th e Nea ndert hal genome”. Science 328, 710 (2010) . Waddel l , Ramos and Xi (2011). S pectral An alysis of H omo den isova and relatives Page 42 Greena cre, M. J . (2007 ). Co rrespondence Analysis in Practice, second edition . Chapma n Hal l , London . H endy , M.D ., and D. P enny . (1993). Spectr al analysis of phylo genetic data . J ournal of Classi ficat ion 10: 5 - 24. H udson , R.R. (1992) . Gene tree s, species trees and the segregation of ancestral alleles. Gen etics 131: 509 - 512. Hudson, R. R. (2002) Genera ting samples unde r a Wright - Fis her neutral model of genet ic variation. Bioinformatics 18: 337 - 338. Huson, D.H., and D. Br yant. (200 6). Ap plic atio n of phylogenetic networks in evolutionary studies. Mol. Biol. Evol., 23: 254 - 267. Ihaka R, Gentleman R. 19 96. R: a language for data analysis and graphic s. J . Comput . Gr aph . Stat. 5:299 – 314. Jensen - Seaman, M. I., T. S. Furey, B. A. Payseur, Y. Lu, K. M. R os kin, C - F Chen, M . A. Thomas, D . Haussl er and H. J. Jacob. (2004). Compara tive Recombination Rate s in the Rat, Mouse, and Huma n Genomes . Genome Res. 14: 528 - 538. Krause , J. et al., The comple te mi tocho ndri al DNA g enome of an unknown hominin from southern Si beria. Nature 464, 894 (2010). Mats umura, S. and P. Fors ter. (200 8). Gene rat ion time and the effec tive popul ation siz e in pol ar eskimos. Proc. R. Soc. B 275:1501 - 1508 . Ota, R., P.J. Waddell, M. Hasegawa, H. Shimodai ra, and H. Kishin o. (2000). Appropri ate likelihood ratio tests and mar ginal d istributions for evolutio nary tree models with constraints on parameters. Molecular Biology and Evolution 17: 798 - 803. P enny , D., M.A . S teel , P.J. W addell , and M.D. H endy . (199 5). Impro ved analy ses of huma n mtDNA sequ ence support a recent African origin for Hom o sapiens. Molecular Biology and Evolution 12: 863 - 882. R Development Core Team. 2005. A language and environmen t for statisti cal computin g [Internet]. V ienna (Austria): R Fo undation for S tatistical Co mputing. [c ited 2006 De c31]. Avail able fro m: htt p://www.R - project.org . Reich D, et al. (2010) . Genetic history of an arch aic homini n group from Deni sova Cave in Siberia. Nature . 468 :105 3 - 1060. Reich D, Patt erson N, Kirc her M, Delfi n F, Nandi neni MR, Pu gach I , Ko AM, Ko YC, Ji nam TA, Phipps M E, Saitou N, W ollstei n A, Kayser M, Pääbo S, Stoneking M. (2011). Denisova admixture and the first modern human dispersals into Southeast Asia and Oceania. Am . J Hum . Genet. 89 :516 -5 28. Ruv olo , M. (1997 ). Molec ular p hyl ogen y of the hominoi ds: i nfe ren ces fro m mul ti ple ind epe nden t DNA seq uence data set s. Mol . Biol . Evol. 14 :248 -2 65. S teel , M .A., L. S zekeley , P.L . E rdos , AND P .J. W addell . (1993 ). A complete family of phylogenetic invariants for any number of taxa under Kimura's 3ST model. New Zealand Journal of Botany (Conference Issue) 31: 289 - 296. S teel , M .A., and W addell , P.J. (1 999). Appro ximatin g Like lihoods Und er Lo w bu t Varia ble Ra tes Across Sit es. Appl ied Maths Letters 12: 13 - 19. Swoffo rd, D.L. (2000). Phylogenetic Analy sis Using Parsimony (*and Other Method s), Version 4.0b10. Sinauer Associates, Sunderland, Massachuset ts. Waddel l , Ramos and Xi (2011). S pectral An alysis of H omo den isova and relatives Page 43 Swofford, D.L., G .J. Olsen, P.J. W addell, and D.M. Hilli s. (1996). Phylogenet ic Inference. In: "Molecular Systematic s, second edition" (ed. D. M. Hillis and C. Moritz), pp 450 - 572. Sinauer Ass oc, Sunderl and, Mass. Trinkaus , E. (2011) . Late Ple istocen e adult mort ality patterns and modern human establ ishment. Proc . Natl Acad . Sci . U S A. 1 08:12 67 - 1271. Wadd ell , P. J. (1995 ). Statistical m ethods of phylogenetic analysis, including Hadam ard conjugations, LogDet transforms, and maximum likelihood. PhD Thesis. Massey Univer sit y, Ne w Zeal and. Wadd ell , P. J., and A. Azad. (2009) . Res ampl ing R esi duals : R obu st Estima tors of Er ror an d Fit for Evoluti onary Tr ees and Phylogeno mics. a rXiv 0912 .5822_09, pp 1 - 29. Wadd ell , P. J., A. Aza d and I. Kha n. (20 11). Res ampl ing Resi dua ls on Phy log ene tic Tree s: Extended Results . arXi v (Quanti tati ve Biolo gy) 1101. 0020, pp 1 - 9. Wadd ell , P. J., I. Kh an, X. Tan, and S. Yoo. (2010) . A Unified Framework for Trees, MDS an d Planar Gra phs. arXi v (Quantit ative Biology) 10 12.5887, pp 1 - 14. Wadd ell , P.J. , H. Kish ino , an d R. Ot a. ( 2000 ). Sta tis tical tes ts for SI NE data a nd th e res oluti on of species trees. Research Mem ora ndum 770, pages 1 - 18, The Institute of Statisti cal Math emat ics, Tok yo. Wadd ell , P.J ., H. Kishi no, an d R. Ota. (2001 ). A ph ylo genet ic f oundat ion f or c ompara ti ve mammali an genomi cs. Geno me I nfor matic s Se rie s 12 : 14 1 - 154. W addell , P.J., H. K ishino, an d R. O ta . (200 2) Very Fast Algor ithms for Evalua ting the Stability of ML and Bayesian Phylogenetic Trees from Sequence Data. Genome Informatics 13: 82 - 92. Wadd ell , P.J ., H. Kishi no an d R. Ota. (2 007 ). Phy logene tic Method ology For Detec ting Prot ein Complexe s. Mol. Bi ol. Evol. 24: 650 - 659 . W addell , P.J., and D. P enny . (199 6). Evolutio nary trees of apes and hu mans fro m DNA sequences. In: "Handbook of Symbolic Evolution", pp 53 - 73. Ed. A.J. Lock and C .R. Peters. Clarendon Press, Oxf ord. W addell , P.J., D. P enny , M.D . H endy , and G. A rno ld . (1994). The samplin g distributions and covariance m atrix of phylogenetic spectra. M olecular B iology and Evolution, 11: 630 - 642. W addell , P.J., D. P enny , and T. M oore . (1 997). Extendin g H adam ard c onjuga tions to mo del sequence evo lu tion w ith va riable ra tes acr oss sites . Mo lecular Phylogenetics and Evoluti on 8: 33 - 50. Wadd ell , P. J. , X. Tan and I. Kha n. ( 2010). W hat u se are Expon ential Weig hts for flexi - Weig hted Least S quares Phylogenet ic Tre es? ar Xiv (Quant itati ve Biol ogy) 101 2.588 2, pp 1 - 16 .
Original Paper
Loading high-quality paper...
Comments & Academic Discussion
Loading comments...
Leave a Comment