TEMANEJO - a debugger for task based parallel programming models
We present the program Temanejo, a debugger for task based parallelisation models such as StarSs. The challenge in debugging StarSs applications lies in the fact that tasks are scheduled at runtime, i.e dynamically in accordance to the data dependencies between them. Our tool assists the programmer in the debugging process by visualising the task dependency graph and allowing to control the scheduling of tasks. The toolset consists of the library Ayudame which communicates with the StarSs runtime on one side and of the debugger Temanejo on the other side which communicates with Ayudame. Temanejo provides a graphical user interface with which the application can be analysed and controlled.
💡 Research Summary
The paper introduces Temanejo, a dedicated debugger for task‑based parallel programming models such as the StarSs family (including SMPSs, OMPSs, CellSs, GPUSs, GridSs, etc.). In these models, parallelism is expressed through data dependencies rather than explicit scheduling, which makes traditional line‑oriented debuggers inadequate because the runtime decides when each task runs based on the availability of its inputs and outputs.
Temanejo consists of two tightly coupled components. The first is a lightweight C library called Ayudame. During compilation, the programmer annotates functions with StarSs pragmas (e.g., #pragma css task input(a) inout(b) output(c)). The compiler wrapper inserts calls to Ayudame at key runtime events: initialization, task creation, task execution, and completion. Each event triggers the transmission of a small packet (typically eight integers) containing an event identifier, task identifier, dependent task identifiers, memory addresses of the dependencies, function identifier, thread identifier, and a timestamp. This information is sent over a socket to the debugger.
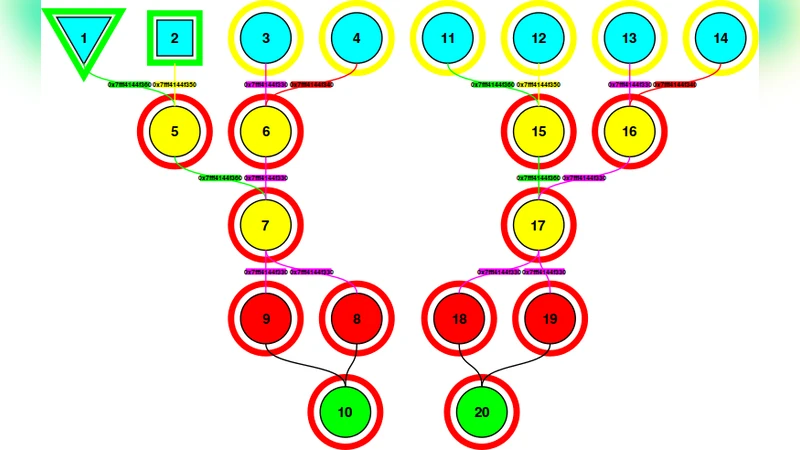
The second component is the Temanejo debugger itself, written in Python. It uses NetworkX to maintain an internal directed graph where nodes represent tasks and edges represent data‑dependency relationships. PyGTK provides the graphical user interface. As soon as Ayudame delivers a packet, Temanejo updates the graph in real time, assigning visual attributes to nodes and edges: node colour indicates task status (not queued, queued, running, finished), node margin colour signals whether dependencies are satisfied, node shape encodes the worker thread that owns the task, and edge colour encodes the memory address of the dependency. This multi‑dimensional visual encoding allows developers to instantly see the overall structure of the computation, identify bottlenecks, and understand why a particular task is still waiting.
Beyond visualization, Temanejo offers several interactive control mechanisms. A user can right‑click a node to add it to a “to‑be‑blocked” list maintained by Ayudame; worker threads consult this list before dequeuing a task, effectively preventing the selected task from ever being scheduled until the user removes it from the list. A global stop flag can be set to pause the entire application, causing all idle threads to remain idle even if tasks are ready. Priority manipulation leverages SMPSs’s “critical” queue: by marking a task as high‑priority (via a pragma or through the GUI), the task is placed in a special queue that workers prefer, allowing the programmer to force early execution of selected tasks. At the moment, Temanejo cannot re‑queue a task that is already in a normal queue, but this feature is slated for future releases.
Temanejo also integrates the GNU Debugger (gdb). The user may launch a separate gdb terminal at any point, or specify a function in the GUI where gdb should automatically set a breakpoint. When execution reaches that function, gdb takes control, enabling line‑by‑line inspection while the rest of the application remains under Temanejo’s supervision.
Task duration analysis is another built‑in feature. Upon task completion, Temanejo records the elapsed time and maps it to a colour gradient on the node. Although the communication overhead makes these timings only approximate, they provide a quick visual cue about load imbalance: tasks that are too short (sub‑100 µs) cause excessive runtime overhead, while overly long tasks lead to idle workers. The colour coding helps developers spot such anomalies without resorting to a full‑blown profiling suite.
The authors discuss the current limitations and outline a roadmap. Planned enhancements include richer graph analytics (longest/shortest path extraction, automatic priority recommendations), subgraph highlighting or greying‑out, dynamic manipulation of the runtime queues (including moving tasks between queues), the ability to change the number of worker threads on the fly (enabling temporary serialization), and support for alternative debuggers beyond gdb. They also envision configuration files that prescribe a deterministic execution order (e.g., reproduce a previous run or enforce a custom order).
In summary, Temanejo provides a practical, open‑source solution for debugging task‑parallel applications. By visualizing the dependency graph while the program runs, allowing interactive control over task scheduling, and offering seamless gdb integration, it addresses the core challenges posed by dynamic, data‑driven parallelism. Although still in active development, version 0.5 already delivers substantial functionality for SMPSs and OMPSs users, and the proposed future work promises to make it an even more powerful aid for developers tackling complex, large‑scale parallel codes.
Comments & Academic Discussion
Loading comments...
Leave a Comment