Non-alignment comparison of human and high primate genomes
Compositional spectra (CS) analysis based on k-mer scoring of DNA sequences was employed in this study for dot-plot comparison of human and primate genomes. The detection of extended conserved synteny regions was based on continuous fuzzy similarity rather than on chains of discrete anchors (genes or highly conserved noncoding elements). In addition to the high correspondence found in the comparisons of whole-genome sequences, a good similarity was also found after masking gene sequences, indicating that CS analysis manages to reveal phylogenetic signal in the organization of noncoding part of the genome sequences, including repetitive DNA and the genome “dark matter”. Obviously, the possibility to reveal parallel ordering depends on the signal of common ancestor sequence organization varying locally along the corresponding segments of the compared genomes. We explored two sources contributing to this signal: sequence composition (GC content) and sequence organization (abundances of k-mers in the usual A,T,G,C or purine-pyrimidine alphabets). Whole-genome comparisons based on GC distribution along the analyzed sequences indeed gives reasonable results, but combining it with k-mer abundances dramatically improves the ordering quality, indicating that compositional and organizational heterogeneity comprise complementary sources of information on evolutionary conserved similarity of genome sequences.
💡 Research Summary
The authors present a novel alignment‑free method for whole‑genome comparison that relies on compositional spectra (CS) analysis of k‑mer frequencies. Using human and four high primates (chimpanzee, gorilla, orangutan, and macaque) they divide each genome into 1 Mb non‑overlapping segments, treating each segment as a point in a high‑dimensional feature space. Four distance measures are calculated for every pair of segments: (i) Euclidean‑type distance based on the Spearman rank correlation of 10‑mer frequencies (4‑letter alphabet, allowing up to two mismatches), (ii) the same for 6‑mers (exact matches only), (iii) a distance based on 20‑mers in a purine‑pyrimidine (2‑letter) alphabet, and (iv) absolute difference in GC content. The combination of these four metrics yields a distance matrix that captures both compositional (GC) and organizational (k‑mer) heterogeneity.
To visualise similarity, the authors adapt the classic dot‑plot into a “mdot‑plot” that works with continuous distance values. Local minima in the distance matrix are identified as candidate similarity points (the T‑sets). By intersecting the T‑sets derived from the four distance measures they define increasingly stringent criteria (T₁ through T₄). Tracks—sequences of points that run roughly parallel to the main diagonal (the bisector) of the plot—are interpreted as extended regions of conserved synteny. Tracks shorter than four points are discarded to reduce random noise.
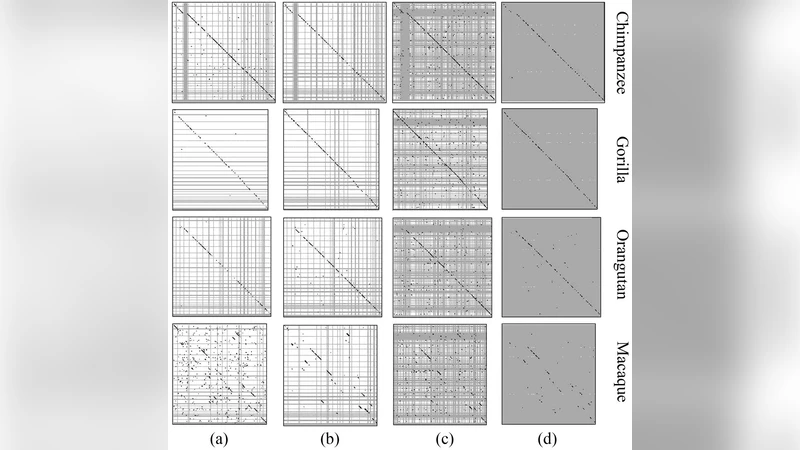
The method is applied to four types of sequence data: (a) the raw whole genome, (b) the genome with repetitive elements masked, (c) the genome with protein‑coding genes masked, and (d) the residual “dark matter” after masking both repeats and genes. In all four data sets, human–chimpanzee, human–gorilla, and human–orangutan comparisons display a dense concentration of long tracks (≥ 4 points) along the diagonal, confirming that the CS‑based approach recovers the well‑known chromosome‑level synteny even when coding and repetitive sequences are removed. This demonstrates that non‑coding, non‑repetitive DNA retains a strong phylogenetic signal detectable by k‑mer composition.
The human–macaque comparison initially shows scattered tracks, reflecting the greater evolutionary distance and known chromosomal rearrangements. By reordering macaque chromosomes according to the positions of the tracks, the authors achieve a diagonal‑centric mdot‑plot that mirrors the ordering obtained by traditional microsatellite‑based synteny mapping (Rogers et al. 2006). This re‑ordering validates that the CS‑derived distance matrix captures genuine large‑scale rearrangement information, not merely random similarity.
Statistical analyses of track length distributions reveal that the probability of obtaining long tracks by chance is extremely low. When the most stringent criterion (T₄, requiring coincidence in all four distance measures) is applied, short tracks (length = 4) drop dramatically (over 200‑fold reduction outside the diagonal zone), while long tracks (length ≥ 10) remain concentrated near the diagonal. This demonstrates that the combination of multiple distance metrics dramatically improves signal‑to‑noise ratio.
Importantly, the “dark matter” analyses (masked repeats and genes) produce track length histograms and diagonal concentrations that closely resemble those of the full‑genome comparisons, albeit with slightly shorter tracks due to the reduced segment size after masking. This finding suggests that the evolutionary imprint of genome organization is encoded not only in coding regions or obvious repeats but also in the subtle composition of the remaining sequence.
In summary, the study shows that (1) k‑mer based compositional spectra, when coupled with GC content, provide a powerful alignment‑free metric for detecting conserved syntenic blocks across large evolutionary distances; (2) the method works robustly on both coding and non‑coding portions of the genome, revealing phylogenetic signal in the so‑called genomic “dark matter”; (3) the mdot‑plot framework, especially with intersected T‑sets, offers a quantitative way to filter out random similarity and highlight genuine large‑scale genomic correspondence; and (4) the approach can even infer chromosome re‑ordering consistent with independent cytogenetic data. The authors propose that this pipeline could be extended to a broader range of taxa, refined by optimizing k‑mer length and alphabet choice, and integrated with functional annotation to explore the biological relevance of the conserved non‑coding architecture.
Comments & Academic Discussion
Loading comments...
Leave a Comment