Discovering Network Structure Beyond Communities
To understand the formation, evolution, and function of complex systems, it is crucial to understand the internal organization of their interaction networks. Partly due to the impossibility of visualizing large complex networks, resolving network structure remains a challenging problem. Here we overcome this difficulty by combining the visual pattern recognition ability of humans with the high processing speed of computers to develop an exploratory method for discovering groups of nodes characterized by common network properties, including but not limited to communities of densely connected nodes. Without any prior information about the nature of the groups, the method simultaneously identifies the number of groups, the group assignment, and the properties that define these groups. The results of applying our method to real networks suggest the possibility that most group structures lurk undiscovered in the fast-growing inventory of social, biological, and technological networks of scientific interest.
💡 Research Summary
The paper introduces a novel visual‑analytics framework for uncovering “structural groups” in complex networks—clusters of nodes that share common topological or spectral properties beyond the traditional notion of densely connected communities. The authors argue that existing community‑detection methods focus almost exclusively on link density, which leaves many meaningful partitions undiscovered, especially in large networks where visual inspection is infeasible.
To address this, each node is first described by a 28‑dimensional feature vector comprising local measures (degree, clustering coefficient, average neighbor degree, betweenness, subgraph centrality, etc.) and global spectral descriptors (components of Laplacian and normalized‑Laplacian eigenvectors). All features are normalized to the unit interval, thus embedding the network in a 28‑dimensional unit hyper‑cube.
The core idea is to exploit the human visual system’s ability to detect patterns in low‑dimensional projections. The algorithm randomly selects a two‑dimensional subspace of the feature space, projects all node points onto it, and presents the scatter plot to a user through an interactive graphical interface. For each projection the user either (i) rejects it as uninformative, or (ii) declares visible groups and assigns a group label to every node. This process is repeated for L random projections (the paper uses L = 30).
Each node i therefore accumulates a “group‑assignment vector” a(i) = (a₁(i),…,a_L(i)), where a_ℓ(i) is the label given in projection ℓ (or a null value if the projection was rejected). The similarity between two nodes is measured by the Hamming distance between their assignment vectors, i.e., the number of projections in which the user placed them in different groups. A single‑linkage hierarchical clustering is then performed on these vectors. Cutting the resulting dendrogram at a Hamming distance d yields a partition of the network.
To decide the appropriate cut, the authors define a quality metric Q_g that compares the average inter‑group Euclidean distance to the average intra‑group spread, normalized to remove dependence on the number of groups K. Plotting Q_g as a function of the cut distance typically shows a sharp drop; the “Q_g drop‑off” point is taken as the optimal threshold, and the corresponding number of clusters K is reported as the number of structural groups.
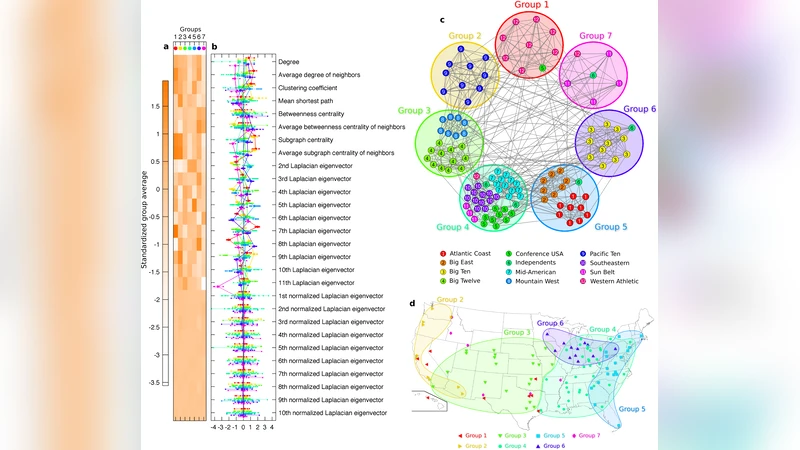
The method is evaluated on six real‑world networks of varying size and domain (Zachary’s karate club, political books, word adjacency, college football, scientific collaboration, and a human disease network). In each case the algorithm discovers 2–7 structural groups, often requiring only a few (2–15) of the 28 features to produce a two‑dimensional projection where the groups become visually separable. For some networks, simple projections onto Laplacian eigenvectors suffice, indicating that the discovered groups overlap with density‑based communities; for others, a richer combination of local and spectral features is essential.
Benchmark experiments on synthetic networks consisting of two planted groups with differing internal degree distributions further compare the visual‑analytics approach against state‑of‑the‑art community detection (modularity maximization, mixture models) and standard clustering (K‑means, kernel K‑means, PCA‑based reductions). Performance is quantified by the Adjusted Rand Index (ARI). The human‑in‑the‑loop method achieves near‑perfect ARI for inter‑group connection probabilities p_out ≤ 0.15 and maintains superior accuracy even as p_out increases, whereas the purely algorithmic methods deteriorate rapidly. Replacing the human with K‑means on the two‑dimensional projections improves over direct K‑means on the full feature space but still falls short of the human‑guided results, underscoring the advantage of multiple random projections combined with visual intuition.
Key strengths of the approach include: (1) leveraging human pattern recognition to detect non‑linear, multi‑feature separations that unsupervised algorithms miss; (2) amplifying the probability of successful separation by aggregating many low‑probability random projections; (3) providing an interpretable set of defining features for each discovered group. Limitations are acknowledged: the need for human interaction restricts scalability to very large graphs, and the reliance on a predefined feature set may overlook hidden attributes. The authors suggest future work on automated feature selection, statistical validation of the resulting partitions, and semi‑automated interfaces to reduce user workload.
In summary, this study demonstrates that integrating visual analytics with high‑dimensional network descriptors enables the discovery of previously hidden structural groupings beyond traditional communities, offering a powerful tool for the analysis of social, biological, and technological networks.
Comments & Academic Discussion
Loading comments...
Leave a Comment