📝 Original Info
- Title: OS Debugging Method Using a Lightweight Virtual Machine Monitor
- ArXiv ID: 0710.4635
- Date: 2011-11-09
- Authors: Researchers from original ArXiv paper
📝 Abstract
Demands for implementing original OSs that can achieve high I/O performance on PC/AT compatible hardware have recently been increasing, but conventional OS debugging environments have not been able to simultaneously assure their stability, be easily customized to new OSs and new I/O devices, and assure efficient execution of I/O operations. We therefore developed a novel OS debugging method using a lightweight virtual machine. We evaluated this debugging method experimentally and confirmed that it can transfer data about 5.4 times as fast as the conventional virtual machine monitor.
💡 Deep Analysis
Deep Dive into OS Debugging Method Using a Lightweight Virtual Machine Monitor.
Demands for implementing original OSs that can achieve high I/O performance on PC/AT compatible hardware have recently been increasing, but conventional OS debugging environments have not been able to simultaneously assure their stability, be easily customized to new OSs and new I/O devices, and assure efficient execution of I/O operations. We therefore developed a novel OS debugging method using a lightweight virtual machine. We evaluated this debugging method experimentally and confirmed that it can transfer data about 5.4 times as fast as the conventional virtual machine monitor.
📄 Full Content
OS Debugging Method Using a Lightweight Virtual Machine Monitor
Tadashi Takeuchi
Hitachi Systems Development Laboratory, Japan
t-takeu@sdl.hitachi.co.jp
Abstract
Demands for implementing original OSs that can
achieve high I/O performance on PC/AT compatible
hardware
have
recently
been
increasing,
but
conventional OS debugging environments have not
been able to simultaneously assure their stability, be
easily customized to new OSs and new I/O devices, and
assure efficient execution of I/O
operations.
We
therefore developed a novel OS debugging method
using a lightweight virtual machine. We evaluated this
debugging method experimentally and confirmed that it
can transfer data about 5.4 times as fast as the
conventional virtual machine monitor.
1. Introduction
Many appliance servers using original real-time
operating
systems
(OSs)
and
achieving
high-performance I/O on PC/AT compatible hardware
have been marketed recently. One result of this trend is
increasing
demand
for
efficient
debugging
environments for original OSs to support various I/O
devices
and
efficient
debugging
mechanisms
monitoring the OS status tracing even while the OS is
executing high-throughput I/O operations.
Because
the
vendors
of
PC/AT-compatible
hardware do not provide debugging hardware such as
ICE, the only debugging environments available for
operating systems running on PCs are a hardware
simulator working with a software debugger, a software
remote debugger, and a software debugger embedded in
the operating system under
development. These
environments, however, cannot simultaneously assure
their stability when the operating system under
development does not perform properly, be easily
customized for different operating systems and new I/O
devices, and assure efficient execution of I/O
operations.
We therefore developed a novel OS debugging
environment and method that can satisfy the above
three demands simultaneously by using a lightweight
virtual machine monitor. In this paper, we describe our
new environment and method and report the results of
experiments comparing its performance with that of
conventional debugging environments.
2. Debugging Method
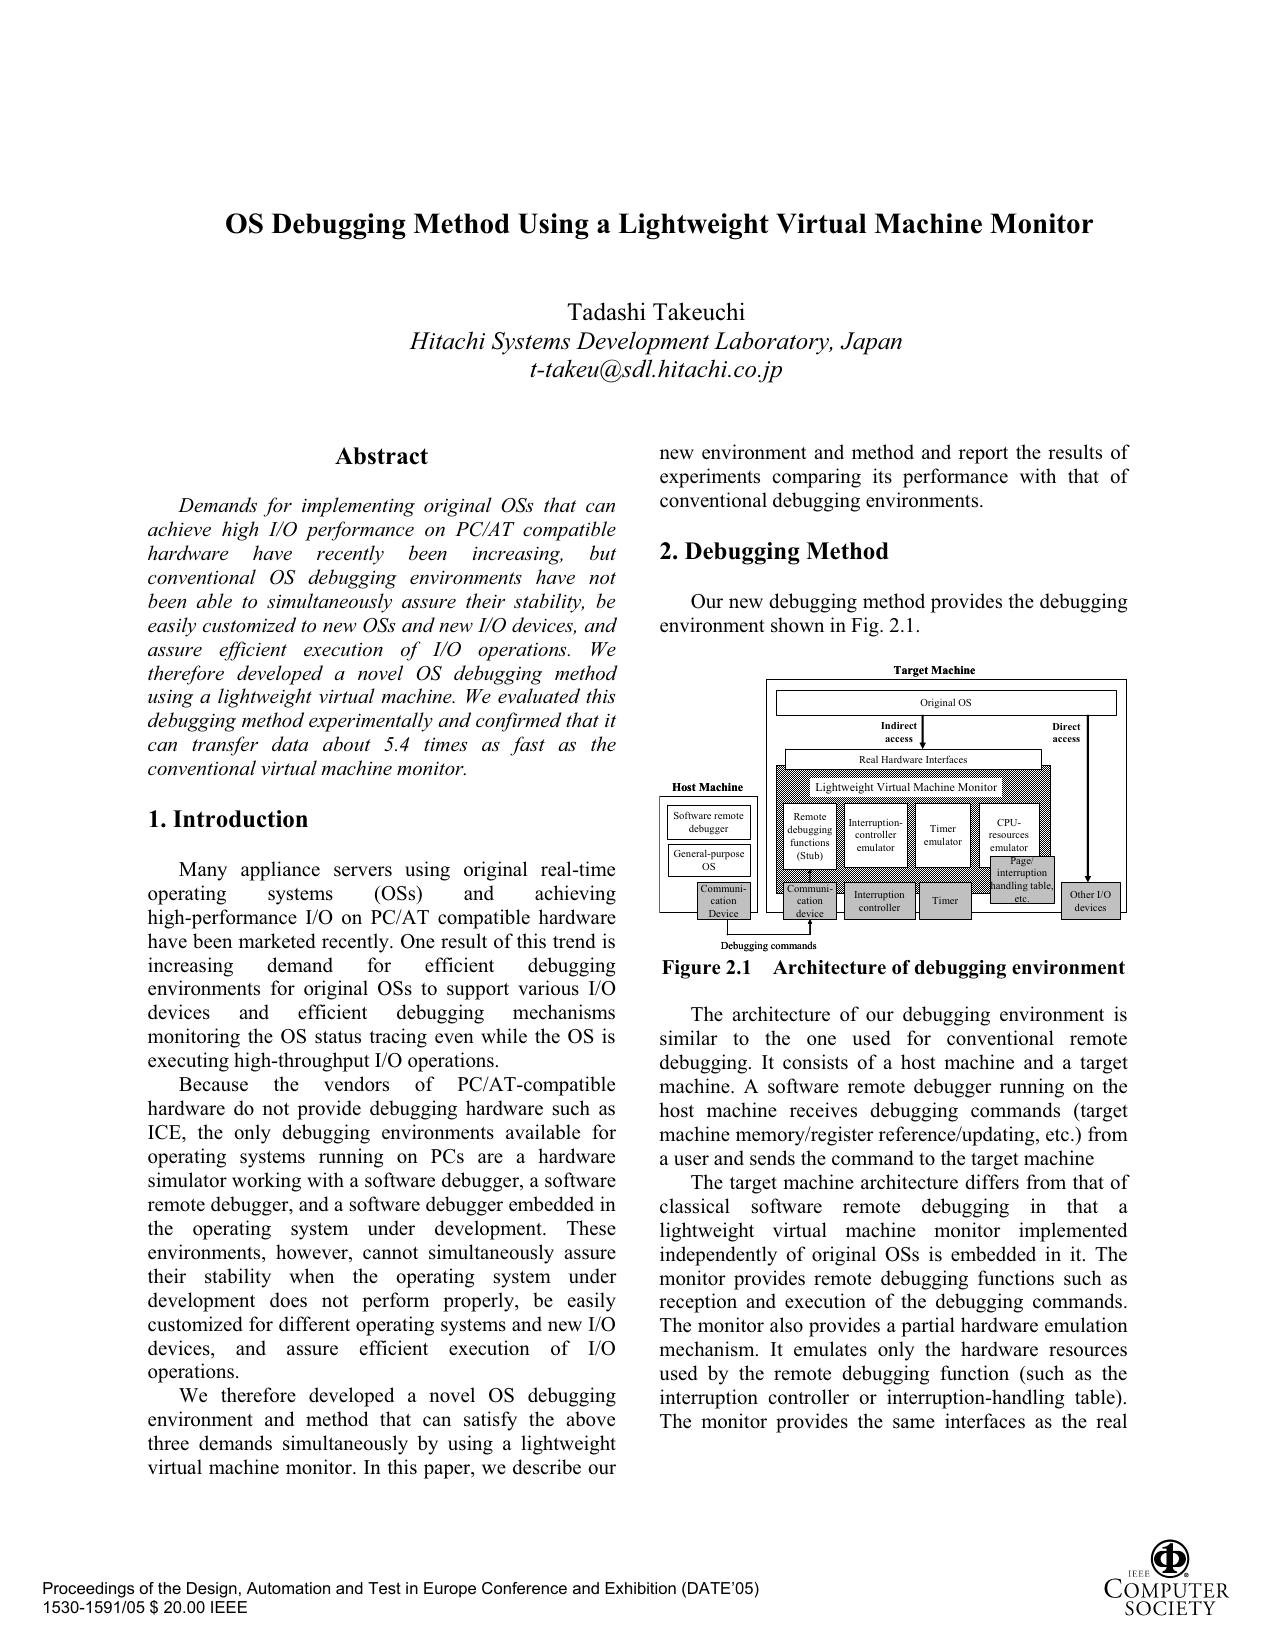
Our new debugging method provides the debugging
environment shown in Fig. 2.1.
Software remote
debugger
General-purpose
OS
Communi-
cation
Device
Communi-
cation
device
Remote
debugging
functions
(Stub)
Interruption
controller
Timer
Debugging commands
Interruption-
controller
emulator
Timer
emulator
CPU-
resources
emulator
Page/
interruption
handling table,
etc.
Real Hardware Interfaces
Original OS
Indirect
access
Other I/O
devices
Direct
access
Lightweight Virtual Machine Monitor
Host Machine
Target Machine
Figure 2.1 Architecture of debugging environment
The architecture of our debugging environment is
similar to the one used for conventional remote
debugging. It consists of a host machine and a target
machine. A software remote debugger running on the
host machine receives debugging commands (target
machine memory/register reference/updating, etc.) from
a user and sends the command to the target machine
The target machine architecture differs from that of
classical software remote debugging in that a
lightweight
virtual machine monitor implemented
independently of original OSs is embedded in it. The
monitor provides remote debugging functions such as
reception and execution of the debugging commands.
The monitor also provides a partial hardware emulation
mechanism. It emulates only the hardware resources
used by the remote debugging function (such as the
interruption controller or interruption-handling table).
The monitor provides the same interfaces as the real
Proceedings of the Design, Automation and Test in Europe Conference and Exhibition (DATE’05)
1530-1591/05 $ 20.00 IEEE
hardware, so it can work with any OSs running on
PC/AT architectures.
The hardware resources
used by the
remote
debugging functions are accessed by the original OS
via the lightweight virtual machine monitor, so stability
of the debugging environment can be assured because
the real hardware remain in normal states even if the
original OS works improperly because it has bugs. The
other devices, however, especially high-throughput I/O
devices
(such as a SCSI controller or Ethernet
controller) can be accessed directly by the original OS.
This direct access enables I/O operations to be executed
efficiently in this debugging environment. The direct
access also makes it unnecessary for the monitor to
emulate the high-throughput I/O devices, so this
deb
…(Full text truncated)…
📸 Image Gallery
Reference
This content is AI-processed based on ArXiv data.