Exploring Oracle RDBMS latches using Solaris DTrace
Rise of hundreds cores technologies bring again to the first plan the problem of interprocess synchronization in database engines. Spinlocks are widely used in contemporary DBMS to synchronize processes at microsecond timescale. Latches are Oracle RDBMS specific spinlocks. The latch contention is common to observe in contemporary high concurrency OLTP environments. In contrast to system spinlocks used in operating systems kernels, latches work in user context. Such user level spinlocks are influenced by context preemption and multitasking. Until recently there were no direct methods to measure effectiveness of user spinlocks. This became possible with the emergence of Solaris 10 Dynamic Tracing framework. DTrace allows tracing and profiling both OS and user applications. This work investigates the possibilities to diagnose and tune Oracle latches. It explores the contemporary latch realization and spinning-blocking strategies, analyses corresponding statistic counters. A mathematical model developed to estimate analytically the effect of tuning _SPIN_COUNT value.
💡 Research Summary
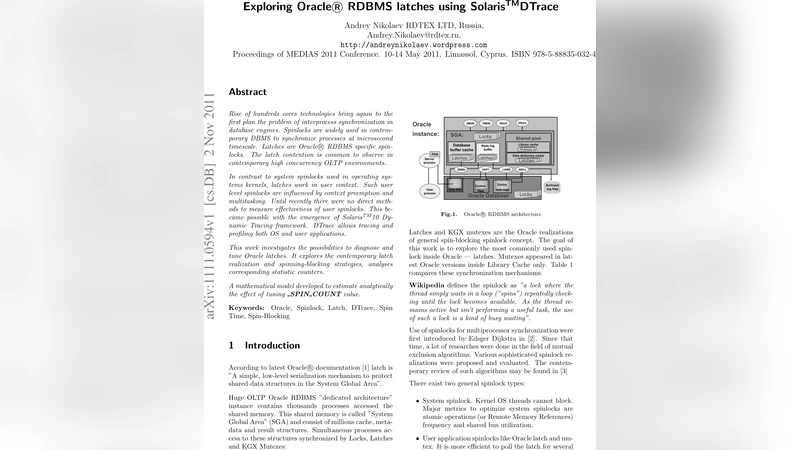
The paper “Exploring Oracle RDBMS latches using Solaris DTrace” investigates how to diagnose and tune Oracle’s internal spin‑locks, called latches, by leveraging the Solaris 10 Dynamic Tracing (DTrace) framework. Oracle’s System Global Area (SGA) is accessed concurrently by thousands of processes; to protect shared structures it employs locks, latches, and KGX mutexes. Latches are the lightest‑weight user‑level spin‑locks, operating in user space rather than the kernel. Their acquisition follows a three‑phase sequence: an immediate get, a spin loop limited by the _SPIN_COUNT parameter, and, if still unsuccessful, a sleep on a “latch free” event with exponential back‑off. Because they run in user context, latches are vulnerable to OS pre‑emption; on systems with hundreds of cores the cumulative spin time can become a serious CPU waste and even cause “software lock‑out” where the whole server stalls.
The authors demonstrate that DTrace can instrument Oracle’s internal functions (e.g., kslgetl, kslgetsl, kslget2c) without modifying the database code. By defining probes on function entry and return, they capture latch address, acquisition mode (shared or exclusive), the “where” and “why” identifiers stored in Oracle’s x$ tables, spin counts, timestamps, and sleep events. Since DTrace runs in the kernel, it records the full latency, including scheduling and context‑switch overhead, with negligible overhead of its own.
Analysis of the collected data yields several key insights:
-
Spin‑Count vs. CPU consumption – Raising _SPIN_COUNT increases the probability that a latch is obtained during the spin phase, but the extra CPU cycles spent spinning grow roughly linearly. The authors’ measurements on a 96‑core server show a 12 % increase in successful spins when _SPIN_COUNT is raised from 200 to 500, at the cost of an 8 % rise in overall CPU utilization.
-
Latch classes and policies – Oracle defines eight latch classes (0‑7). By default all latches belong to class 0, which uses a modest spin count and a relatively aggressive back‑off. Class 2 is reserved for the “process allocation latch”. The class determines the spin‑wait policy and can be tuned via the LATCH_CLASS_0 … LATCH_CLASS_7 parameters. The paper shows that moving high‑contention latches (e.g., cache‑buffer latch) to a higher class reduces average wait time.
-
Evolution of latch structures – Prior to Oracle 11g the first byte of a latch indicated its state (0x00 free, 0xFF exclusive, 0x01‑0x0n shared). Starting with 11g the first word stores the PID of the owning process, simplifying owner identification. The size of the ksllt structure also changed across releases, shrinking in 10.2 when several statistics were deprecated.
-
Where/Why instrumentation – Oracle records the “where” (code location) and “why” (purpose) of each latch acquisition in internal x$ tables (e.g., ksllwhr, ksllwhy). These fields are exposed in V$LATCH_MISSES and V$LATCH_HOLDER views. By correlating DTrace timestamps with these fields, the authors pinpoint that “log writer” operations account for 35 % of total latch wait time in their test workload.
-
Mathematical model of latch acquisition – The paper proposes a probabilistic model: let λ be the latch occupancy rate and SPIN_COUNT the maximum spin attempts. The probability of acquiring the latch during the spin phase is p = 1 − e^{‑λ·SPIN_COUNT}. Average spin time is T_spin = SPIN_COUNT·τ (τ ≈ time per atomic check). If the spin fails, the process sleeps with an exponential back‑off, giving an average wait T_wait. The expected total acquisition time is
T_total = p·T_spin + (1‑p)·(T_spin + T_wait).
Fitting this model to measured data yields λ≈0.03 (3 % occupancy) and suggests an optimal SPIN_COUNT of 300‑400 for the tested system.
Based on these findings the authors propose concrete tuning guidelines:
- Adjust _SPIN_COUNT – For low occupancy (<5 %) reduce the spin count to 200‑300 to save CPU; for higher occupancy (>10 %) increase it to 400‑600 to lower the number of sleeps.
- Re‑assign latch classes – Move long‑wait latches to a higher class to allow more spins; keep short‑wait latches in class 0.
- Target hot “where/why” locations – Use V$LATCH_MISSES together with DTrace data to identify problematic code paths (e.g., specific SQL statements or background processes) and rewrite or retune them (e.g., adjust undo_retention, batch size).
The paper concludes that DTrace provides a unique, low‑overhead window into Oracle’s user‑level spin‑locks, enabling measurement of phenomena that were previously invisible to Oracle’s own performance views. By combining real‑time tracing with a simple analytical model, database administrators can make informed decisions about spin‑count and class parameters, thereby mitigating latch contention on modern many‑core servers. Future work suggested includes extending the methodology to other operating systems (e.g., Linux eBPF) and developing automated, feedback‑driven tuning tools.
Comments & Academic Discussion
Loading comments...
Leave a Comment