Identifying relationships between drugs and medical conditions: winning experience in the Challenge 2 of the OMOP 2010 Cup
There is a growing interest in using a longitudinal observational databases to detect drug safety signal. In this paper we present a novel method, which we used online during the OMOP Cup. We consider homogeneous ensembling, which is based on random re-sampling (known, also, as bagging) as a main innovation compared to the previous publications in the related field. This study is based on a very large simulated database of the 10 million patients records, which was created by the Observational Medical Outcomes Partnership (OMOP). Compared to the traditional classification problem, the given data are unlabelled. The objective of this study is to discover hidden associations between drugs and conditions. The main idea of the approach, which we used during the OMOP Cup is to compare the numbers of observed and expected patterns. This comparison may be organised in several different ways, and the outcomes (base learners) may be quite different as well. It is proposed to construct the final decision function as an ensemble of the base learners. Our method was recognised formally by the Organisers of the OMOP Cup as a top performing method for the Challenge N2.
💡 Research Summary
The paper presents a winning solution for Challenge 2 of the OMOP 2010 Cup, a competition that tasked participants with discovering hidden drug‑condition associations in a massive simulated electronic health record (EHR) dataset. The dataset contains longitudinal records for ten million patients observed over ten years, including start and end dates for drug prescriptions (≈5,000 distinct drugs) and onset dates for medical conditions (≈4,500 distinct conditions). The total search space therefore comprises roughly 22.6 million possible drug‑condition pairs. A small labeled subset (4,000 positives, 3,920 negatives) was provided for validation but was deliberately excluded from model training, making the problem essentially unsupervised.
The authors’ methodology proceeds in several logical stages. First, they apply a classic disproportionality analysis (DPA) to each drug‑condition pair. For a given pair (d, c) they count the number of observed co‑occurrences (d_cn) where the condition occurs within a predefined temporal window Δ (30–60 days) after the drug’s start date. Independently, they count the total occurrences of the drug (d_n) and the condition (c_n) over the entire observation period T (10 years). Assuming independence, the expected number of co‑occurrences λ is estimated as λ = (d_n × c_n × Δ)/N, where N is the total patient count. The observed‑to‑expected ratio is then transformed using a smoothing function f (logarithmic or power) and a shrinkage parameter α (0.5–1.0) to produce a raw association score α_dc.
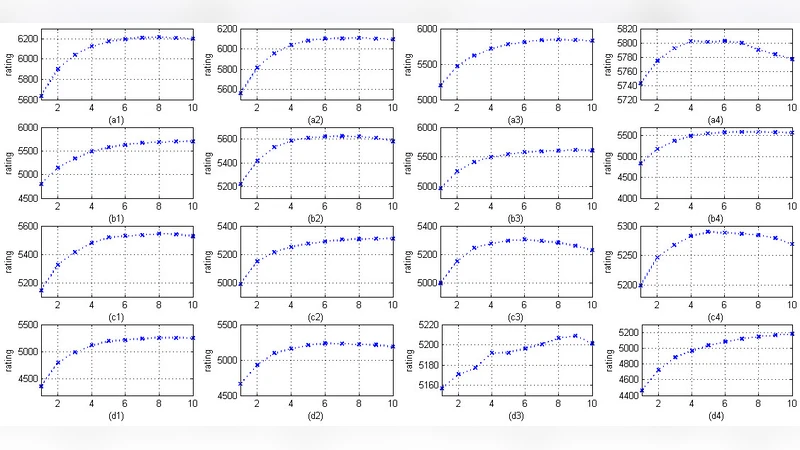
Recognizing that a single ten‑year window may obscure temporal dynamics, the authors split T into m = 10 consecutive yearly sub‑intervals and recompute α_dc for each year. This yields a time‑evolving series of scores for every pair, directly addressing Challenge 2’s requirement to evaluate performance as data accumulate over time.
The core innovation lies in the use of homogeneous ensembling (bagging). The same DPA pipeline is applied repeatedly to randomly drawn subsamples of patients (k = 100 subsamples, each selected with a uniform probability γ ∈
Comments & Academic Discussion
Loading comments...
Leave a Comment