Genetic Testing for Complex Diseases: a Simulation Study Perspective
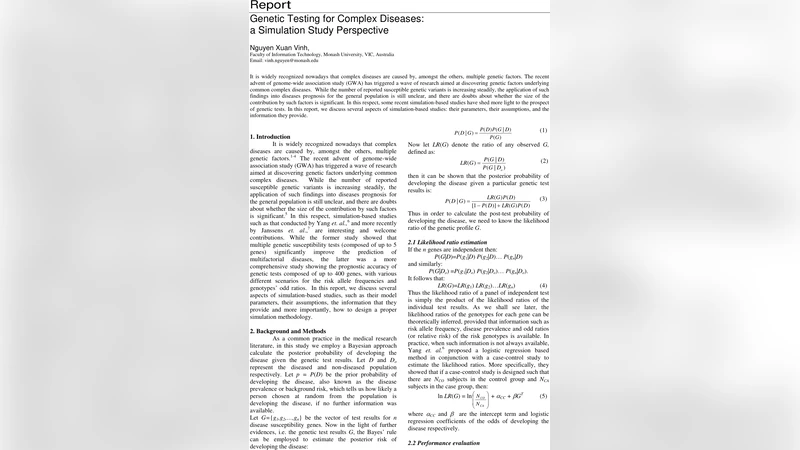
It is widely recognized nowadays that complex diseases are caused by, amongst the others, multiple genetic factors. The recent advent of genome-wide association study (GWA) has triggered a wave of research aimed at discovering genetic factors underlying common complex diseases. While the number of reported susceptible genetic variants is increasing steadily, the application of such findings into diseases prognosis for the general population is still unclear, and there are doubts about whether the size of the contribution by such factors is significant. In this respect, some recent simulation-based studies have shed more light to the prospect of genetic tests. In this report, we discuss several aspects of simulation-based studies: their parameters, their assumptions, and the information they provide.
💡 Research Summary
This paper provides a comprehensive review and critical analysis of simulation‑based studies that evaluate the predictive utility of genetic testing for complex diseases. The authors begin by outlining the Bayesian framework that underpins risk prediction: the posterior probability of disease given a genetic profile G, P(D|G), is derived from the prior disease prevalence p and the likelihood ratio (LR) of the observed genotype pattern. They emphasize that, under the common assumption of independence among susceptibility loci, the overall LR can be expressed as the product of individual locus LRs, each of which can be calculated directly from three key parameters – allele frequency (f), disease prevalence (p), and relative risk (R) or odds ratio (OR).
Two distinct simulation models are examined. The first, originally proposed by Yang et al., treats each locus as a binary marker (risk vs. non‑risk) and uses a logistic‑regression approach on simulated case‑control data to estimate LRs. The authors replicate this model, varying the number of loci (up to five), the relative risks (1.5–3.5), and allele frequencies (5–25%). Their results confirm that estimated LRs deviate from the analytically “true” values, especially as the number of loci grows, but that the deviation shrinks dramatically when the simulated case‑control sample size is increased from 1 000 to 10 000 subjects. This demonstrates the critical importance of adequate sample size for unbiased LR estimation in simulation studies.
The second, more elaborate model, follows Janssens et al., who model each gene with two alleles and three genotypes (EE, Ee, ee) under Hardy‑Weinberg equilibrium. Here, the heterozygous risk genotype’s OR is an input, while the homozygous risk genotype’s OR is assumed to be the square of that value. The overall LR of a multi‑gene profile is again the product of genotype‑specific LRs, but computing these LRs requires solving a set of five nonlinear equations (denoted as equation 9 in the paper). The original authors resorted to an iterative heuristic to approximate the solution, acknowledging the lack of a closed‑form expression. In this review, the authors derive a third‑order polynomial whose root yields the exact solution for one of the unknown variables, thereby providing a closed‑form analytical solution for the entire system. This advancement not only improves computational efficiency—critical when simulating hundreds of genes—but also enhances the theoretical rigor of the simulation methodology.
Beyond the mathematical derivations, the paper highlights two practical phenomena observed in large‑scale simulations. First, the proportion of simulated cases (p′) often falls short of the input prevalence (p), especially as the number of genes increases. This “gap” reflects the cumulative effect of independence assumptions and the stochastic assignment of disease status based on individual risk scores, suggesting that model calibration may be required when translating simulated results to real‑world settings. Second, while the area under the ROC curve (AUC) is frequently used to summarize discriminative performance, the authors caution that AUC alone does not dictate clinical utility. The choice of a posterior probability threshold directly influences sensitivity and specificity, and optimal thresholds must be determined in conjunction with cost‑effectiveness considerations.
The authors conclude with a set of recommendations for future simulation studies of genetic risk prediction: (1) explicitly state and justify all model parameters (p, f, OR/R) and explore their sensitivity; (2) ensure sufficiently large simulated cohorts to minimize stochastic bias in LR estimates; (3) adopt the closed‑form solution for the genotype‑frequency equations to streamline large‑scale simulations; (4) monitor the emergent case prevalence (p′) and adjust the simulation protocol if it diverges substantially from the intended prevalence; and (5) complement AUC with decision‑analytic metrics that reflect real‑world clinical trade‑offs. By adhering to these guidelines, researchers can produce more reliable, interpretable, and clinically relevant assessments of how genetic testing may improve disease prognosis in the general population.
Comments & Academic Discussion
Loading comments...
Leave a Comment