High-order chromatin architecture determines the landscape of chromosomal alterations in cancer
The rapid growth of cancer genome structural information provides an opportunity for a better understanding of the mutational mechanisms of genomic alterations in cancer and the forces of selection that act upon them. Here we test the evidence for two major forces, spatial chromosome structure and purifying (or negative) selection, that shape the landscape of somatic copy-number alterations (SCNAs) in cancer1. Using a maximum likelihood framework we compare SCNA maps and three-dimensional genome architecture as determined by genome-wide chromosome conformation capture (HiC) and described by the proposed fractal-globule (FG) model2. This analysis provides evidence that the distribution of chromosomal alterations in cancer is spatially related to three-dimensional genomic architecture and additionally suggests that purifying selection as well as positive selection shapes the landscape of SCNAs during somatic evolution of cancer cells.
💡 Research Summary
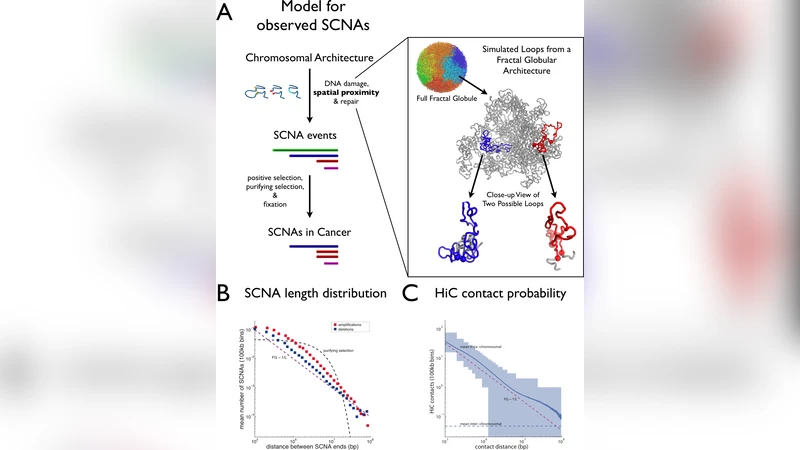
The authors set out to explain why somatic copy‑number alterations (SCNAs) – the most frequent type of structural variation in cancer genomes – are distributed the way they are across the genome. They hypothesized that two forces shape this landscape: the three‑dimensional (3D) organization of chromatin, which determines how often distant genomic loci come into physical contact, and purifying (negative) selection, which removes deleterious alterations that reduce cellular fitness.
To test these ideas they assembled a massive dataset of 3,131 cancer specimens, extracting 39,568 non‑recurrent SCNAs (26,022 amplifications and 13,546 deletions). Each SCNA was mapped onto a 1 Mb bin grid, producing a matrix that records how many amplifications or deletions start in bin i and end in bin j. In parallel they used publicly available Hi‑C data from the GM06990 human cell line to build a contact matrix of the same resolution, counting the number of chromatin contacts between each pair of 1 Mb bins. The Hi‑C contact probability decays with genomic distance L as ~1/L, a scaling that matches the fractal‑globule (FG) polymer model of chromatin folding. Remarkably, the observed frequency of SCNAs of length L follows the same ~1/L scaling over distances of 0.5–10 Mb, suggesting that physical proximity influences where breakpoints occur.
The authors then formalized six statistical models of SCNA generation. The “Uniform” model assumes a length‑independent mutation rate; “Uniform+sel” adds a single parameter describing purifying selection. The “HiC” and “HiC+sel” models replace the uniform mutation rate with the empirically measured Hi‑C contact probabilities, while “FG” and “FG+sel” use the theoretical 1/L decay from the fractal‑globule model. For each model they computed the likelihood of the observed SCNA matrix, then compared models using the Bayesian Information Criterion (BIC), which penalizes extra parameters.
Across the board, the FG‑based models outperformed the Hi‑C‑based and uniform models, achieving the highest likelihoods and lowest BIC scores. Adding a purifying‑selection parameter further improved every model (p < 0.001 by bootstrap), indicating that selection against deleterious copy‑number changes is a necessary component of any realistic description. The selection term was modeled as an exponential decay of fixation probability with SCNA length, reflecting the intuition that longer deletions or amplifications are more likely to disrupt essential genes or regulatory domains.
To guard against artefacts, the authors performed a permutation test. They kept SCNA lengths fixed but randomly reassigned start positions, thereby destroying any genuine distance‑dependent structure while preserving the overall length distribution. When the same models were fitted to these permuted datasets, the fit to the real data was significantly better (p < 0.001), confirming that the observed association between SCNA endpoints and 3D contact frequency is not a statistical fluke. Chromosome‑by‑chromosome analyses showed that 18 of 22 autosomes displayed a significant improvement of the Hi‑C/FG models over the permuted baseline; the effect was strongest for deletions, which showed a tighter correspondence with contact hotspots than amplifications.
An intriguing secondary finding is that the strength of purifying selection correlates with chromosome size: shorter, gene‑dense chromosomes exhibit a larger selection coefficient, consistent with the idea that a SCNA on a compact chromosome is more likely to hit essential genes. Conversely, longer chromosomes show weaker selection, perhaps because a given alteration affects a smaller fraction of the total gene content.
The discussion places these results in the broader context of cancer evolution. While positive selection (oncogene activation, tumor‑suppressor loss) has long been recognized as a driver of SCNAs, this work demonstrates that negative selection is also pervasive, shaping the observed length distribution and spatial patterning. Moreover, the physical folding of the genome—whether described by the empirically derived Hi‑C contact map or the theoretical fractal‑globule—provides a mechanistic substrate that biases where DNA breaks and re‑joins occur. The authors argue that future studies integrating higher‑resolution Hi‑C data from the specific tissue of origin, together with whole‑genome sequencing, will refine these models and may enable predictive mapping of SCNA hotspots in individual cancers.
In summary, the paper provides compelling statistical evidence that (1) the probability of two loci contacting in three dimensions predicts the likelihood that an SCNA will have its breakpoints at those loci, and (2) purifying selection against deleterious copy‑number changes further sculpts the observed SCNA landscape. This dual‑force framework advances our understanding of mutational processes in cancer and opens avenues for more precise genomic risk modeling.
Comments & Academic Discussion
Loading comments...
Leave a Comment