Impact of Software Requirement Volatility Pattern on Project Dynamics: Evidences from a Case Study
Requirements are found to change in various ways during the course of a project. This can affect the process in widely different manner and extent. Here we present a case study where-in we investigate the impact of requirement volatility pattern on project performance. The project setting described in the case is emulated on a validated system dynamics model representing the waterfall model. The findings indicate deviations in project outcome from the estimated thereby corroborating to previous findings. The results reinforce the applicability of system dynamics approach to analyze project performance under requirement volatility, which is expected to speed up adoption of the same in organizations and in the process contribute to more project successes.
💡 Research Summary
The paper investigates how the pattern of software requirement volatility influences project dynamics by employing a system dynamics (SD) model calibrated to a real-world case study. The authors focus on a waterfall‑based development project – an upgrade of the Advanced Commercial Banking System (ACBS) for a major U.S. bank – which suffered significant schedule overruns and scope growth due to changing requirements. The original plan called for a 34‑week (170 working‑day) effort to deliver roughly 7,572 lines of code (LOC) with a three‑person team. In reality, the project lasted 65 weeks (325 working days), required 2,452 man‑days of effort, produced 9,985 LOC, and incorporated ten change requests amounting to 123 person‑days and an additional 2,414 LOC.
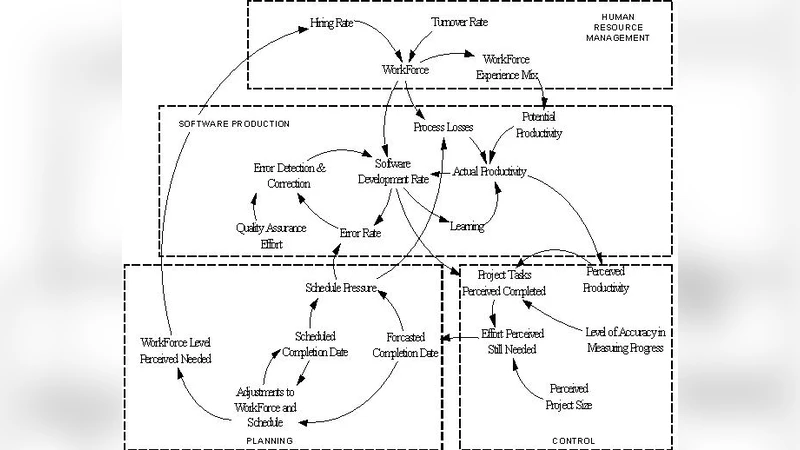
To explore the impact of the observed change‑order pattern, the authors adapted Abdel‑Hamid’s validated SD model of waterfall development. The model’s causal loop diagram captures key feedback mechanisms: schedule pressure influences error rate, which drives rework, which in turn raises perceived effort still needed, expanding perceived project size and consequently increasing the number of tasks perceived as completed. Workforce adjustments (hiring/releasing) affect actual productivity through learning curves, process losses, and motivation/communication factors. The model also distinguishes between potential productivity (determined by tools, language, hardware, and complexity) and actual productivity (modulated by motivation, communication loss, and user involvement).
Parameter estimation was performed using project data: the nominal potential productivity was derived as 19.7 LOC/man‑day after accounting for a 0.75 complexity multiplier, a 0.58 user‑involvement multiplier, and a 0.679 motivation/communication loss factor. Initial staffing was set to three experienced full‑time employees. The model excluded phases not directly related to development (requirements analysis, prototyping, acceptance testing, and post‑deployment support) and adjusted schedule and effort estimates accordingly.
Simulation results closely mirrored the actual project behavior across four dimensions:
-
Change Order Generation Rate – The simulated rate of change‑order creation (tasks per day) reproduced the empirical pattern: large changes early, a high‑priority spike in the middle, and smaller changes toward the end. The model’s output matched the observed cumulative effort distribution.
-
Workforce Augmentation – While the real project added staff in discrete bursts (driven by a pre‑defined allocation matrix and availability constraints), the SD model generated a smoother, continuous hiring curve. Consequently, the simulated peak workforce was slightly higher than the actual peak, reflecting the model’s assumption of immediate staffing response to perceived workload.
-
Software Development Productivity – Both simulated and actual productivity curves exhibited low initial productivity (new technology, limited expertise), a gradual rise as the team learned, and a sharp increase near project completion driven by schedule pressure. The model’s inclusion of schedule pressure as a productivity enhancer explained the late‑stage surge.
-
Schedule Completion Date – The simulated projected completion date adjusted continuously in response to perceived task completion and workforce changes, producing a trajectory that aligned well with the actual delayed schedule.
The authors conclude that system dynamics provides a powerful “what‑if” platform for anticipating the ripple effects of requirement volatility on schedule, effort, staffing, and productivity. By calibrating the model with real project metrics, managers can explore alternative staffing policies, schedule buffers, or volatility mitigation strategies before they are needed in practice. The study also demonstrates that the shape of the volatility pattern (e.g., early heavy changes versus late minor tweaks) can have disproportionate effects on project outcomes, a nuance not captured by traditional cost‑estimation models such as COCOMO.
Limitations include reliance on a single case, potential oversimplification of organizational decision‑making, and the exclusion of agile or iterative development contexts. Future work is suggested to validate the approach across multiple projects, extend the model to other development lifecycles, and incorporate stochastic elements of requirement change. Overall, the paper makes a compelling argument for integrating system dynamics into software project risk management, especially in environments where requirement volatility is expected to be significant.
Comments & Academic Discussion
Loading comments...
Leave a Comment