Exploring Human Mobility Patterns Based on Location Information of US Flights
A range of early studies have been conducted to illustrate human mobility patterns using different tracking data, such as dollar notes, cell phones and taxicabs. Here, we explore human mobility patterns based on massive tracking data of US flights. Both topological and geometric properties are examined in detail. We found that topological properties, such as traffic volume (between airports) and degree of connectivity (of individual airports), including both in- and outdegrees, follow a power law distribution but not a geometric property like travel lengths. The travel lengths exhibit an exponential distribution rather than a power law with an exponential cutoff as previous studies illustrated. We further simulated human mobility on the established topologies of airports with various moving behaviors and found that the mobility patterns are mainly attributed to the underlying binary topology of airports and have little to do with other factors, such as moving behaviors and geometric distances. Apart from the above findings, this study adopts the head/tail division rule, which is regularity behind any heavy-tailed distribution for extracting individual airports. The adoption of this rule for data processing constitutes another major contribution of this paper. Keywords: scaling of geographic space, head/tail division rule, power law, geographic information, agent-based simulations
💡 Research Summary
This paper investigates human mobility patterns by exploiting a massive GPS‑derived dataset of U.S. domestic flights. Over an 11‑day period in August 2010, 7,685,948 location points were collected at five‑minute intervals from aircraft in service. The authors first performed extensive data cleaning: they removed international flights, eliminated points with missing fields or duplicate timestamps, and distinguished regular (recurrent) routes from irregular (single‑occurrence) routes using statistical properties of the inter‑point time gaps (τ). Regular routes exhibited a mean τ much smaller than its standard deviation, whereas irregular routes showed the opposite relationship. By applying a threshold based on mean + standard deviation, they segmented the point streams into individual flights, ultimately extracting 205,662 valid flights (201,202 from regular routes and 4,460 irregular flights).
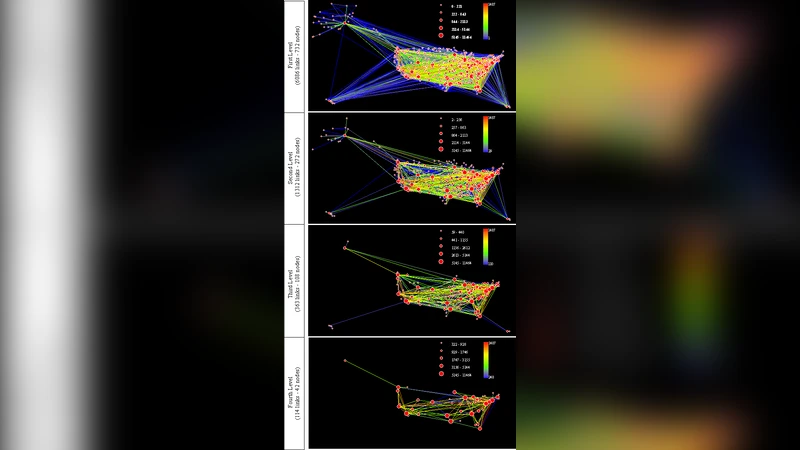
From these flights, 410,536 origin/destination (O/D) points were identified. The authors constructed four triangulated irregular networks (TINs) for the mainland, Alaska, Hawaii, and Puerto Rico/Virgin Islands. The sizes of TIN triangles followed a bipartite power‑law distribution. Using the head/tail division rule—a method that separates heavy‑tailed data into “head” (values above the mean) and “tail” (values below the mean)—they classified the smaller triangles as airports, yielding a set of 732 natural airports. Two network representations were then built: a binary route graph (edges indicate the existence of at least one flight) and a weighted flight graph (edge weight equals the number of flights).
The core analytical task was to determine which heavy‑tailed distribution best describes three key mobility metrics: traffic volume (number of flights between airport pairs), in‑degree/out‑degree of airports, and travel length (geodesic distance between origin and destination). The authors considered five candidate distributions—power law, power law with exponential cutoff, exponential, stretched exponential, and lognormal—following the statistical framework of Clauset, Shalizi, and Newman (2009). For each metric they estimated the lower bound x_min and the distribution parameters via maximum‑likelihood, performed Kolmogorov‑Smirnov (KS) tests, and computed p‑values using 1,000 synthetic datasets. Results showed that traffic volume and both in‑ and out‑degrees are best described by a pure power law (α≈1.5–2.6), confirming the presence of scale‑free connectivity in the U.S. airport network. In contrast, travel lengths follow an exponential distribution (λ≈0.001), rejecting the previously reported power‑law‑with‑cutoff pattern observed in dollar‑note, mobile‑phone, and taxi datasets. This divergence suggests that, for air travel, the underlying binary topology dominates movement characteristics, while physical distances play a secondary role.
To probe the mechanistic origins of these patterns, the authors implemented agent‑based simulations on the empirically derived airport topologies. Five movement rules were examined: (G) a purely geometric rule favoring shorter Euclidean distances; (T1) a binary topological rule (any existing link is equally likely); (T2) a weighted topological rule proportional to the number of flights on a link; (T3) a preferential attachment rule based on the degree of neighboring nodes; and (PR) a preferential‑return rule inspired by Song et al. (2010). For each scenario, 500 agents performed 1,000 moves on either the route graph or the flight graph until the visitation frequency of nodes correlated strongly (R² > 0.9) with node degree, indicating saturation. The simulated travel‑length distributions were then compared to the observed exponential distribution using the maximum CDF distance (δ). Scenarios T1–T3 reproduced the exponential shape closely, whereas the geometric scenario G deviated markedly, and the preferential‑return rule yielded intermediate results. These findings reinforce the conclusion that the binary connectivity structure of the airport network, rather than geographic distance, primarily shapes human mobility patterns observed in air travel.
Methodologically, the paper contributes a systematic pipeline for extracting meaningful network entities from massive spatiotemporal point clouds, notably the application of the head/tail division rule to delineate airports from dense O/D point clusters. It also demonstrates a rigorous statistical comparison across multiple heavy‑tailed models, extending the Clauset et al. framework beyond power‑law detection.
Limitations include the short observation window (11 days), which precludes analysis of seasonal or weekly cycles, and potential GPS noise or idle periods (e.g., holding patterns) that may affect flight‑segment identification. Future work could incorporate longer‑term datasets, include international routes, and explore multilayer network representations (e.g., integrating ground transportation) to assess the generality of the observed topological dominance. Such extensions would enhance the applicability of the findings to epidemic modeling, transportation planning, and urban dynamics.
Comments & Academic Discussion
Loading comments...
Leave a Comment