The Swift/XRT Catalogue of GRBs
We present the preliminary analysis of the GRB light curves obtained by Swift/XRT between November 2004 and December 2010.
💡 Research Summary
The paper presents a comprehensive catalogue of Swift/XRT observations of gamma‑ray bursts (GRBs) collected between November 2004 and December 2010. Out of the 658 GRBs detected by Swift during this period, the authors selected 437 events for which the X‑ray afterglow was sufficiently bright to allow reliable spectral extraction. The sample includes 165 GRBs with measured redshifts, enabling the computation of intrinsic luminosities and isotropic‑equivalent energies.
Data reduction follows the procedure described in Margutti et al. (2010). Light curves were extracted in the full 0.3–10 keV band and in four sub‑bands (0.3–1, 1–2, 2–3, 3–10 keV). The authors provide count‑rate, flux, and, for the redshift subsample, luminosity curves together with all relevant derived parameters. Spectral evolution is accounted for when converting count rates to fluxes, and the neutral‑hydrogen column density (NH) is measured in intervals where the spectrum is stable.
Temporal analysis employs four analytical models: (1) a single power‑law, (2) a smoothed broken power‑law, (3) a sum of a power‑law and a smoothed broken power‑law, and (4) a sum of two smoothed broken power‑laws. The fitting is performed with the IDL MPFIT routine (Levenberg‑Marquardt algorithm). After fitting, residual flares and other variability are iteratively removed following Margutti et al. (2011), allowing the authors to compute the total fluence and, where redshifts are known, the total emitted energy for each segment of the light curve.
Based on the best‑fit functions, the authors classify each XRT light curve into a taxonomy that captures the number of breaks, the smoothness parameter, the completeness of the data, and the presence of X‑ray flares. The classification scheme yields five primary types: Type 0 (no break), Type Ia (single break with smoothness s < 0), Type Ib (single break with s > 0), Type IIa (double break steep‑to‑flat), Type IIb (double break flat‑to‑steep), and Type III (double break described by the sum of two smoothed broken power‑laws). Each light curve is further labeled with “C” (complete) or “U” (incomplete) and “F” (flare present) or “N” (no flare), resulting in 12 detailed subclasses (e.g., ICN, ICF). The distribution of the 437 GRBs across these classes is summarized in Table 1: 103 are Type 0, 212 are Type I, 107 are Type II, and 22 are Type III.
The authors highlight an observational bias: complete light curves (re‑pointing time < 300 s and sufficient final count rate) are more likely to be classified as Type I or II (117/153 for Type I, 135/148 for Type II), whereas incomplete curves are dominated by Type 0 (69/118). Moreover, the majority of incomplete curves lack flares (103/108), while about one‑third of the complete curves exhibit flares (107/319).
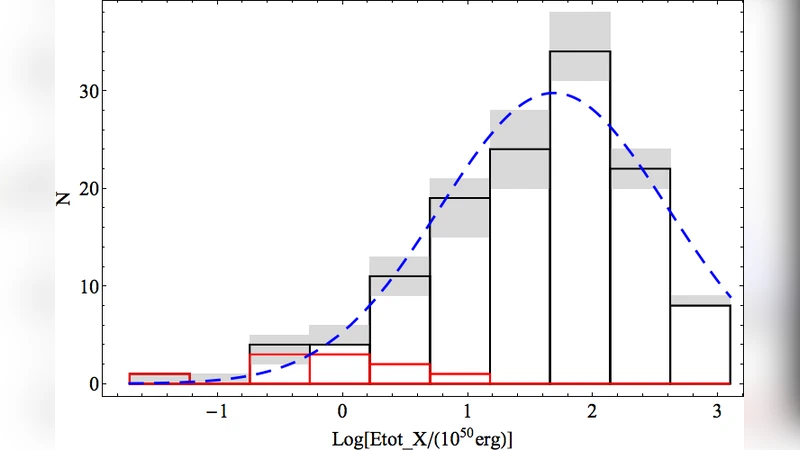
Using the 165 GRBs with known redshifts, the paper reproduces the Dainotti relation, i.e., the correlation between the end‑plateau X‑ray luminosity (Lₚₗₐₜ) and the plateau termination time (tₚₗₐₜ). The authors plot this relation for their sample and compute the distribution of total X‑ray energies, with uncertainties derived from Monte‑Carlo simulations. Short GRBs are shown in red, emphasizing their distinct energy budget compared to long GRBs.
In conclusion, the Swift/XRT catalogue provides a homogeneous, statistically robust dataset of GRB X‑ray afterglows. It enables systematic studies of temporal and spectral properties, the prevalence of flares, and the impact of observational completeness. The catalogue serves as a benchmark for testing theoretical models of afterglow physics (e.g., external shock deceleration, energy injection, jet structure) and offers a valuable resource for future multi‑wavelength analyses, machine‑learning classification efforts, and population studies of GRB progenitors.
Comments & Academic Discussion
Loading comments...
Leave a Comment