Single-image diffusion coefficient measurements of proteins in free solution
Diffusion coefficient measurements are important for many biological and material investigations, such as particle dynamics, kinetics, and size determinations. Amongst current measurement methods, single particle tracking (SPT) offers the unique capability of providing location and diffusion information of a molecule simultaneously while using only femptomoles of sample. However, the temporal resolution of SPT is limited to seconds for single-color labeled samples. By directly imaging three dimensional (3D) diffusing fluorescent proteins and studying the widths of their intensity profiles, we determine the proteins’ diffusion coefficients using single protein images of sub-millisecond exposure times. This simple method improves the temporal resolution of diffusion coefficient measurements to sub-millisecond, and can be readily applied to a range of particle sizes in SPT investigations and applications where diffusion coefficient measurements are needed, such as reaction kinetics and particle size determinations.
💡 Research Summary
This paper introduces a novel single‑image method for measuring the three‑dimensional diffusion coefficient (D₃) of fluorescent proteins with sub‑millisecond temporal resolution. Traditional single‑particle tracking (SPT) requires at least 20 consecutive localizations, which, given current camera frame rates (~100 fps), translates into a minimum measurement time of ~0.2 s. Such a timescale is far too long for fast‑diffusing nanometer‑scale proteins whose diffusion coefficients can exceed 10⁸ nm² s⁻¹, leading to displacements of several hundred nanometers within a millisecond.
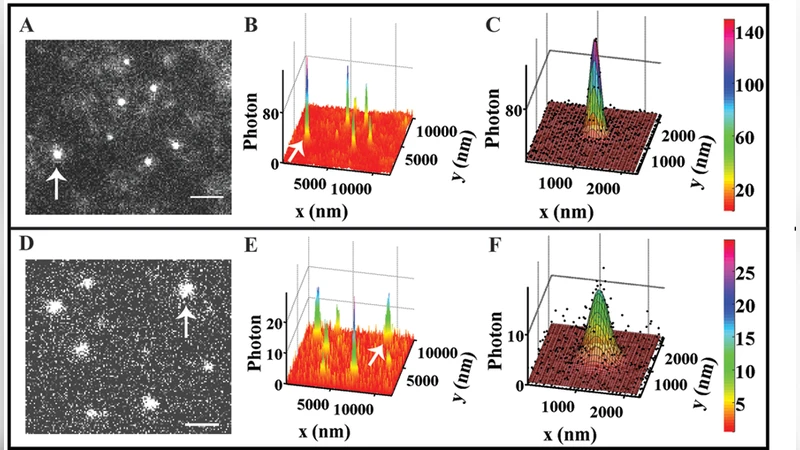
The authors exploit the fact that a moving molecule’s image becomes broader (“blurred”) compared to a stationary molecule when the exposure time is finite. By recording eGFP molecules at exposure times of 0.3 ms, 0.7 ms, and 1 ms, they fit each single‑molecule intensity profile to a two‑dimensional Gaussian and extract the lateral standard deviations (sₓ, s_y). Stationary eGFP on a glass surface yields sₓ≈s_y≈107 nm, whereas diffusing molecules show a systematic increase with exposure time (136 nm → 176 nm). This broadening directly reflects the root‑mean‑square displacement √(2 D₃ t) accumulated during the exposure.
The theoretical framework treats the final image as the convolution of (i) the axial‑projected point‑spread function (PSF) f(x,y) and (ii) the lateral distribution of the molecule’s trajectory g(x,y). Both functions are well approximated by Gaussians for the short exposure times used. Convolution of two Gaussians yields another Gaussian whose variance is the sum of the individual variances. Consequently, the measured standard deviation follows
s_{x,y} = √
Comments & Academic Discussion
Loading comments...
Leave a Comment