Sparse Linear Identifiable Multivariate Modeling
In this paper we consider sparse and identifiable linear latent variable (factor) and linear Bayesian network models for parsimonious analysis of multivariate data. We propose a computationally efficient method for joint parameter and model inference…
Authors: ** - Ricardo Henao (rhenao@binf.ku.dk) – DTU Informatics, Technical University of Denmark - Ole Winther (owi@imm.dtu.dk) – DTU Informatics, Bioinformatics Centre
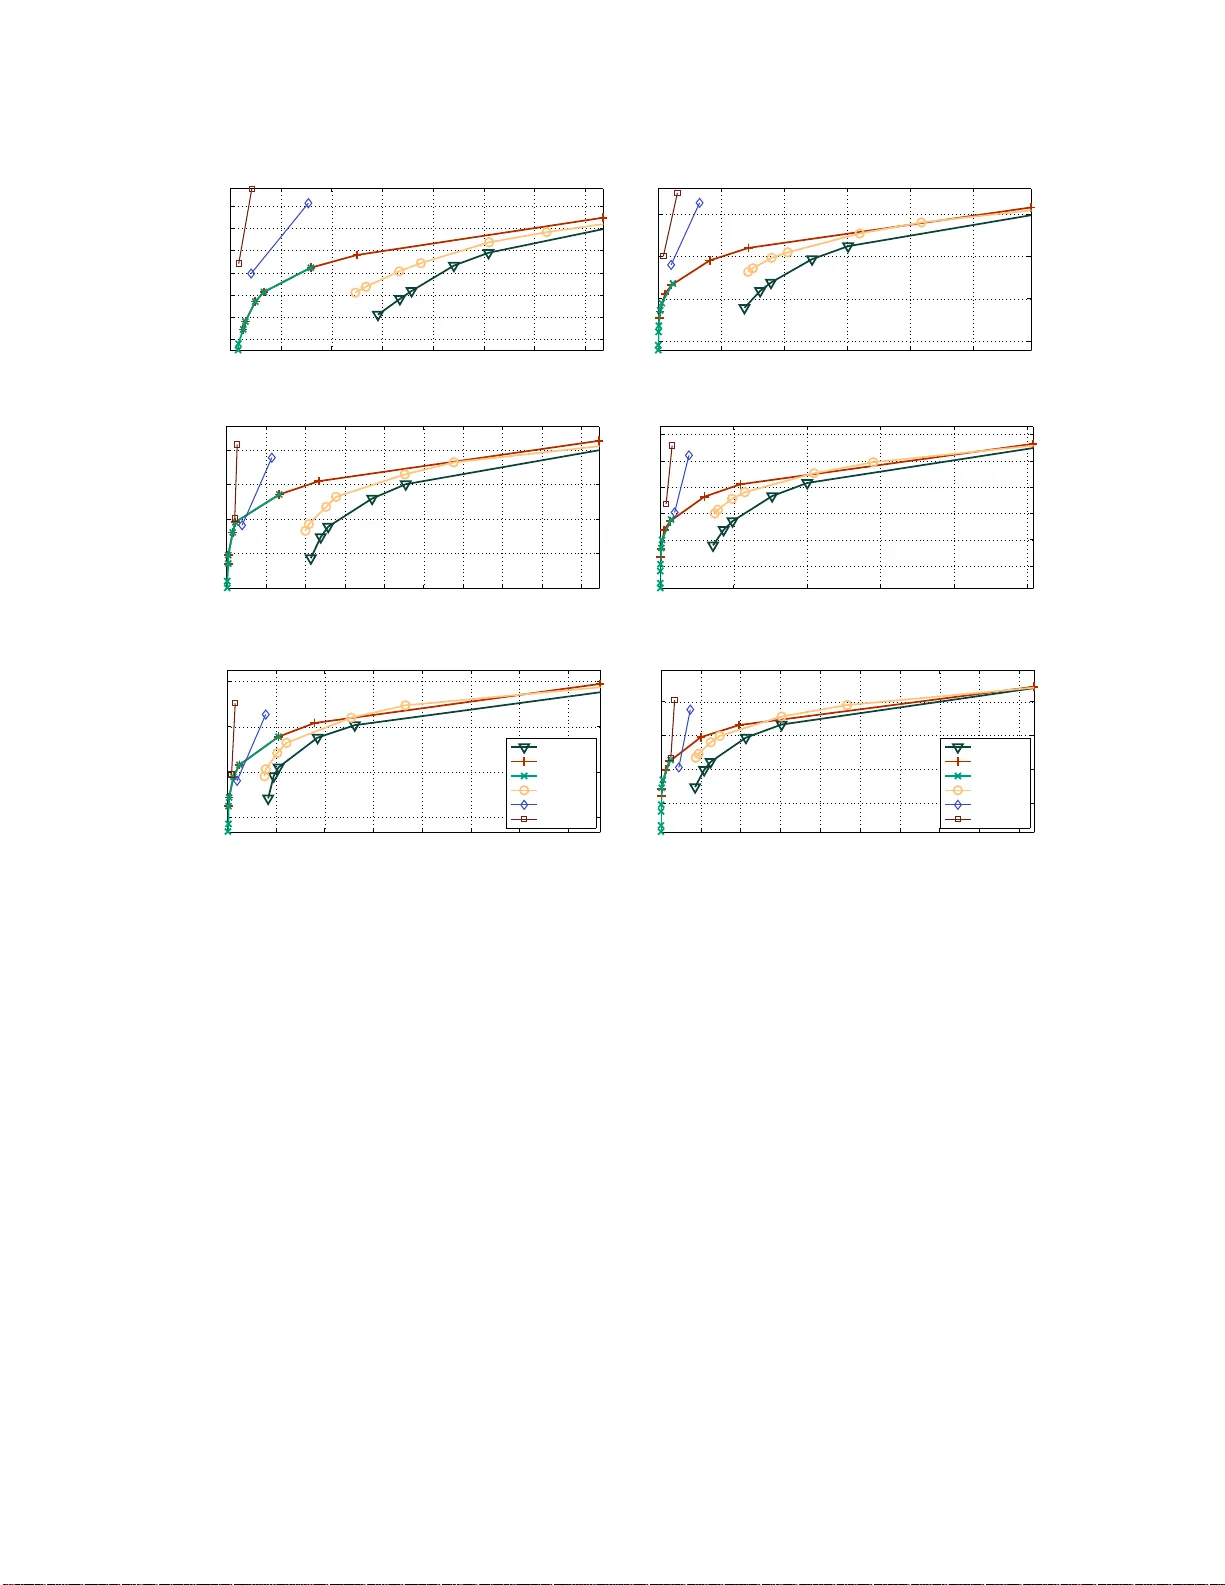
Journal of Mac hine Learning Researc h 12 (2011) 663-705 Submitted 10/09; Revised 10/10; Published 3/11 Sparse Linear Iden tifiable Multiv ariate Mo deling Ricardo Henao rhenao@binf .ku.d k Ole Win ther owi @imm.dtu.d k DTU Informatics Ric har d Petersens Plads, Building 321 T e chnic al University of Denmark DK-2800 Lyngby, Denmark Bioinfo rmatics Centr e University of Cop enhage n Ole Maalo es V ej 5 DK-2200 Cop enhagen N, Denmark Editor: Aapo Hyv¨ arinen Abstract In this paper we consider sparse and identifiable linear latent v ariable (factor) a nd linear Bay es ian netw or k mo dels for parsimo nious a na lysis of m ultiv ariate da ta. W e prop ose a computationally efficient method for joint parameter a nd mo del inference, and mo del com- parison. It cons ists of a fully B a yesian hierarch y for sparse mo dels using sla b and spike priors (tw o -component δ -function and cont inuous mixtures), non-Gaussia n latent factors and a sto c ha stic search over the ordering of the v ariables . The framework, which we c a ll SLIM (Sparse Linear Identifiable Multiv aria te mo deling), is v alidated and b enc h-marked on artificial and rea l biologica l data sets. SLIM is clo sest in spirit to LiNGAM ( Shimizu et al. , 2006 ), but differs substantially in inference, Bayesian netw ork struc tur e lear ning and mo del compariso n. Exp eriment ally , SLIM p erforms equally well or b etter than LiNGAM with comparable computational complexity . W e attribute this mainly to the sto c hastic search strategy used, and to par simon y (spa rsit y and iden tifiability), which is an explicit part of the mo del. W e pr opose tw o extensions to the basic i.i.d. linea r fr a mew o r k: no n-linear de- pendenc e on observed v ar iables, c alled SNIM (Sparse Non-linear Identifiable Multiv a riate mo deling) and a llo wing for cor relations b et ween latent v ariables, called CSLIM (Correla ted SLIM), for the temp oral and/or spatial da ta. The sour ce code and scripts a re av ailable from http:/ /cogsys.i mm.dtu.dk/slim/ . Keyw ords: Parsimony , spar s it y , identifiabilit y , factor mo dels, linear Bay esia n net works 1. In t roduction Mo deling and int erpretation of multiv ariate data are central th emes in mac h in e learning. Linear laten t v ariable mo dels (or factor analysis) and linear directed acyclic graph s (D A Gs) are p rominen t examples of mo dels for con tinuous multiv ariate data. In factor analysis, data is mo deled as a lin ear combinatio n of indep endentl y d istributed f ac tors thus allo wing for capture of a ric h underlying co-v ariation structur e. In the D AG mo del, eac h v ariable is expressed as regression on a subset of the remaining v ariables with the constrain t that total connectivit y is acyclic in order to h a v e a prop erly defi ned join t distrib ution. P arsimonious (in terp reta ble) mo deling, using sp arse factor loading matrix or restricting the n umber of c 2011 Ricardo Henao and Ole Winther. Henao and Winther paren ts of a no de in a DA G, are go o d p rior assum ptions in many app lic ations. Recen tly , there has b een a great deal of in terest in detailed mo deling of sparsit y in factor mo d- els, for example in the con text of gene expr essio n data analysis ( W est , 2003 , Lucas et al. , 2006 , Kno wles and Ghahramani , 2007 , Thibaux and Jordan , 2007 , Carv alho et al. , 200 8 , Rai and Daume I I I , 2009 ). Sparsit y arises for example in gene regulation b ecause the la- ten t factors represen t driving s ig nals for gene regulatory sub-net w orks and/or transcription factors, eac h of which only includes/affects a limited n u m b er of genes. A p arsimonious D A G is p articularly attractable from an in terpretation p oin t of view but the restriction to only ha vin g observ ed v ariables in th e mo del ma y b e a limitation b ecause one rarely m ea sures all relev ant v ariables. F urthermore, linear relationships migh t b e u nrealistic for example in gene regulation, where it is generally accepted that one cannot replace the dr ivin g signal (related to concen tration of a transcription factor protein in the cell nucleus) w ith the mea- sured concen tration of corresp onding mRNA. Ba yesia n n et w orks repr esent a v er y general class of mo dels, encompassing b oth observed and latent v ariables. In many situations it will thus b e relev an t to learn p ars imonio us Ba yesia n net wo rks w ith b oth laten t v ariables and a non-linear DA G parts. Although attractiv e, by b eing closer to what one ma y exp ect in practice, such mo deling is complicated by difficult inference ( Chic k ering ( 1996 ) show ed that DA G s tructure learning is NP-hard) and b y p oten tial n on-iden tifiabilit y . Iden tifiabilit y means that eac h setting of th e parameters defines a unique d istribution of the data. C lea rly , if the mo del is not iden tifiable in the D AG and laten t parameters, this sev erely limits the in terpretabilit y of the learned mod el. Shimizu et al. ( 2006 ) provided the imp ortan t insight that ev ery D AG has a factor mo del represent ation, i.e. the connectivit y matrix of a DA G giv es rise to a triangular mixing ma- trix in the factor mo del. This pro vided the motiv ation for the Linear Non-Gaussian Acyclic Mo del (LiNGAM) algorithm whic h solv es the identifiable factor mo del using In d epen d en t Comp onen t Analysis (ICA, Hyv¨ arinen et al. , 2001 ) follo wed by iterativ e p erm u tat ion of th e solutions to w ards triangular, aiming to fin d a suitable ordering for the v ariables. As final step, th e resulting DA G is prun ed based on different statistics, e.g. W ald, Bonferroni, χ 2 second order m odel fit tests. Mo del selectio n is then p erformed us in g some pre-c hosen sig- nificance lev el, thus LiNGAM select from mo dels with different sp arsit y lev els and a fixed deterministically found ordering. There is a p ossible num b er of extensions to their basic mo del, f or instance Ho yer et al. ( 200 8 ) extend it to allo w for laten t v ariables, f or wh ich they use a probabilistic version of ICA to ob tain the v ariable ordering, pru ning to mak e the mo del sparse and b o otstrapping for mo del selection. Although th e mo del seems to work w ell in practice, as comment ed b y the authors, it is restricted to v ery small problems (3 or 4 observ ed and 1 latent v ariables). Non-linear D A Gs are also a p ossibilit y , how ev er find ing v ariable orderings in th is case is kn o wn to b e far more difficult than in the linear case. These metho ds inspired by F riedman and Nac hman ( 2000 ), mainly consist of t wo steps: p erform- ing non-linear regression for a s et of p ossible ord erings, and then testing for indep endence to pru ne the mo del, see for instance Ho ye r et al. ( 2009 ) and Zhang and Hyv¨ arinen ( 2010 ). F or tasks where exhaus tive ord er enumeration is not feasible, greedy approac hes like D AG- searc h (see “ideal parent” algorithm, E lidan et al. , 2007 ) or PC (Protot ypical Constraint , see k ernel PC, Tillman et al. , 2009 ) can b e u s ed as compu ta tionally affordable alternativ es. F acto r mo dels ha v e b een successfully emplo yed as exp lo ratory to ols in many m ultiv ari- ate analysis applications. H o wev er, interpretabilit y using sparsity is usually not p art of 664 Sp arse Linear Identifiable Mul tiv aria te Modeling the mo del, but ac hiev ed through p ost-pro cessing. Examp les of this include, b o otstrapping, rotating th e solutions to maximize sp arsit y (v arimax, pro crustes), pru ning or th r eshold- ing. An ot her p ossibility is to im p ose s p arsit y in the mo del throu gh L 1 regularization to obtain a maxim um a-p osteriori estimate ( Jolliffe et al. , 2003 , Zou et al. , 2006 ). In f ully Ba ye sian sparse factor mo deling, t wo appr oac hes h a v e b een prop osed: parametric mo d- els with bimo dal sparsit y promoting priors ( W est , 2003 , Lucas et al. , 2006 , Carv alho et al. , 2008 , Henao and Winther , 2009 ), and non-p arame tric mo dels where the n u m b er of fac- tors is p oten tially in finite ( Kno wles and Ghahramani , 2007 , Thibaux and Jordan , 2007 , Rai and Daume I I I , 2009 ). It turns out that most of the parametric sparse f a ctor mo dels can b e seen as finite versions of th eir non-parametric counte rparts, for instance W est ( 2003 ) and Kno wles and Ghahramani ( 2007 ). The mo del pr oposed by W est ( 2003 ) is, as far as the authors know, the fir st attempt to enco d e sparsit y in a f ac tor mo del explicitly in the f orm of a pr io r. The remaining m odels imp ro v e the initial setting b y dealing w ith th e optimal num- b er of factors in Kno wles and Ghahramani ( 2007 ), improv ed hierarc hical sp ecificatio n of the sparsit y prior in Lucas et al. ( 2006 ), Carv alho et al. ( 2008 ), Th ib aux and Jordan ( 2007 ), h i- erarc h ical structure for the loading matrices in Rai and Daume I I I ( 2009 ) and iden tifiabilit y without restricting the mo del in Henao and Win ther ( 2009 ). Man y algorithms h a v e b een p rop osed to deal with the NP-hard D AG structure learning task. LiNGAM, discussed ab o v e, is the first fully iden tifiable approac h for conti nuous data. All other approac hes for conti nuous data use linearit y and (at least implicitly) Gaussianit y assumptions so that the mo del str ucture learned is only defined up to equ iv alence classes. Th us in most cases the directionalit y information ab out the edges in the graph m u st b e discarded. Linear Gaussian-based mo dels hav e the added adv anta ge that they are com- putationally affordable for the man y v ariables case. The stru ct ure learnin g appr oa c h es can b e roughly divided int o sto c hastic searc h and score ( Co op er and Hersk o vits , 1992 , Hec ke rman et al. , 2000 , F riedman and Koller , 2003 ), constraint-based (with conditional in- dep endence tests) ( Spirtes et al. , 2001 ) and t wo stage; lik e LiNGAM, ( Tsamardin os et al. , 2006 , F riedman et al. , 1999 , T eyssier and Koller , 2005 , Schmidt et al. , 2007 , Shimizu et al. , 2006 ). In the follo win g, w e d iscu ss in more detail pr evio us work in the last categ ory , as it is closest to the w ork in th is pap er and can b e considered representati v e of the state-of-the-art. The Max-Min Hill-Climbing algorithm (MMHC, T samardinos et al. , 2006 ) fi rst learns the sk eleton using conditional in d epend ence tests similar to PC algorithms ( Spirtes et al. , 2001 ) and then the order of the v ariables is found using a Bay esian-scoring h ill-c lim bing searc h . The Sparse Candidate (SC ) algorithm ( F riedman et al. , 1999 ) is in the same spirit b ut re- stricts the skel eton to within a pred et ermined link candidate set of b ounded size for eac h v ariable. T he Order Searc h algorithm ( T eyssier and K ol ler , 2005 ) uses hill-clim bing fir s t to find the ordering, and then lo oks for the s keleto n with SC. L 1 regularized Marko v Blank et ( Sc h midt et al. , 2007 ) replaces the skelet on learning from MMHC with a dep endency net- w ork ( Hec ke rman et al. , 2000 ) written as a set of lo cal conditional distributions represent ed as regularized linear regressors. Sin ce th e source of id en tifiabilit y in Gaussian DA G mo dels is the direction of the edges in the graph, a still meaningful approac h consists of en tirely fo- cusing on inferrin g the sk eleton of the graph by k eeping the edges undirected as in Dempster ( 1972 ), Da wid and L au r itz en ( 1993 ), Giudici and Green ( 1999 ), Ra jaratman et al. ( 2008 ). In th is pap er w e pr opose a framework called SLIM (Sp arse Linear Identifiable Multiv ari- ate mo deling, s ee Figure 1 ) in w hic h we learn mo dels from a rather general class of Ba yesian 665 Henao and Winther x 1 x 2 . . . x d z 1 z 2 . . . z m x 1 x 2 x 3 . . . x d l 1 x 1 x 2 . . . x d x 3 l m l 2 { X , X ⋆ } P linear Ba yesian net work B X + C Z + ǫ h B i , h C L i h B i h C L i CSLIM SLIM SNIM hLi hLi hLi candidates usage { P (1) , . . . , P ( m top ) , . . . } Order searc h Laten t var iables likelihood density {L (1) , L (2) , . . . , } Model comparison Figure 1: S LIM in a n u tshell. Starting from a training-test set partition of data { X , X ⋆ } , our framew ork pr odu ce s factor mo dels C and D A G candidates B w ith and with - out laten t v ariables Z that can b e compared in terms of how well they fi t the data using test lik eliho o ds L . The v ariable ordering P needed b y the D A G is obtained as a b yp rodu ct of a factor mo d el in ference. Besides, changing the pr ior o ver laten t v ariables Z p rod u ces t w o v ariants of SLIM calle d CSLIM and SNIM. net works and p erform quantit ativ e mo del comparison b et ween them 1 . Mo del comparison ma y b e used for mo del selection or serve as a hyp othesis-generat ing to ol. W e use the lik eli- ho od on a test set as a computationally simple quan titativ e proxy for mo del comparison and as an alternativ e to the marginal lik eliho o d. Th e other t wo k ey ingredien ts in the framew ork are the u se of sparse and iden tifiable mo del comp onen ts ( Carv alho et al. , 2008 , Kagan et al. , 1973 , resp ectiv ely) and the sto c hastic search for the correct order of the v ariables needed b y th e D AG repr esen tation. Lik e LiNGAM, SLIM exploits the close r el ationship b et we en factor m o dels and D A Gs. Ho wev er, since we are interested in the f ac tor mo del b y itself, w e will not constrain the factor loading matrix to ha v e triangular form, but allo w f or sparse solutions so prun ing is not needed. Rather w e ma y ask whether there exists a p ermutatio n of th e factor-loa ding matrix agreeing to the D A G assumption (in a probabilistic sense). The slab and spike pr io r b ia ses to w ards sparsit y so it mak es sens e to searc h for a p erm u ta - tion in parallel w ith factor mo del inf erence. W e p rop o se to use sto c hastic up dates for the p erm u tat ion using a Metrop olis-Hastings acceptance ratio based on lik eliho ods with the factor-loa ding matrix b eing masked. In practice this approac h giv es go o d s olutions u p to at least fifty dimensions. Giv en a set of p ossible v ariable orderings in f erred b y th is metho d, w e can then learn D AGs using slab and spike pr iors for their connectivit y m atrices. The so-calle d slab and s pik e p rior is a t wo- comp onen t mixtur e of a con tin uous d istribution and degenerate δ -function p oin t mass at zero. This t yp e of m odel implicitly d efines a prior o v er 1. A preliminary versio n of our approach app ears in N IPS 2009: Henao and Winther, Bay esian sparse factor mod el s and DAGs inference and comparison. 666 Sp arse Linear Identifiable Mul tiv aria te Modeling structures and is th u s a computationally attractiv e alternativ e to com binatorial structure searc h since parameter and structure inference are p erformed simultaneo usly . A k ey to effec- tiv e learning in these int ractable mod els is Mark o v Chain Monte Carlo (MCMC) sampling sc h emes that mix w ell. F or non-Gaussian h ea vy-tailed distribu tio ns like the L a place and t -distributions, Gibbs sampling can b e efficien tly defined using app ropriate infi n ite scale mixture represen tations of these d istributions ( Andrews and Mallo ws , 1974 ). W e also sh o w that our mo del is v ery fl exi ble in th e sense that it can b e easily extended by only c h a ng- ing the p rior distrib ution of a set of laten t v ariables, for instance to allo w for time series data (CSLIM, Correlated S LIM) an d non-linearities in the D A G structure (SNIM, Sp ars e non-Linear Identifiable Multiv ariate mo deling) th rough Gaussian pro cess priors. The rest of the pap er is organized as follo ws: Section 2 describ es the mo del and its iden tifiabilit y prop erties. Section 3 pro vid es all prior sp ecification in cluding sparsity , laten t v ariables and drivin g signals, order search and extensions for correlated d ata (CSL I M) and non-linearities (SNIM). Section 4 elab orates on mo del comparison. Section 5 and App endix A pro vide an o verview of the mo del and practical details on the MCMC-based inference, p roposed w orkfl o w an d computational cost requ ir emen ts. Section 6 con tains the exp erimen ts. W e show sim ulations based on artificial data to illus trat e all the features of the mo del p roposed. Real b iological d at a exp erimen ts illustrate the adv anta ges of considerin g differen t v arian ts of Ba yesia n net works. F or all data sets we compare with some of the most relev ant existing metho ds. Section 7 concludes with a discussion, op en questions and future directions. 2. Linear B a y esian net works A Bay esian net work is essen tially a j oint p robabilit y distrib u tio n defin ed via a dir ected acyclic graph, where eac h n ode in the graph represents a r andom v ariable x . Due to the acyclic prop erty of the graph , its no de set x 1 , . . . , x d can b e p artiti oned in to d subsets { V 1 , V 2 , . . . , V d } ≡ V , su c h that if x j → x i then x j ∈ V i , i.e. V i con tains all p ar ents of x i . W e can then write the join t distribution as a pro duct of cond itionals of the form P ( x 1 , . . . , x d ) = d Y i =1 P ( x i | V i ) , th us x i is conditionally in depen den t of { x j | x i / ∈ V j } giv en V i for i 6 = j . T his means that p ( x 1 , . . . , x d ) can b e u sed to d esc rib e th e join t pr ob ab ility of an y set of v ariables once V is giv en. The problem is that V is usually unknown and th us needs to b e (at least p artia lly) inferred from observ ed data. W e consid er a mo del for a fairly general class of linear Bay esian n et w orks by putting together a linear D A G, x = Bx + z , and a factor mo del, x = Cz + ǫ . Our goal is to explain eac h one of d observe d v ariables x as a linear com b inatio n of the remaining ones, a set of d + m indep enden t laten t v ariables z and additiv e noise ǫ . W e h a v e then x = ( R ⊙ B ) x + ( Q ⊙ C ) z + ǫ , (1) where ⊙ is the element- wise pro duct and we can further id en tify the follo win g elemen ts: 667 Henao and Winther • z is partitioned into t w o subsets, z D is a set of d d r iving signals for eac h observe d v ariable in x and z L is a set of m shared general pu rp ose laten t v ariables. z D is used her e to describ e the intrinsic b eha vior of the observ ed v ariables that cannot regarded as “external” noise. • R is a d × d binary connectivit y matrix that encod es whether there is an edge b et ween observ ed v ariables, by m ea ns of r ij = 1 if x i → x j . Since every non-zero elemen t in R is an edge of a D AG, r ii = 0 and r ij = 0 if r j i 6 = 0 to av oid self-int eractions and bi-directional edges, resp ectiv ely . This also im p lies that there is at least one p erm u ta tion matrix P suc h that P ⊤ RP is strictly low er triangular wh er e w e hav e used th at P is orthonormal then P − 1 = P ⊤ . • Q = [ Q D Q L ] is a d × ( d + m ) binary connectivit y matrix, this time for the conditional indep endence relations b et w een observ ed and latent v ariables. W e assume that eac h observ ed v ariable has a dedicated laten t v ariable, th u s the first d columns of Q D are the iden tit y . T he remaining m columns can b e arbitrarily sp ecified, by means of q ij 6 = 0 if there is an edge b et w een x i and z j for d < j ≤ m . • B and C = [ C L C D ] are resp ectiv ely , d × d and d × ( d + m ) w eigh t matrices contai ning the edge strengths for the Ba yesian net work. Their elemen ts are constrained to b e non-zero only if their corresp onding connectivities are also non-zero. The mo del ( 1 ) has t wo imp ortan t sp ecial cases, (i) if all elemen ts in R and Q D are zero it b ecomes a stand a rd factor mo del (FM) and (ii) if m = 0 or all elemen ts in Q L are zero it is a pur e D AG. The mo del is not a completely general linear Bay esian net work b ecause connections to laten t v ariables are absent (see for example Silv a , 2010 ). Ho wev er, this restriction is mainly in tro duced to a voi d compr omising th e identifiabilit y of the mo del. In the follo win g we will only write Q and R explicitly when we sp ecify the sparsit y mo deling. 2.1 Iden tifia bility W e will split the ident ifiabilit y of the mo del in equation ( 1 ) in three parts add r essing fir st the factor mo del, second the pu re D A G and finally the fu ll mo del. By id entifiabilit y w e mean that eac h different setting of the parameters B and C gives a un iqu e distribution of the data. In s ome cases the mo del is only uniqu e up to some symmetry of the mo del. W e discuss th ese symmetries and their effect on mod el interpretation in the follo w ing. Iden tifiabilit y in factor mo dels x = C L z L + ǫ can b e obtained in a num b er of w ays (see Chapter 10, Kagan et al. , 1973 ). Probably the easiest wa y is to assume sp arsit y in C L and restrict its num b er of f ree parameters, for example b y restricting the dimension- alit y of z , namely m , according to the Ledermann b ound m ≤ (2 d + 1 − (8 d + 1) 1 / 2 ) / 2 ( Bekk er and ten Berge , 1997 ). Th e Ledermann b oun d guarantees the identifica tion of ǫ and follo ws just fr om counting the num b er of free parameters in the co v ariance matrices of x , ǫ an d in C L , assuming Gaussianity of z and ǫ . Alternativ ely , ident ifiabilit y is ac hiev ed using non-Gaussian distributions for z . Kagan et al. (Theorem 10.4.1, 1973 ) states that when at least m − 1 laten t v ariables are non-Gaussian, C L is iden tifiable up to scale and p erm u tat ion of its columns, i.e. we can identify b C L = C L S f P f , where S f and P f are arbi- trary scaling and p erm utation matrices, resp ectiv ely . Comon ( 199 4 ) p ro vided an alternativ e 668 Sp arse Linear Identifiable Mul tiv aria te Modeling x 1 z 1 x 2 z 2 x 3 z 3 x 4 z 4 x 1 x 2 x 3 x 4 z 1 z 2 z 3 z 4 0 0 0 0 1 0 0 0 0 1 0 0 1 0 1 0 x 1 x 2 x 3 x 4 x 1 x 2 x 3 x 4 R ⊙ B 1 0 0 0 1 1 0 0 1 1 1 0 2 1 1 1 z 1 z 2 z 3 z 4 x 1 x 2 x 3 x 4 D ( I − R ⊙ B ) − 1 Figure 2: FM-D A G equiv alence illustration. In the left side, a D A G mo del with four v ari- ables with corresp onding connectivit y matrix R , b ij = 1 when r ij = 1 and C D = I . In the right hand side, the equiv alent factor mo del with mixing matrix D . Note that the factor mo del is spars e ev en if its corresp ond ing D AG is dense. The gra y b o xes in D and R ⊙ B rep resen t elemen ts that must b e zero by construction. w ell-kno wn p roof for the particular case of m − 1 = d . The S f and P f symmetries are in- heren t in the factor mo del definition in all cases and will usually not affect in terpretabilit y . Ho wev er, some r esearchers prefer to make the mo del completely identifiable, e.g. b y making C L triangular with non-negativ e diagonal elemen ts ( Lop es and W est , 2004 ). In add iti on, if all comp onen ts of ǫ are Gaussian an d the rank of C L is m , then the distrib u tio ns of z and ǫ are uniquely defined to within common shift in mean (Theorem 10.4.3, Kagan et al. , 1973 ). In this pap er, we us e the non-Gaussian z option for tw o reasons, (i) restricting the num b er of laten t v ariables severely limits the usability of the mo del and (ii) non-Gaussianity is a more r ealistic assumption in man y applicatio n areas su c h as f or example biology . F or pure DA G mo dels x = Bx + C D z D , ident ifiabilit y can b e obtained using the factor mo del result fr om K ag an et al. ( 1973 ) b y rewriting the D A G into an equiv alent factor mo del x = Dz with D = ( I − B ) − 1 C D , see Figure 2 . F r om the factor mo del result it only follo ws that D is ident ifiable up to a scaling and p erm utation. Ho wev er, as men tioned ab o ve, d ue to the acyclicit y there is at least one p erm u tation matrix P s uc h th at P ⊤ BP is str ictly lo wer triangular. No w, if x adm its D A G representa tion, the same P m ak es the p ermuted b D = ( I − P ⊤ BP ) − 1 C D , triangular with C D on its diagonal. The constraint on the n umber of non-zero elemen ts in D due to triangularit y remov es the p erm utation freedom P f suc h that we can su bsequen tly id en tify P , B and C D . It also implies th at any v alid p erm u tat ion P will p rodu ce exactly the same d istribution for x . In the general case in equation ( 1 ), D = ( I − B ) − 1 C is of size d × ( d + m ). What w e will sho w is that ev en if D is still identifiable, we can no longer obtain B and C un iquely u nless w e “tag” th e mo del b y requiring the distributions of driving signals z D and laten t signals z L to d iffer. In order to illus trat e why we get non-iden tifiabilit y , w e can wr ite x = Dz in v erting D explicitly . F or simplicit y w e consider m = 1 and P = I but generalizing to m > 1 is straigh t forwa rd 669 Henao and Winther z L x 1 1 x 2 1 z 1 1 z 2 1 (a) z ′ L x 1 1 x 2 -1 1 z ′ 1 1 z ′ 2 1 (b) Figure 3: Two D AG s with laten t v ariables. Th ey are equiv alent if z has the same distribu- tion as z ′ . x 1 x 2 x 3 . . . x d = c 11 0 0 · · · c 1 L b 21 c 11 c 22 0 · · · b 21 c 1 L + c 2 L b 31 c 11 + b 32 b 21 c 11 b 32 c 22 c 33 · · · b 31 c 1 L + b 32 b 21 c 1 L + a 32 c 2 L + c 3 L . . . . . . . . . . . . . . . c 11 + P i − 1 k =1 b ik d k 1 · · · · · · · · · c iL + P i − 1 k =1 b ik d kL z 1 z 2 z 3 . . . z d +1 . W e see from this equation that if all laten t v ariables h a v e the same distrib u tio n and c 1 L is non-zero then w e ma y exc hange the first and last column in D to get tw o equiv alent distributions with different elements for B and C . The mo del is thus n on-iden tifiable. I f the firs t i elements in laten t column of C are zero then the ( i + 1)-th and last column can b e exc hanged. Ho yer et al. ( 2008 ) made the same basic observ ation through a num b er of examples. Interestingl y , we also see from the triangularit y requir ement of the “d r iving signal” p art of D that P is actually iden tifiable despite th e fact that B and C are not. T o illustrate that the non-ident ifiabilit y ma y lead to qu ite severe confusion ab out inferences, consider a mo del with only t wo observed v ariables x = [ x 1 , x 2 ] ⊤ and c 11 = c 22 = 1. Tw o differen t hyp othesis { b 21 , c 1 L , c 2 L } = { 0 , 1 , 1 } and { b 21 , c 1 L , c 2 L } = { 1 , 1 , − 1 } with graphs sho wn in Figure 3 ha v e equiv alent factor mo dels wr itt en as x 1 x 2 = 1 0 1 0 1 1 z 1 z 2 z L and x 1 x 2 = 1 0 1 1 1 0 z ′ 1 z ′ 2 z ′ L . The t wo mo d els ab o v e hav e the same mixing matrix D , up to p erm utation of columns P f . In general w e exp ect the n u mb er of solutions with equ iv alen t distribu tio n ma y b e as large as 2 m , corresp onding to th e num b er of times a column of D fr om its latent part (last m columns) con b e exc hanged with a column f rom its observ ed p art (first d column s). This readily assumes that the sparsit y pattern in D is ident ified, whic h follo ws fr om the r esults of Kagan et al. ( 1973 ). One wa y to get ident ifiabilit y is to c hange the distr ibutions z D and z L suc h that they differ and cannot b e exc h ange d. Here it is not enough to c hange the scale of the v ariables, i.e. v ariance for con tinuous v ariables, b ecause this effect can b e counte red by rescaling C with S f . S o we need distributions that differ b ey on d rescaling. In our examples we use Laplace and the more hea vy-tailed Cauc hy for z D and z L , resp ectiv ely . This sp ecification is n ot unp roblemati c in pr ac tical situations how ev er it can b e sometimes r estrict iv e and prone to mod el mismatc h issues. W e neve rtheless show one practical example whic h leads to sensible inferences. 670 Sp arse Linear Identifiable Mul tiv aria te Modeling In time series ap p lica tions for example, it is natural to go b ey ond an i.i.d. mo del f or z . One may for example use a Gaussian pro cess prior for eac h factor to get smo othness o v er time, i.e. z j 1 , . . . , z j N | ν j ∼ N (0 , K ν j ), where K ν j is the co v ariance matrix with element s k j,nn ′ = k υ j ,n ( n, n ′ ) and k υ j ,n ( · ) is the cov ariance function. F or the i.i.d. Gaussian mo del the source distribu tion is only iden tifiable up to an arb itrary rotation matrix U , i.e. the rotated factors Uz are still i.i.d. . W e can sho w that con trary to the i.i.d. Gaussian mo del, the Gaussian pro cess factor mo d el is iden tifiable if the co v ariance functions d iffer. W e need to sh o w that b Z = UZ has a different co v ariance structure than Z = [ z 1 . . . z N ]. W e get z n z ⊤ n ′ = d iag ( k 1 ,nn ′ , . . . , k d + m,nn ′ ) and b z n b z ⊤ n ′ = U z n z ⊤ n ′ U ⊤ = U diag ( k 1 ,nn ′ , . . . , k d + m,nn ′ ) U ⊤ for the original and rotated v ariables, resp ectiv ely . The co v ariances are ind eed different and the mo del is thus iden tifiab le if no co v ariance functions k υ j ,n ( n, n ′ ), j = 1 , . . . , d + m are the same. 3. Prior sp ecification In this section we pro vide a detailed d escription of the priors used for eac h one of the elemen ts of our s parse linear iden tifiable mo del already defin ed in equation ( 1 ). W e start with ǫ , the noise term that allo w us to quanti fy the mismatc h b et w een a set of N observ ations X = [ x 1 . . . x N ] an d the mo del itself. F or this pu r p ose , we use uncorrelated Gaussian noise comp onen ts ǫ ∼ N ( ǫ | 0 , Ψ ) with conjugate in v ers e gamma p riors for their v ariances as follo ws X | m , Ψ ∼ N Y n =1 N ( x n | m , Ψ ) , Ψ − 1 | s s , s r ∼ d Y i =1 Gamma( ψ − 1 i | s s , s r ) , where w e ha ve already marginalized out ǫ , Ψ is a d iag onal co v ariance matrix den ot ing uncorrelated noise across dimensions and m is the mean v ector suc h that m FM = C z n and m DA G = Bx n + Cz n . In the noise co v ariance h yp erpr ior, s s and s r are the shap e and rate, resp ectiv ely . Th e selection of h yp erp arame ters for Ψ should not b e very critical as long as b oth “signal and n oise” h yp otheses are sup p orted, i.e. diffuse enough to allo w for s mall v alues of ψ i as well as for ψ i = 1 (assumin g that the data is standardized in adv ance). W e set s s = 20 and s r = 1 in th e exp eriments for in sta nce. Another issu e to consider when selecting s s and s r is the Ba yesian analogue of the Heyw o od problem in whic h lik eliho od functions are b ound ed b elo w a wa y from zero as ψ i tends to zero, hence inducing multi- mo dalit y in the p osterior of ψ i with on e of the m o des at zero. The latter can b e a v oided b y sp ecifying s s and s r suc h that th e prior deca ys to zero at the origin, as w e did ab o ve. It is w ell known, for example, that Heywoo d p roblems cannot b e av oided us ing improp er reference p riors, p ( ψ i ) ∝ 1 /ψ i ( Martin and McDonald , 1975 ). The remaining compon ents of the mo del are describ ed as it follo ws in five p arts named sparsit y , laten t v ariables and driving s ig nals, order search, allo wing for correlate d data and allo wing for non-linearities. Th e fi rst part addresses the interpretabilit y of the mo del by means of parsimonious priors for C and D . The second part describ es the t yp e of non- Gaussian d istributions used on z in order to kee p the mo del ident ifiable. The third part 671 Henao and Winther considers ho w a searc h o v er p erm utations of the obs er ved v ariables can b e used in order to hand le the constrain ts imp osed on matrix R . The last tw o parts describ e h ow in tr o duc- ing Gaussian p r ocess pro cess p riors in the m o del can b e used to mo del non-indep end ent observ ations and non-linear dep endencies in the D AGs. 3.1 Sparsit y The use of sparse mo dels will in man y cases give in terpretable r esults and is often motiv ated b y the principle of parsimony . Also, in many application domains it is also natural from a pr edict ion p oin t of view to en f orce sparsit y b ecause the num b er of exp la natory v ariables ma y exceed th e num b er of examples by orders of magnitude. In regularized maximum lik eliho o d t yp e formulat ions of learning (maxim u m a-p oste riori) it has b ecome p opular to use on e-norm ( L 1 ) regularization for example to ac h iev e sparsity ( Tibshirani , 199 6 ). In the fully Ba y esian inference setting (with a verag ing o v er v ariables), the corresp onding Lap lace prior will not lead to sp arsit y b ecause it is v ery un likely for a p osterior summ ary lik e the mean, median or mo de to b e estimated as exactly zero ev en asymptotically . Th e same effect can b e exp ected from an y contin uous distrib ution used for s p arsit y lik e Stu den t’s t , α -stable and bimo dal p riors (con tin uous slab and spike priors, Ish wa ran and Rao , 2005 ). Exact zeros can only b e ac h iev ed by placing a p oin t mass at zero, i.e. explicitly sp ecifying that the v ariable at hand is zero or n ot with some pr ob ab ility . This has motiv ated the in tro duction of many v ariant s o ver the y ears of so-called slab and spike priors consisting of tw o comp onent mixtures of a con tinuous part and a δ -function at zero ( Lemp ers , 1971 , Mitc hell and Beauc hamp , 1988 , George and McCullo c h , 1993 , Gewe k e , 1996 , W est , 2003 ). In this paradigm, the columns of matrices C or B enco de resp ectiv ely , the connectivit y of a factor or th e set of p aren ts asso ciated to an observed v ariable. It is natural then to share information across elemen ts in column j b y assu ming a common sparsit y lev el 1 − ν j , suggesting the follo wing hierarc h y c ij | q ij , · ∼ (1 − q ij ) δ ( c ij ) + q ij Con t( c ij |· ) , q ij | ν j ∼ Bernoulli( q ij | ν j ) , ν j | β m , β p ∼ Beta( ν j | β p β m , β p (1 − β m )) , (2) where Q , the b inary matrix in equation ( 1 ) app ears n atur al ly , δ ( · ) is a Dirac δ -function, Con t( · ) is the con tin uous slab comp onen t, Bernoulli( · ) and Beta ( · ) are Bern oulli and b eta distributions, resp ectiv ely . Reparameterizing the b eta distribution as Beta( ν j | αβ /m, β ) and taking th e n umber of columns m of Q ⊙ C to infi n it y , leads to the non-p arame tric version of the slab and spike mo d el with a so-called In d ian buffet pro cess pr io r ov er the (infi nite) masking matrix Q = { q ij } ( Ghahramani et al. , 2006 ). Note also that q ij | ν j is mainly us ed for clarit y to mak e the binary indicators explicit, nev ertheless in practice w e can work directly with c ij | ν j , · ∼ (1 − ν j ) δ ( c ij ) + ν j Con t( c ij |· ) b ecause q ij can b e marginalized out. As illustrated and p oint ed out by Lucas et al. ( 2006 ) and Carv alho et al. ( 2008 ) the mo del with a shared b eta-distributed sparsity lev el p er factor introdu ces the u ndesirable side-effect that there is str ong co-v ariation b et w een the elements in eac h column of the masking matrix. F or example, in high d imensions w e migh t exp ect that only a finite n um b er of elements are non-zero, imp lyin g a prior fa voring a very high sparsit y rate 1 − ν j . Because of the co-v ariation, ev en the parameters that are clearly non-zero will ha v e a p osterior 672 Sp arse Linear Identifiable Mul tiv aria te Modeling probabilit y of b eing non-zero, p ( q ij = 1 | x , · ), qu it e spread o v er the un it interv al. Conv ersely , if our pr iors do not f a v or sparsity str on gly , then the opp osite situation will arise and the solution will b ecome completely den se. In general, it is difficult to s et the hyperp aramete rs to ac hieve a sensible spars it y lev el. Ideally , we w ould lik e to ha v e a mo del with a high sparsit y lev el w ith high certain t y ab out the non-zero parameters. W e can ac hiev e th is b y in tro ducing a sparsity parameter η ij for eac h element of C whic h h as a mixture distribution with exactly this prop ert y q ij | η ij ∼ Bernoulli( q ij | η ij ) , η ij | ν j , α p , α m ∼ (1 − ν j ) δ ( η ij ) + ν j Beta( η ij | α p α m , α p (1 − α m )) . (3) The distribu tio n o v er η ij expresses that w e exp ect parsimony: either η ij is zero exactly (implying that q ij and c ij are zero) or non-zero dr a wn from a b eta distrib u tio n fav oring high v alues, i.e. q ij and c ij are non-zero with high probability . W e use α p = 10 and α m = 0 . 95 whic h has mean α m = 0 . 95 an d v ariance α m (1 − α m ) / (1+ α p ) ≈ 0 . 086. The exp ected sparsity rate of the mo dified mo del is (1 − α m )(1 − ν j ). Th is mo del has the additional adv antag e that the p osterior distr ibution of η ij directly measures the distribu tio n of p ( q ij = 1 | x , · ). T his is ther efore the statistic for ranking/selection pu rp oses. Besides, we may wan t to reject in teractions with h igh uncertaint y lev els w hen the probability of p ( q ij = 1 | x , · ) is less or v ery close to the exp ected v alue, α m (1 − ν j ). T o complete the s pecification of the prior, w e let the contin uous slab part in equation ( 2 ) b e Gaussian distributed w ith in v erse gamma p rior on its v ariance. In addition, w e scale the v ariances with ψ i as Con t( c ij | ψ i , τ ij ) = N ( c ij | 0 , ψ i τ ij ) , τ − 1 ij | t s , t r ∼ Gamma( τ − 1 ij | t s , t r ) . (4) This scaling makes th e mo del easier to sp ecify and tend to ha v e b etter mixing prop erties (see P ark and Casella , 2008 ). The slab and spik e for B (D A G) is obtained from equations ( 2 ), ( 3 ) and ( 4 ) b y simply replacing c ij with b ij and q ij with r ij . As already men tioned, w e use α p = 10 and α m = 0 . 95 for the hierarc h y in equation ( 3 ). F or the column-shared parameter ν j defined in equation ( 2 ) w e set the p recisio n to β p = 100 and consider the mean v alues for factor mo dels and DA Gs separately . F or the factor mo del w e set a diffuse p rior by making β m = 0 . 9 to r eflect that some of the factors can b e in general nearly dense or empt y . F or the D AG w e consider t wo settings, if we exp ect to obtain dense graph s we set β m = 0 . 99, otherwise w e set β m = 0 . 1. Both settings can pro duce sparse graphs, ho wev er smaller v alues of β m increase the ov erall sparsit y rate and the gap b et ween p ( r ij = 0) and p ( r ij = 1). A large separation b etw een these tw o p r obabiliti es mak es in terpr et ation easier and also helps to sp ot non-zeros (edges) with h igh uncertain ty . The h yp erparameters for the v ariance of the n o n-zero elemen ts of B and C are set to get a diffus e prior distrib ution b ounded a wa y from zero ( t s = 2 and t r = 1), to allo w for a b etter s eparat ion b et ween slab and spike comp onen ts. F or the particular case of C L , in principle th e prior should not ha ve su pp ort on zero at all, i.e. the driving signal sh ould not v anish, ho w ev er for simp lic it y w e allo w this an ywa y as it has n ot giv en any p roblems in practice. Figure 4 sho ws a particular example of the p osterior, p ( c ij , η ij | x , · ) for t w o elemen ts of C under the prior just describ ed. In the example, c 64 6 = 0 with high pr obabilit y according to η ij , whereas c 54 is almost certainly zero 673 Henao and Winther 0 0.1 0.2 0.3 0.4 0.5 0.6 0.7 0 2000 4000 6000 8000 P S f r a g r e p l a c e m e n t s Density c ij η i j c 64 c 54 η 6 4 η 5 4 (a) 0.1 0.2 0.3 0.4 0.5 0.6 0.7 0.8 0.9 0 1000 2000 3000 4000 5000 6000 P S f r a g r e p l a c e m e n t s Density c i j η ij c 6 4 c 5 4 η 64 η 54 (b) Figure 4: S la b and spik e prior example. (a) Po sterior unn ormaliz ed d ensities for the magni- tude of tw o particular elemen ts of C . (b) P osterior densit y for η ij = p ( c ij 6 = 0 | x , · ). Here, c 64 6 = 0 and c 54 = 0 corresp ond to elemen ts of the mixing matrix from the exp erimen t sho wn in Figure 8 . since most of its probability mass is lo cated exactly at zero, w ith some residu al mass on the vicinit y of zero, in Figure 4(a) . In th e one lev el hierarc hy equation ( 2 ) sp arsit y parameters are shared, η 64 = η 54 = ν 4 . The result w ou ld then b e less parsimonious with the p osterior densit y of ν 4 b eing spread in the unit interv al with a sin gle mo de located close to β m . 3.2 Laten t v ariables and driving signals W e consider t wo d iffe rent non-Gaussian — hea vy-tailed priors for z , in order to obtain iden tifiable f actor mod els and D A Gs. A wide class of con tinuous, un imodal and sym - metric distribu tio ns in one dimension can b e represen ted as infi nite scale mixtures of Gaussians, whic h are ve ry con v enien t for Gibb s-sampling-based inferen ce. W e f o cus on Student’s t and Laplace d istributions wh ic h ha ve th e f ol lo w ing mixture r epresen tation ( Andrews and Mallo ws , 1974 ) Laplace( z | µ, λ ) = Z ∞ 0 N ( z | µ, υ )Exp onen tial ( υ | λ 2 ) dυ , (5) t ( z | µ, θ , σ 2 ) = Z ∞ 0 N ( z | µ, υ σ 2 )Gamma υ − 1 θ 2 , θ 2 dυ , (6) where λ > 0 is the rate, σ 2 > 0 the scale, θ > 0 is the degrees of freedom, and the distributions hav e exp onen tial and gamma mixing d ensities accordingly . F or v arying degrees of freedom θ , the t d istr ibution can in terp olate b et we en very hea vy-tailed (p o wer la w and Cauc hy when θ = 1) and v ery light tailed, i.e. it b ecomes Gaussian wh en the degrees of freedom approac h es infinity . The Laplace (or bi-exp onen tial) distribution h as tails whic h are intermediate b et w een a t (with fi nite degrees of freedom) and a Gaussian. In this sense, the t distr ib ution is more flexible b ut requir es more careful selection of its hyperp aramet ers b ecause the mo del ma y b eco me non-iden tifiable in the large θ limit (Gaussian). An adv an tage of the Laplace distrib u tio n is that we can fi x its p aramet er λ = 1 and let the mo del learn th e appropr ia te scaling from C in equation ( 1 ). If we use the pure DA G mo del, we will need to ha v e a hyp erprior for λ 2 in ord er to learn the v ariances of the laten t v ariables/driving signals, as in Henao and Win ther ( 200 9 ). A hierarc h ica l prior for th e 674 Sp arse Linear Identifiable Mul tiv aria te Modeling degrees of freedom in th e t distribu tio n is not easy to sp ecify b ecause there is no conjugate prior a v ailable w ith a standard closed form. Although a conjugate prior exists, is not straigh tforward to sample f rom it, since n umerical int egration m ust b e us ed to compute its normalization constant. Another p ossibilit y is to tr eat θ as a discrete v ariable so computing the n o rmalizing constant b ecomes straigh t forward. Laplace and S tuden t’s t are n ot the only distribu tions admitting scale mixture repr esen- tation. This mean th at any other compatible t yp e can b e used as well, if the application requires it, and without considerable additional effort. Some examples include the logistic distribution ( Andrews and Mallo ws , 1974 ), the s ta ble family ( W est , 1987 ) and ske w ed v er- sions of hea vy-tailed distributions ( Branco and Dey , 2001 ). Another natural extension to the mixtures s cheme could b e, for example, to set the mean of eac h comp onen t to arbitrary v alues and let the n umber of comp onen ts b e an infinite sum , th u s end ing up pro viding eac h factor w ith a Diric hlet pro cess p rior. This migh t b e useful for cases w hen the laten t factors are exp ected to b e scattered in clusters due to the p resence of subgroup s in the data, as w as sho wn b y Carv alho et al. ( 2008 ). 3.3 Order search W e need to infer the order of the v ariables in the D AG to meet the constrain ts imp osed on R in Section 2 . The most ob vious w a y is to try to solve this task by inferrin g all parameters { P , B , C , z , ǫ } b y a Marko v chain Mon te Carlo (MCMC) metho d suc h as Gibb s samplin g . Ho wev er, algorithms for searc hin g o v er v ariable order prefer to wo rk with m odels for w h ic h parameters other than P can b e m argi nalized analytical ly (see F riedm an and Koller , 2003 , T eyssier and K oller , 2005 ). F or our mo del, where w e cannot marginalize analytica lly o v er B (due to R b eing bin ary ), estimating P and B b y Gibb s sampling w ould mean that we had to prop ose a new P for fixed B . F or example, exchanging th e order of t wo v ariables w ould mean that th ey also exc h ange parameters in the DA G. Suc h a prop osal w ould h av e v ery lo w acceptance, mainly as a consequ ence of the size of the search space and th us v ery p o or mixing. In fact, for a giv en d n um b er of v ariables there are d ! p ossible orderings P , while there are d !2 ( d ( d +2 m − 1) ) / 2 p ossible structures for { P , B , C } . W e therefore opt for an alternativ e strategy by exploiting th e equiv alence b etw een factor mo dels and D A Gs sh own in Section 2.1 . In particular for m = 0, since B can b e p erm uted to strictly low er trian- gular, then D = ( I − B ) − 1 C D can b e p erm uted to triangular. This means that w e can p erform inference for the factor mo del to obtain D while searching in parallel for a set of p erm u tat ions P that are in go o d agreemen t (in a probabilistic sense) w ith the triangular requirement of D . Su c h a set of orderin gs is foun d dur ing the inference pro cedure of the factor m odel. T o set up the sto c hastic searc h, we need to m odify the f ac tor mo del sligh tly b y introd u cing separate data (ro w) and f ac tor (column) p erm utations, P and P f to ob- tain x = P ⊤ DP f z + ǫ . The reason for u sing t w o differen t p erm utation matrices, rather than only one lik e in the definition of th e D AG mo del, is that w e need to accoun t for the p erm u tat ion freedom of the factor mo del (see Section 2.1 ). Using the same p erm utation for row and column w ould thus require an additional step to iden tify the columns in the factor mo del. W e make inference f o r the u n restricted factor mo del, but prop ose P ⋆ and P ⋆ f indep endent ly according to q ( P ⋆ | P ) q ( P ⋆ f | P f ). Both d istributions dr a w a new p ermu- tation matrix by exc hanging t w o rand omly c hosen elemen ts, e.g. the order ma y c hange as 675 Henao and Winther [ x 1 , x 2 , x 3 , x 4 ] ⊤ → [ x 1 , x 4 , x 3 , x 2 ] ⊤ . In other w ord s, the prop osals q ( P ⋆ | P ) and q ( P ⋆ f | P f ) are uniform distrib utions o ve r the space of transp ositions for P and P f . Assumin g we ha ve no a-priori pr eferr ed ordering, w e ma y use a Metrop olis-Hastings (M-H) acceptance probability min(1 , ξ → ⋆ ) with ξ → ⋆ as a simple ratio of like liho od s with the p ermuted D mask ed to matc h the triangularit y assu mption. F orm al ly , w e u se the binary mask M (con taining zeros ab o v e the d ia gonal of its d fir st columns) and wr ite ξ → ⋆ = N ( X | ( P ⋆ ) ⊤ ( M ⊙ P ⋆ D ( P ⋆ f ) ⊤ ) P ⋆ f Z , Ψ ) N ( X | P ⊤ ( M ⊙ PDP ⊤ f ) P f Z , Ψ ) , (7) where M ⊙ D is the mask ed D and Z = [ z 1 . . . z N ]. T he pro cedure can b e seen as a simple ap p roac h for generating hyp otheses ab out go o d orderin gs, pr o ducing close to trian- gular versions of D , in a mo del wher e the slab and sp ik e p rior pro vide th e required bias to wards sparsity . On ce th e in f erence is done, we end up ha vin g an estimate f or the desired distribution ov er p erm utations P = P d ! i π i δ P i , where π = [ π 1 π 2 . . . ] is a sparse ve ctor con taining the probability for P = P i , whic h in our case is prop ortional to the num b er of times p ermutat ion P i w as accepted by the M-H u p d at e during inference. Note that P f is just a n u isance v ariable that do es not need to b e stored or summarized. 3.4 Allo wing for correlated data (C SLIM) F or the case where indep endence of observed v ariables cann ot b e assu med, for instance due to (time) correlation or smo othness, the priors d iscussed b efore for the laten t v ariables and driving signals d o n ot really app ly anymore, ho w ev er the only c h ange w e need to make is to allo w elemen ts in ro ws of Z to correlate. W e can assu me then ind ep endent Gaussian pro cess (GP) priors for eac h laten t v ariable in s te ad of scale mixtures of Gaussians, to obtain what w e ha ve called correlated sparse linear iden tifiable mo deling (CSLIM). F or a set of N realizatio ns of v ariable j w e set z j 1 , . . . , z j N | υ j ∼ GP( z j 1 , . . . , z j N | k υ j ,n ( · )) , (8) where the cov ariance f unction has the form k υ j ,n ( n, n ′ ) = exp( − υ j ( n − n ′ ) 2 ), { n, n ′ } is a p ai r of observ ation indices or time p oin ts and υ j is the length scale con trolling the o v erall lev el of correlation allo wed f or eac h v ariable (r o w) in Z . Conceptually , equation ( 8 ) implies th at eac h latent v ariable j is sampled f r om a fu nctio n and the GP acts as a p rior o ver con tin uous functions. Since su c h a length scale is ve ry difficult to set just by lo oking at the data, we further place priors on υ j as υ j | u s , κ ∼ Gamma( υ j | u s , κ ) , κ | k s , k r ∼ Gamma( κ | k s , k r ) . (9) Giv en that the cond itional d istribution of υ = [ υ 1 , . . . , υ m ] is n ot of an y stand ard form , Metrop olis- Hastings u pd ate s are u sed. In the exp eriment s w e use that u s = k s = 2 and k r = 0 . 02. T he details concerning in ference f or this mo del are giv en in App endix A . It is also p ossible to easily expand the p ossible applications of GP pr io rs in this con text b y , for instance, us in g more stru ct ured co v ariance fu nctio ns through scale mixture of Gaus- sian r epresen tations to obtain a prior distribu tion for con tinuous fun ctions with hea v y -tailed b eha vior — a t -p rocesses ( Y u et al. , 2007 ), or learning the cov ariance function as w ell using in v erse Wishart h yp erpriors. 676 Sp arse Linear Identifiable Mul tiv aria te Modeling 3.5 Allo wing for non-linearities (SNIM) Pro v id ed that w e kno w the tru e ordering of the v ariables, i.e. P is known then B is surely strictly lo w er triangular. It is very easy to allo w for non-linear interacti ons in the D A G mo del from equation ( 1 ) by rewriting it as Px = ( R ⊙ B ) Py + ( Q ⊙ C ) z + ǫ , (10) where y = [ y 1 , . . . , y d ] ⊤ and y i 1 , . . . , y iN | υ i ∼ GP( y i 1 , . . . , y iN | k υ i ,x ( · )) has a Gaussian pro cess pr ior with for instance, bu t not limited to, a stationary co v ariance fun ct ion lik e k υ i ,x ( x , x ′ ) = exp( − υ i ( x − x ′ ) 2 ), similar to equation ( 8 ) an d with the same h yp erprior structure as in equation ( 9 ). This is a straight forwa rd extension th at w e call spars e n on- linear multiv ariate mo deling (S NIM) that is in spirit similar to F riedm an and Nac hm an ( 2000 ), Ho y er et al. ( 2009 ), Zhang and Hyv¨ arinen ( 2009 , 2010 ), Tillman et al. ( 2009 ), h o w- ev er instead of treating the inherent multi ple regression problem in equation ( 10 ) and the conditional in dep endence of the observed v ariables indep endently , we pro ceed within our prop osed f ramew ork by letting the multiple r eg ressor b e sparse, thus the conditional in - dep endences are enco ded through R . T he main limitation of the mo del in equation ( 10 ) is that if the true orderin g of the v ariables is unkn o wn, the exhaustive enumeration of P is needed. This means that th is could b e done for v ery small netw orks, e.g. u p to 5 or 6 v ariables. In principle, an ordering searc h pro cedure for the non-linear m odel only requires the laten t v ariables z to ha v e Gaussian pro cess priors as w ell. T he main difficult y is that in order to b uild co v ariance functions for z w e n eed a set of ob s erv ations that are not a v ailable b ecause z is laten t. 4. Mo del comparison Quant itativ e mo del comparison b et ween factor mo dels and D AGs is a k ey ingredient in SLIM. Th e joint probabilit y of data X and parameters for the factor mo del part in equation ( 1 ) is p ( X , C , Z , ǫ , · ) = p ( X | C , Z , ǫ ) p ( C |· ) p ( Z |· ) p ( ǫ ) p ( · ) , where ( · ) indicates additional parameters in the hierarchica l mod el. F ormally the Ba y esian mo del selectio n y ardstic k, the marginal lik eliho o d for mod el M p ( X |M ) = Z p ( X | Θ , Z ) p ( Θ |M ) p ( Z |M ) d Θ d Z , can b e obtained b y marginalizing the join t o ver the parameters Θ and latent v ariables Z . Computationally this is a difficult task b ecause the m argi nal lik eliho o d cannot b e wr itt en as an av erage ov er the p osterior distribu tio n in a simple w a y . It is still p ossible u s ing MCMC metho ds, for example by partitioning of the parameter space an d m ultiple c h ains or thermo dynamic in tegration (see Chib , 1995 , Neal , 2001 , Murra y , 2007 , F riel and P ettitt , 2008 ), b ut in general it must b e considered as computationally exp ensive and non-trivial. On the other hand , ev aluating the lik eliho o d on a test set X ⋆ , u s ing predictiv e d ensitie s p ( X ⋆ | X , M ) is simpler fr om a computational p oin t of view b ecause it can b e written in terms of an a verag e ov er the p osterior of th e intensive variables , p ( C , ǫ , ·| X ) and the prior 677 Henao and Winther distribution of the extensive variables associated with the test p oin ts 2 , p ( Z ⋆ |· ) as L FM def = p ( X ⋆ | X , M FM ) = Z p ( X ⋆ | Z ⋆ , Θ FM , · ) p ( Z ⋆ |· ) p ( Θ FM , ·| X ) d Z ⋆ d Θ FM d ( · ) , (11) where Θ FM = { C , ǫ } . This av erage can b e app ro ximated b y a com bination of standard sampling an d exact marginalization u sing the s cale mixtu re representa tion of the hea vy- tailed distributions p resen ted in Section 3.2 . F or the full D AG mo del in equation ( 1 ), w e will n ot a v erage o ve r p ermutati ons P but rather calc ulate the test likelihoo d for a n umber of candid a tes P (1) , . . . , P ( c ) , . . . as L DA G def = p ( X ⋆ | P ( c ) , X , M DA G ) , = Z p ( X ⋆ | P ( c ) , X , Z ⋆ , Θ DA G , · ) p ( Z ⋆ |· ) p ( Θ DA G , ·| X ) d Z ⋆ d Θ DA G d ( · ) , (12) where Θ DA G = { B , C , ǫ } . W e us e sampling to compu te the test lik eliho o d s in equations ( 11 ) and ( 12 ). With Gibb s, w e d ra w samples from the p osterior distributions p ( Θ FM , ·| X ) and p ( Θ DA G , ·| X ), where ( · ) is sh orthand for examp le for the degrees of freedom θ , if Stu d en t t distribu tio ns are used. The a verag e o v er the extensiv e v ariables asso ciate d with the test p oin ts p ( Z ⋆ |· ) is s lig h tly more complicated b ecause naiv ely dr a wing samples from p ( Z ⋆ |· ) results in an estimator with high v ariance — for ψ i ≪ υ j n . Instead we exploit the infin ite mixture repr esen tation to marginalize exactly Z ⋆ and then dra w samples in turn for th e scale p arameters. Omitting the p erm utation matrices for clarit y , in general we get p ( X ⋆ | Θ , · ) = Z p ( X ⋆ | Z ⋆ , Θ , · ) p ( Z ⋆ |· ) d Z ⋆ , = Y n Z N ( x ⋆ n | m n , Σ n ) Y j p ( υ j n |· ) dυ j n ≈ 1 N rep Y n N rep X r N ( x ⋆ n | m n , Σ n ) , where N rep is the num b er of samples generated to appro ximate the in tractable inte gral ( N rep = 500 in the exp eriments). F or the factor mo del m n = 0 and Σ n = C D U n C ⊤ D + Ψ . F or th e DA G, m n = Bx ⋆ n and Σ n = CU n C ⊤ + Ψ . T he co v ariance matrix U n = diag( υ 1 n , . . . , υ ( d + m ) n ) with elemen ts υ j n , is sampled d irectl y from the p rior, accordingly . Once w e h a v e computed p ( X ⋆ | Θ FM , · ) for the factor mo del and p ( X ⋆ | Θ DA G , · ) for the D AG, w e can use them to a ve rage ov er p ( Θ FM , ·| X , ) and p ( Θ DA G , ·| X ) to obtain the predictiv e densities p ( X ⋆ | X , M FM ) and p ( X ⋆ | X , M DA G ), resp ectiv ely . F or the particular case in wh ic h X and consequently Z are correlated v ariables — CS LIM, w e use a slightly d ifferen t pro cedure for mo del comparison. I n stea d of using a test set, we randomly remo v e some prop ortion of the elemen ts of X and p erform inference with m issing v alues, then w e summarize the lik eliho o d on the missing v alues. In particular, for the factor mo del we use M miss ⊙ X = M miss ⊙ ( Q L ⊙ C L Z + ǫ ) wher e M miss is a binary masking matrix with zeros corresp onding to test p oin ts, i.e. the m issing v alues. S ee details in Ap pen d ix A . Note that this scheme is not exclusiv e to CS LIM th us can b e also u sed with SLIM or w hen the observed data con tain actual missin g v alues. 2. I n ten si ve means not scaling with th e sample size. Extensive means scaling with sample size in t his case the size of the t est sample. 678 Sp arse Linear Identifiable Mul tiv aria te Modeling 5. Mo del ov erview and practical details The three m odels describ ed in the previous section namely SLIM, CSLIM and SNIM can b e summarized as a graphical mo del and as a pr ob ab ilistic hierarc hy as follo ws x n | W , y n , z n , Ψ ∼ N ( x n | W [ y n z n ] ⊤ , Ψ ) , W = [ B C ] , ψ − 1 i | s s , s r ∼ Gamma( ψ − 1 i | s s , s r ) , w ik | h ik , ψ i , τ ik ∼ (1 − h ik ) δ 0 ( w ik ) + h ik N ( w ik | 0 , ψ i τ ik ) , h ik | η ik ∼ Bernoulli( h ik | η ik ) , H = [ R Q ] , η ik | ν k , α p , α m ∼ (1 − ν k ) δ ( η ik ) + ν k Beta( η ik | α p α m , α p (1 − α m )) , ν k | β m , β p ∼ Beta( ν k | β p β m , β p (1 − β m )) , τ − 1 ik | t s , t r ∼ Gamma( τ − 1 ik | t s , t r ) , z j 1 , . . . , z j N | υ ∼ ( Q n N ( z j n | 0 , υ j n ) , (SLIM) GP( z j 1 , . . . , z j N | k υ j ,n ( · )) , (CSLIM) y i 1 , . . . , y iN | υ ∼ ( x i 1 , . . . , x iN , (SLIM) GP( y i 1 , . . . , y iN | k υ i ,x ( · )) , (SNIM) x in w ik y in z j n υ j n h ik η ik ν k τ ik υ i ψ i i = 1 : d k = 1 : 2 d + m n = 1 : N j = 1 : d + m where we hav e omitted P an d the hyper p aramete rs in the graphical mo del. Laten t v ariable and driving signal parameters υ can hav e one of seve ral priors: Exp onentia l( υ | λ 2 ) (Laplace), Gamma( υ − 1 | θ / 2 , θ/ 2) (Student’ s t ) or Gamma( υ | u s , κ ) (GP), see equations ( 5 ), ( 6 ) and ( 9 ), resp ectiv ely . Th e laten t v ariables/driving signals z j n and the mixing/connectivit y matrices with elemen ts c ij or b ij are mod ele d indep endent ly . Eac h elemen t in B and C has its o w n slab v ariance τ ij and probabilit y of b eing n on-ze ro η ij . Moreo v er, there is a shared sparsit y rate p er column ν k . V ariables υ j n are v ariances if z j n use a scale mixture of Gaussian’s represent ation, or length scales in th e GP prior case. Since we assum e n o sp arsit y for the driving signals, η ik = 1 for d + i = k and η ik = 0 for d + i 6 = k . In add itio n, w e can reco ve r the pu re DA G by making m = 0 and the standard factor mo del by making instead η ik = 0 for k ≤ 2 d . All the details for the Gibbs sampling based inference are su mmarized in app endix A . 5.1 Prop osed w orkflo w W e prop ose the wo rkflow sho wn in Figure 1 to integ rate all elemen ts of SLIM, namely factor mo del and DA G infer en ce , sto c hastic order searc h and mo del selection u sing predictiv e densities. 1. P artition the data into { X , X ⋆ } . 2. P erform inference on the factor mo del and stochastic ord er searc h. One Gibbs sam- pling u p date consists of computin g the conditional p osteriors in equations ( 13 ), ( 14 ), ( 15 ), ( 16 ), ( 17 ), ( 18 ) and ( 19 ) in sequence, follo we d b y sev eral rep etitio ns (we use 10) of the M-H up date in equation 7 for th e p erm u ta tion matrices P and P f . 679 Henao and Winther 3. Summarize the factor mo del, mainly C , { η ij } and L FM using qu an tiles (0.025, 0.5 and 0.975) . 4. Summarize th e order in gs, P . Select the top m top candidates according to their f r e- quency du ring inf erence in step 2. 5. P erform inference on the DA Gs for eac h one of the orderin g candidates, P (1) , . . . , P ( m top ) using Gibb s sampling by computing equations ( 13 ), ( 14 ), ( 15 ), ( 16 ), ( 17 ), ( 18 ) and ( 19 ) in sequence, up to minor c hanges describ ed in App endix A . 6. Summarize the D A Gs, B , C L , { η ik } and L (1) DA G , . . . , L ( m top ) DA G using quant iles (0.025, 0.5 and 0.975). Note that { η ik } con tains n on-ze ro probabilities for R and Q corresp ondin g to B and C L , resp ectiv ely . W e use medians to summarize all qu an tities in our mo del b ecause D , B and { η ik } are bi- mo dal while the remaining v ariables are in general skew ed p osterior distributions. Inference with GP priors for time series data (CSLIM) or non-linear D A Gs (SNIM) is fairly similar to the i.i.d. case, see App endix A for d et ails. S ource co de for S L IM and all its v ariants prop osed so far has b een made a v ailable at http://c ogsys.imm.dtu. dk/slim/ as Matlab scripts. 5.2 Computa t ional cost The cost of r unning the linear D A G with laten t v ariables or the factor mo del is roughly the same, i.e. O ( N s d 2 N ) w h ere N s is th e total num b er of samples includ ing the bu rn-in p erio d . The memory r equ iremen ts on the other hand are approximat ely O ( N p d 2 ) if all the samples after the burn -in p eriod N p are stored. This means that the in ference pro cedures scale reasonably well if N s is k ept in the lo wer ten thousands. The non-linear version of the D AG is considerably more exp ensiv e due to the GP priors, hence the compu ta tional cost rises up to O ( N s ( d − 1) N 3 ). The computational cost of LiNGAM, b eing the closest to our linear mo dels, is mainly dep enden t on the statistic used to p rune/select the mo del. Using b o otstrapping results in O ( N 3 b ), wher e N b is the num b er of b o otstrap samples. Th e W ald statistic leads to O ( d 6 ), while W ald with χ 2 second order m odel fit test amounts to O ( d 7 ). As for the memory requirement s, b ootstrapping is v ery economic whereas W ald-based statistics requ ir e O ( d 6 ). 10 1 10 2 10 1 10 2 10 3 P S f r a g r e p l a c e m e n t s Time d Bootstrap W ald SLIM Figure 5: Ru n time comparison. The metho d for non-linear D AGs describ ed in Ho yer et al. ( 2009 ) is defined for a pair of v ariables, and it uses GP-based regression and ke rnelized indep endence tests. Th e computational cost is O ( N g N 3 ) wh ere N g is the num b er of gradien t iterations us ed to maximize the marginal lik eliho od of the GP . This is th e same order of complexit y as our non-linear D A G sampler. Figure 5 sh o ws a verag e runn ing times in a standard desktop mac hine (tw o cores, 2.6GHz and 4Gb RAM) o ver 10 differen t mo dels with N = 1000 and d = { 10 , 2 0 , 50 , 10 0 } . As exp ected, L iNG AM with b o otstrap 680 Sp arse Linear Identifiable Mul tiv aria te Modeling is very fast compared to the others while our mo del appr oac hes LiNGAM with W ald statis- tic as the n umber of observ ations increases. W e did not in clude LiNGAM with second order mo del fit b ecause for d = 50 it is already prohibitive . F or this small test we u sed a C imple- men tation of our mo del w ith N s = 19000 . W e are a ware th at th e p erforman ce of a C and a Matlab imp lemen tation can b e different , ho wev er we still d o the comparison b ecause the most exp ensive op erat ions in the Matla b co de for LiNGAM are computed thr ough BLAS routines n ot inv olving large lo ops, th us a C implement ation of LiNGAM shou ld not b e noticeably faster than its Matla b coun terp art. 6. Sim ulation results W e consid er six sets of exp erimen ts to illustrate the features of S LIM. In our comparison with other metho ds w e focu s on the D A G s tructure learning part b ecause it is somewhat easier to b enc hmark a DA G than a factor mo del. Ho wev er, we should stress th at D A G learning is just one comp onen t of S L IM. Both typ es of mo del and their comparison are imp ortan t, as will b e illustrated th rough the exp eriments. F or th e reanalysis of fl o w cytometry data using our mo dels, qu an titativ e mo del comparison fa v ors the D AG with laten t v ariables rather th an the standard factor mo del or the pur e DA G which wa s the p aradigm used in the stru cture learning approac h of Sac h s et al. ( 2005 ). The fir st tw o exp erimen ts consist of extensiv e tests usin g artificial data in a setup orig- inally from LiNGAM and n etw ork structures tak en from the Ba y esian net rep ository . W e test the features of SLIM and compare with L iNGAM and some other metho ds in settings where they hav e pro v ed to work wel l. T he third s et of exp eriments addr esses m odel com- parison, the fourth and fi fth present results for our DA G w ith laten t v ariables and the non-linear D AG (SNIM) on b oth artificial and r ea l data. The sixth uses r ea l data previ- ously p ublished by Sac h s et al. ( 2005 ) and the last one pro vides simp le results for a factor mo del u s ing Gaussian pro cess p riors for temp oral smo othness (CSLIM), tested on a time series gene expr essio n data s et ( Kao et al. , 2004 ). In all cases we ran 1000 0 s amp les after a burn -in p erio d of 5000 for the factor mod el, and a single c h ain with 3000 samples and 1000 as bu rn-in iterations for th e D AG, i.e. N s = 19000 used in the computational cost compar- ison. As a summary statistic we use median v alues ev er y w here, and Laplace d istributions for the laten t factors if n ot stated otherwise. 6.1 Artificial data W e ev aluate the p erformance of our mo del against LiNGAM 3 , u s ing the artificial mo del generator p resen ted and fully explained in Shimizu et al. ( 2006 ). Concisely , the generator pro duces b oth dens e and sp arse n et w orks with different degrees of sparsity , Z is generated from a hea vy-tailed n on-Ga ussian distrib u tio n through a generalized Gaussian distrib ution with zero mean, un it v ariance and random shap e, X is generated recursiv ely using equation ( 1 ) with m = 0 and then randomly p ermute d to hide the correct order, P . App ro ximately , half of th e n et w orks are fully connected while the remaining p ortion comprises spars ity lev els b et wee n 10% and 80%. Ha ving den se net works (0% sparsit y) in the b enc hmark is crucial b ecause in such cases the correct order of the v ariables is uniqu e, thus more d ifficult to find. 3. Matlab pack age (v .1. 42) av ailable at http://www .cs.helsinki .fi/group/neuroinf/lingam/ . 681 Henao and Winther 0 0.1 0.2 0.3 0.4 0.5 0.6 0.7 0.8 0.9 1 P S f r a g r e p l a c e m e n t s N LiNGAM DS DENSE SLIM C a n d i d a t e Correct ordering rate 200 500 1000 2 0 0 0 5 0 0 0 d = 5 d = 1 0 (a) 1 2 3 4 5 6 7 8 9 10 0 0.1 0.2 0.3 0.4 0.5 0.6 0.7 0.8 0.9 1 P S f r a g r e p l a c e m e n t s N L i N G A M D S D E N S E S L I M Candidate Correct ordering rate 200 500 1000 2 0 0 0 5 0 0 0 d = 5 d = 1 0 (b) 0 0.1 0.2 0.3 0.4 0.5 0.6 0.7 0.8 0.9 1 P S f r a g r e p l a c e m e n t s N LiNGAM DS DENSE SLIM C a n d i d a t e Correct ordering rate 2 0 0 500 1000 2000 5 0 0 0 d = 5 d = 1 0 (c) 1 2 3 4 5 6 7 8 9 10 0 0.1 0.2 0.3 0.4 0.5 0.6 0.7 0.8 0.9 1 P S f r a g r e p l a c e m e n t s N L i N G A M D S D E N S E S L I M Candidate Correct ordering rate 2 0 0 500 1000 2000 5 0 0 0 d = 5 d = 1 0 (d) Figure 6: Or dering accuracies for LiNGAM suite u s ing d = 5 in (a,b) and d = 10 in (c,d). (a,c) T otal correct ordering rates wh ere DENSE is our factor mod el without spar- sit y prior and DS corresp onds to DENSE but using the d ete rministic ordering searc h used in LiNGAM. (b ,c) Correct ordering r at e vs. candidates from SLIM. The crosses and horizon tal lines corresp ond to L iNG AM while the triangles are accum ulated correct ord erings across candidates used by S LIM. This setup is particularly c h al lenging b ecause the mo del needs to ident ify b oth d ense and sparse mod els. F or th e exp erimen t we h av e generated 1000 differen t dataset/mo dels using d = { 5 , 10 } , N = { 200 , 500 , 1000 , 2000 } and the D AG was selected us in g the median of the training likel iho o d, p ( X | P ( k ) r , R ( k ) , B ( k ) , C ( k ) D , Z , Ψ , · ), for k = 1 , . . . , m top . Order search. With this exp eriment we w an t to qu an tify the impact of using sp arsit y , sto c hastic ordering search and more than one ord ering candidate, i.e. m top = 10 in total. Figure 6 ev aluates the prop ortion of correct orderings for different settings. W e h a v e the follo wing abb reviati ons for th is exp erimen t, DENSE is our factor mo del without sparsit y prior, i.e. assumin g that p ( r ij = 1) = 1 a priori. DS (deterministic searc h) assumes no spar- sit y as in DENSE but replaces our sto c hastic searc h for p ermutations with the deterministic approac h u sed by LiNGAM, i.e. w e replace the M-H up date from equation ( 7 ) by the pro- cedure describ ed n ext: after inf er en ce w e compute D − 1 follo we d by a column p erm utation searc h u sing the Hungarian algorithm and a row p ermutat ion searc h b y iterativ e prun ing unt il getting a ve rsion of D as triangular as p ossible ( Shimizu et al. , 2006 ). Sev er al com- men ts can b e made f rom th e resu lts, (i) F or d = 5 there is no significant gain for in crea sing N , mainly b eca use the size of the p ermutat ion space is small, i.e. 5!. (ii) The difference in p erformance b et ween SLI M and DENSE is n ot significativ e b ecause we lo ok for triangular matrices in a probabilistic sense, hence th ere is no real need for exact zeros but just very small v alues, this d oes not mean that th e sp arsit y in the factor mo del is u nnecessary , on the con trary we still need it if we w ant to h a v e readily in terpretable mixing matrices. (iii) Using more than one ordering candidate considerably imp ro v es the total corr ect ord ering rate, e.g. by almost 30% for d = 5 , N = 200 an d 35% for d = 10 , N = 500. (iv) The n umber of accum ulated correct ord erings f ou n d saturates as the num b er of candidates us ed increases, suggesting that further increasing m top will n ot considerably c h ange the o verall re- sults. (v) The num b er of correct orderings tend s to accum ulate on the first candidate when 682 Sp arse Linear Identifiable Mul tiv aria te Modeling N in cr eases since the uncertain t y of the estimation of the parameters in th e factor mo del decreases acco rdingly . (vi) When the net work is not dense, it could happ en that more than one candidate h as a correct ordering, hence the tota l r at es (triangle s) are not just the sum of the bar heigh ts in Figures 6(b) and 6(d) . (vii) It seems that except f or d = 10 , N = 5000 it is enough to consid er just the fir st candidate in SLIM to obtain as many correct orderings as LiNGAM do es. (viii) F rom Figures 6(a) and 6(c) , the three v ariants of SLIM considered p erform b etter than LiNGAM, eve n when using the same single candidate ord ering searc h prop osed by Sh imizu et al. ( 2006 ). (ix) In some cases the difference b et w een SLIM and LiNGAM is v ery large, for example, for d = 10 using t w o candid at es and N = 1000 is enough to obtain as m any correct ord erings as LiNGAM with N = 5000. D AG learning. Now we ev aluate the abilit y of ou r mod el to capture the D A G structure in the data, pr o vided the p ermutatio n matrices obtained in th e pr evio us stage as a resu lt of our sto c hastic order search. Results are summarized in Figure 7 using receiving op erat ing c haracteristic (R OC) curv es. Th e true and false p ositiv e rates are av eraged o ver the num b er of trials (1000) for eac h setting to make the scaling in the p lot s more meaningful giv en the v arious lev els of sp arsit y consid ered. The rates are computed in the usual wa y , how ev er it must b e noted that the true num b er of absent links in a net work can b e as large as d ( d − 1), i.e. t wice the num b er of links in a D AG, b ecause in the case of an estimated DA G based in a wrong ordering the num b er of false p ositiv es can sum up to d ( d − 1) / 2 ev en if the true netw ork is not empt y . F or LiNGAM w e use f ou r different statistics to p r une the D AG after the ordering has b een foun d, namely b o otstrapping, W ald, Bonferroni and W ald with second order χ 2 mo del fit test. In ev ery case we run LiNGAM for 7 differen t p -v alue cutoffs, namely , 0.000 5, 0.001, 0.005, 0.01, 0.05, 0.1 and 0.5 to b uild the ROC cu rv e. F or SL I M we consider the t wo settings for β m discussed in Section 3.1 , i.e. a diffuse pr ior supp orting the existence of dense graphs, β m = 0 . 99 and β m = 0 . 1. In ord er to test how go o d SLIM is at selecting one DA G out of the m top candidates, w e also rep ort the oracle results under the name of ORA CLE , where in ev ery case we select the candidate with less error instead of argmax k p ( X | P ( k ) r , R ( k ) , B ( k ) , C ( k ) D , Z , Ψ , · ). Using β m = 0 . 99 is not v ery useful in practice b ecause in a real situation w e exp ect that the und erlying D A G is sparse, ho wev er th e LiNGAM suite has as many dense graphs as sp arse ones making β m = 0 . 1 a p o or c h oice. F rom Figure 7 , it is clear that for β m = 0 . 99, SLIM is clearly sup erior, providing the b est tru e p ositiv e rate (TPR) - false p ositi v e r at e (FPR) tradeoff. F or β m = 0 . 1 there is no real difference b et wee n SLIM and some settings of LiNGAM (W ald and Bonferroni). Concerning SLIM’s mo del selection pro cedure, it can b e s een that the difference b et ween SLIM and ORA CLE n ice ly decreases as the num b er of observ ations in crea ses. W e also tested the D AG learning p rocedur e in SLIM when the true ordering is kno wn (results not sho wn) and we found only a very small d ifferen ce compared to ORACLE. It is imp ortan t to mentio n that further increasing or redu cing β m do es n ot significantly c han ge the results sho wn; this is b ecause β m do es not fu lly control the s parsit y of the mo del, th us ev en for β m = 1 the m o del will b e still s parse due to element- wise link confid ence , α m . As f or LiNGAM, it seems that W ald p erforms b etter than W ald + χ 2 , ho w ev er j u st b y lo oking at Figure 7 , it is to b e exp ected that for larger N the latter p erform b etter b ecause the W ald statistic alone will tend to select more dense mo dels. 683 Henao and Winther 0 0.01 0.02 0.03 0.04 0.05 0.06 0.07 0.55 0.6 0.65 0.7 0.75 0.8 0.85 P S f r a g r e p l a c e m e n t s T rue p ositiv e r ate (sensitivity) F a l s e p o s i t i v e r a t e ( 1 - s p e c i fi c i t y ) B o o t s t r a p W a l d B o n f e r r o n i W a l d + χ 2 S L I M O R A C L E (a) d = 5 , N = 200 0 0.02 0.04 0.06 0.08 0.1 0.5 0.6 0.7 0.8 P S f r a g r e p l a c e m e n t s T r u e p o s i t i v e r a t e ( s e n s i t i v i t y ) F a l s e p o s i t i v e r a t e ( 1 - s p e c i fi c i t y ) B o o t s t r a p W a l d B o n f e r r o n i W a l d + χ 2 S L I M O R A C L E (b) d = 10 , N = 500 0 0.005 0.01 0.015 0.02 0.025 0.03 0.035 0.04 0.045 0.7 0.75 0.8 0.85 0.9 P S f r a g r e p l a c e m e n t s T rue p ositiv e r ate (sensitivity) F a l s e p o s i t i v e r a t e ( 1 - s p e c i fi c i t y ) B o o t s t r a p W a l d B o n f e r r o n i W a l d + χ 2 S L I M O R A C L E (c) d = 5 , N = 500 0 0.02 0.04 0.06 0.08 0.1 0.65 0.7 0.75 0.8 0.85 0.9 P S f r a g r e p l a c e m e n t s T r u e p o s i t i v e r a t e ( s e n s i t i v i t y ) F a l s e p o s i t i v e r a t e ( 1 - s p e c i fi c i t y ) B o o t s t r a p W a l d B o n f e r r o n i W a l d + χ 2 S L I M O R A C L E (d) d = 10 , N = 1000 0 0.005 0.01 0.015 0.02 0.025 0.03 0.035 0.8 0.85 0.9 0.95 P S f r a g r e p l a c e m e n t s T rue p ositiv e rate (sensitivity) F alse p ositiv e rate (1 - sp ecificit y) Bootstrap W ald Bonferroni W ald + χ 2 SLIM ORACLE (e) d = 5 , N = 1000 0 0.01 0.02 0.03 0.04 0.05 0.06 0.07 0.08 0.09 0.75 0.8 0.85 0.9 P S f r a g r e p l a c e m e n t s T r u e p o s i t i v e r a t e ( s e n s i t i v i t y ) F alse p ositiv e rate (1 - sp ecificit y) Bootstrap W ald Bonferroni W ald + χ 2 SLIM ORACLE (f ) d = 10 , N = 2000 Figure 7: Performance measures for LiNGAM suite. Results in clude the settings: d = { 5 , 10 } , N = { 200 , 500 , 1000 , 2 000 } , four mo del selectors for LiNGAM (b ootstrap, W ald, Bonferroni and W ald + χ 2 statistics) and sev en p -v alue cutoffs for the statistics used in LiNGAM (0.0005, 0.001, 0.005, 0.01, 0.05, 0.1, 0.5). ORA CLE corresp onds to oracle results f o r SLIM, b oth computed for t w o settings: diffuse β m = 0 . 99 and sparse β m = 0 . 1 p riors. Markers close to the top-left corner denote b etter results in a verag e. Illustrative example. Finally w e wa nt to sho w some of the most imp ortant elemen ts of SLIM taking one su cc essfully estimated example from the LiNGAM s u ite . Figure 8 sho ws results for a particular D AG w ith 10 v ariables obtained using 500 observ ations, see Figures 8(d) and 8(e) for the ground tru th and the estimated D AG, resp ectiv ely . T rue and estimated mixing matrices D for the equ iv alen t factor mo del are also sho wn in Figures 8(a) and 8(b) , resp ectiv ely . In total our algo rithm pr odu ce d 92 orderin gs out of 3 . 6 × 10 6 p ossible, from whic h all m top = 10 candidates w ere correct. Figure 8(c) sh ows the first 50 candidates and their frequen cy du ring sampling, the shaded area encloses the m top = 10 candidates. F rom 684 Sp arse Linear Identifiable Mul tiv aria te Modeling 1 2 3 4 5 6 7 8 9 10 1 2 3 4 5 6 7 8 9 10 P S f r a g r e p l a c e m e n t s x 1 x 2 x 3 x 4 x 5 x 6 x 7 x 8 x 9 x 1 0 F actors O r d e r i n g s F r e q u e n c y ( % ) V ariables b i j η i j C a n d i d a t e s p ( r i j = 1 | X , · ) M a g n i t u d e (a) 1 2 3 4 5 6 7 8 9 10 1 2 3 4 5 6 7 8 9 10 P S f r a g r e p l a c e m e n t s x 1 x 2 x 3 x 4 x 5 x 6 x 7 x 8 x 9 x 1 0 F actors O r d e r i n g s F r e q u e n c y ( % ) V ariables b i j η i j C a n d i d a t e s p ( r i j = 1 | X , · ) M a g n i t u d e (b) 0 5 10 15 20 25 30 35 40 45 50 0 1 2 3 4 5 6 7 P S f r a g r e p l a c e m e n t s x 1 x 2 x 3 x 4 x 5 x 6 x 7 x 8 x 9 x 1 0 F a c t o r s Orderings F requency (%) V a r i a b l e s b i j η i j Candidates p ( r i j = 1 | X , · ) M a g n i t u d e (c) -0.62 0.53 0.81 -0.79 0.49 -1.00 -0.96 -0.89 0.75 P S f r a g r e p l a c e m e n t s x 1 x 2 x 3 x 4 x 5 x 6 x 7 x 8 x 9 x 10 F a c t o r s O r d e r i n g s F r e q u e n c y ( % ) V a r i a b l e s b i j η i j C a n d i d a t e s p ( r i j = 1 | X , · ) M a g n i t u d e (d) -0.63 0.51 0.78 -0.83 0.42 -1.00 -0.96 -0.90 0.74 P S f r a g r e p l a c e m e n t s x 1 x 2 x 3 x 4 x 5 x 6 x 7 x 8 x 9 x 10 F a c t o r s O r d e r i n g s F r e q u e n c y ( % ) V a r i a b l e s b i j η i j C a n d i d a t e s p ( r i j = 1 | X , · ) M a g n i t u d e (e) 5 10 15 20 25 30 35 40 45 −1 −0.5 0 0.5 P S f r a g r e p l a c e m e n t s x 1 x 2 x 3 x 4 x 5 x 6 x 7 x 8 x 9 x 1 0 F a c t o r s O r d e r i n g s F r e q u e n c y ( % ) V a r i a b l e s b ij η i j C a n d i d a t e s p ( r i j = 1 | X , · ) Magnitude (f ) 5 10 15 20 25 30 35 40 45 0 0.2 0.4 0.6 0.8 1 P S f r a g r e p l a c e m e n t s x 1 x 2 x 3 x 4 x 5 x 6 x 7 x 8 x 9 x 1 0 F a c t o r s O r d e r i n g s F r e q u e n c y ( % ) V a r i a b l e s b i j η ij C a n d i d a t e s p ( r ij = 1 | X , · ) M a g n i t u d e (g) Figure 8: Groun d truth and estimated structures. (a) Ground truth mixing matrix. (b) Estimated mixing matrix using our sparse factor mo d el. Note the s ig n ambiguit y in s ome of the columns . (c) First 50 (out of 92) ordering candidates pro duced by our metho d du ring inference and their fr equency , the first m top candidates w ere used for to learn DA Gs. (d ) Ground truth DA G. (e) T op candid at e estimated using SLI M. (f ) Estimated median we igh ts for the D A G includ ing 95% credible in terv als and groun d truth (squares). (g) Summ ary of link p robabilities measured as η ij = p ( r ij = 1 | X , · ). 685 Henao and Winther 0.05 0.1 0.15 0.2 0.25 0.84 0.86 0.88 0.9 0.92 0.94 0.96 P S f r a g r e p l a c e m e n t s T rue p ositiv e rate F alse p ositiv e rate R e v e r s e d l i n k s r a t e F a l s e n e g a t i v e r a t e water (32) mildew (35) insurance (27) h a i l fi n d e r ( 5 6 ) c a r p o ( 6 1 ) b a r l e y ( 4 8 ) alarm (37) w a t e r m i l d e w i n s u r a n c e h a i l fi n d e r c a r p o b a r l e y a l a r m L i N G A M S L I M (a) 0.05 0.1 0.15 0.2 0.25 0.3 0.2 0.3 0.4 0.5 0.6 0.7 0.8 0.9 P S f r a g r e p l a c e m e n t s T rue p ositiv e rate F alse p ositiv e rate R e v e r s e d l i n k s r a t e F a l s e n e g a t i v e r a t e w a t e r ( 3 2 ) m i l d e w ( 3 5 ) i n s u r a n c e ( 2 7 ) hailfinder (56) carpo (61) barley (48) a l a r m ( 3 7 ) w a t e r m i l d e w i n s u r a n c e h a i l fi n d e r c a r p o b a r l e y a l a r m L i N G A M S L I M (b) 0.02 0.04 0.06 0.08 0.1 0.12 0.14 P S f r a g r e p l a c e m e n t s T r u e p o s i t i v e r a t e F a l s e p o s i t i v e r a t e Reve rsed links rate F a l s e n e g a t i v e r a t e w a t e r ( 3 2 ) m i l d e w ( 3 5 ) i n s u r a n c e ( 2 7 ) h a i l fi n d e r ( 5 6 ) c a r p o ( 6 1 ) b a r l e y ( 4 8 ) a l a r m ( 3 7 ) water mildew insurance hailfinder carpo barley alarm LiNGAM SLIM (c) Figure 9: Performance measures for the Ba ye sian net w orks rep ository exp erimen ts. Eac h connected mark er corresp ond to a different p -v alue in LiNGAM, starting left to righ t from 0.005. Disconnected m a rke rs denote SLIM resu lts. Num b ers in paren theses indicate n umber of v ariables. Figure 8(f ) we s ee that the elemen ts of B are correctly estimated and their cr ed ible in terv als are small, mainly du e to th e lac k of mo del mismatc h . Figure 8(g) sho ws a go o d s eparat ion b et wee n zero and non-zero element s of B as summarized by p ( r ij = 1 | X , · ). It is worth wh ile men tioning that usin g β m = 0 . 99 instead of β m = 0 . 1 in th is example, still p rodu ces the righ t DA G, although the separation b et w een zero and non-zero element s in Figure 8(g) will b e smaller and w ith higher uncertaint y , i.e. larger credible in terv als. 6.2 Bay esian net w orks rep ository Next we wan t to compare our metho d against LiNGAM on some realistic stru ctures. W e consider 7 w ell known b enc hmark structures from the Ba y esian net work r epository 4 , namely alarm, barley , carp o, hailfinder, in surance, mildew and water ( d = 37, 48, 61, 56, 27, 35, 32 resp ectiv ely). Since w e do n ot ha ve con tin uous data for an y of the structures, w e generated 10 datasets of size N = 500 for eac h of them using hea vy-tailed distrib utions with d ifferen t parameters and equation ( 1 ) with m = 0, in a similar w ay as w e did for the pr evio us set of exp erimen ts, with R set to the groun d truth and B from sign( N (0 , 1)) + N (0 , 0 . 2). F or LiNGAM, we only use W ald statistics b ecause as seen in the previous exp erimen t, it p erforms significan tly b etter that b o otstrapping. Again, w e estimate mo dels for d ifferen t p - v alue cutoffs (0.0005, 0.001, 0.005, 0.01, 0.05, 0.1 and 0.5). F or S LIM, w e set β m = 0 . 1 since all the n et w ork s in the rep ository are sp arse. Figures 9(a) , 9(b) and 9(c) show a v eraged p erformance measures resp ectiv ely as R OC cu r v es and the pr op ortion of lin k s reversed in the estimated mo d el d ue to ordering err ors. In this case, the results are mixed w h en lo oking at the p erforman ces obtained. Figure 9(b) sh o ws that S LIM is b etter than LiNGAM in the larger d at asets w ith a significant difference. Figure 9(a) sh o ws for the remaining four d at asets, that LiNGAM is b etter in 4. N et work structures av ailable at http://co mpbio.cs.huj i.ac.il/Repository/ . 686 Sp arse Linear Identifiable Mul tiv aria te Modeling t wo cases corresp onding to the insurance and mild ew netw orks. In general, b oth metho ds p erform r ea sonably w ell giv en the size of th e pr oblems and the amoun t of data used to fit the mo dels. Ho wev er, SLIM tends to b e more stable, when looking at the range of the tr ue p ositiv e rates. It is imp ortant to n ot e that the b est and w orst case for SLI M corresp ond to the largest and smallest netw ork, resp ectiv ely . W e do not h a v e a sensib le explanation ab out why SLIM is p erforming that p o orly on the insurance net work. Figure 9(c) imp lic itly rev eals that b oth metho ds are unable to find the right ordering of the v ariables. W e also tried the follo wing metho ds with encod ed Gaussian assump tions: standard D AG searc h, order searc h, sparse candidate p runing then D AG searc h ( F riedm an et al. , 1999 ), L1MB then DA G s ea rc h ( Schmidt et al. , 2007 ), and sparse candidate p runing th en order searc h ( T eyssier and Koller , 2005 ). W e observ ed (results not shown) th at th ese m et h- o ds pr odu ce similar results to those obtained b y either LiNGAM or SLIM when only lo oking at the resulting un directed graph, i.e. remo v in g the directionalit y of the links. Ev aluation of directionalit y in Gauss ia n mo dels is out of th e question b ecause suc h metho ds can on ly find D A Gs up to Mark o v equiv alence classes, thus ev aluation must b e made u sing partially directed acyclic graph s (PD AGs). It is still p ossible to mo dify some of the metho ds men- tioned ab o v e to h andle non-Gaussian data by for instance using some other appropriate conditional in depen dence tests, ho wev er this is out of the s cop e of this p aper. 6.3 Mo del comparison In this exp erimen t we w an t to ev aluate the mo del selection pro cedure describ ed in Section 4 . F or this p u rp ose we h av e generated 1000 d iffe rent datasets/models with d = 5 and N = { 500 , 1000 } follo wing the same pro cedure d esc rib ed in the fi rst exp eriment, but this time w e selected the true mo del to b e either a factor mo del or a D AG with equal probability . In order to generate a factor mo del, w e b asic ally just need to ensur e that D cannot b e p ermuted to a triangular form, so the data generated f rom it do es n ot admit a DA G representa tion. W e k ep t 20% of the data to compu te the p redictiv e d ensities to then select b et we en all estimated D AG candid at es and the f ac tor mo del. W e f ound that for N = 500 our approac h wa s able to select true D A Gs 96 . 78% of the times and true factor mo dels 87 . 05%, corresp onding to an ov erall accuracy of 91 . 9%. Increasing the n um b er of observ ations, i.e. for N = 1000, the true DA G, true factor mo del rates and ov erall error in crea sed to 98 . 99%, 95 . 0% and 96 . 99%, resp ectiv ely . Figure 10 shows separately the empirical log-lik eliho o d ratio distributions obtained from the 1000 datasets for D AGs and factor mo dels. Th e shaded areas corresp ond to the true D A G/factor mo del regions, with zero as th ei r b oundary . Note that w hen th e wrong mod el is selected the lik eliho o d ratio is nicely close to the b oundary and the o verlap of the tw o distributions decreases with th e n u m b er of observ ations used, since the qu ali t y of the predictiv e densit y increases accordingly . The true D A G rates tend to b e larger than for factor m odels b ecause it is more lik ely that the latter is confused with a D AG d ue to estimation errors or closeness to a D A G repr esen tation, than a D AG b eing confused w it h a facto r mo del whic h is naturally m ore general. This is precisely why the lik eliho o d r at ios tend to b e larger on th e factor mo del side of he p lots. All in all, these results demonstrate that our approac h is ve ry effectiv e at selecting the true underlying stru cture w hen the data is generated b y one of the t wo hyp otheses. 687 Henao and Winther −30 −20 −10 0 10 20 30 40 50 0.1 0.08 0.06 0.04 0.02 0 0.02 0.04 P S f r a g r e p l a c e m e n t s F requency Log-lik elihoo d ratio F actor models DA Gs (a) −30 −20 −10 0 10 20 30 40 50 0.1 0.08 0.06 0.04 0.02 0 0.02 0.04 P S f r a g r e p l a c e m e n t s F requency Log-lik elihoo d ratio F actor models DA Gs (b) Figure 10: Log-lik eliho o d ratio empirical distributions for, (a) N = 500 and (b) N = 1000 . T op bars corresp ond to true factor mo d els, b ottom bars to tru e D A Gs and the ratio is computed as describ ed in S ec tion 4 . T op bars lying b elo w zero are tru e factor mo dels predicted to b e b etter explained b y D A Gs, thus mo del comparison errors. 6.4 DA Gs with latent v ariables W e w ill start by illustrating th e identi fiabilit y issues of the mo del in equation ( 1 ) discussed in Section 2.1 with a very simple example. W e generated N = 500 observ ations from the graph in Figure 3(b) and kept 20% of th e data to compu te test lik eliho o ds. Now, w e p erform inference on t w o sligh tly differen t mo dels, namely , (u ) where z ′ = [ z ′ 1 z ′ 2 z ′ L ] is pro vided with Laplace distributions with u nit v ariance, i.e. λ = 2, and (i) where z 1 , z 2 ha ve Laplace distribu tio ns with un it v ariance and z L is Cauch y distr ib uted. W e wan t to sh o w that ev en if b oth mo dels matc h the true generating pro cess, (u) is non-identifiable whereas (i) can b e s u cce ssfully estimated. In ord er to ke ep the exp erimen t con trolled as muc h as p ossible, w e set β m = 0 . 99 to refl ect th at the grou n d truth is d ense and we did n ot infer C D and set it to the true v alues, i.e. th e identit y . Then, we ran 10 ind epend en t chai ns for eac h one of the mo dels and su mmarized B , C L , D and the test likelihoo ds in Figure 11 . Figure 11(a) shows that mo del (u) find s the D AG in Figure 3(b) (the ground tru th) in 3 cases, and in the remaining 7 cases it fin ds th e D AG in Figure 3(a) . Note also that the test lik eliho o ds in Figure 11(c) are almost ident ical, as must b e exp ected due to the lac k of ident ifiabilit y of the mo del, so they cannot b e used to select among the tw o alternativ es. Mo del (i) finds the r ig ht stru cture all the times as shown in Figure 11(d) . The mixing matrix of the equiv alen t factor mo del, D is shown in Figures 11(b) and 11(e) for (u) and (i), resp ectiv ely . In Figure 11(b) , the first and third column of D exc h ange p ositions b ecause all the comp onen ts of z h av e the same distrib ution, whic h is not the case of Figure 11(e) . The small quant ities in D are du e to estimation errors when computing b 21 c 1 L + c 2 L , and this cancels out in the true mo del. Th e sign c hanges in Figures 11(a) and 11(d) are caused b y the sign am biguit y of z L in the p rod uct C L z L . W e also tested the alternativ e mo del in Figure 3(b) obtaining equiv alen t results, i.e. 4 su cc esses for m o del (u) and 10 for mo del (i). T his small example shows h o w non-iden tifiabilit y ma y lead to t wo v ery differen t D AG solutions with distinct interpretatio ns of the d at a. 688 Sp arse Linear Identifiable Mul tiv aria te Modeling 1 2 3 4 5 6 7 8 9 10 P S f r a g r e p l a c e m e n t s Chain V ariable b 11 b 12 b 21 b 22 c 1 L c 2 L d 1 1 d 1 2 d 2 1 d 2 2 d 3 1 d 3 2 T e s t l i k e l i h o o d T (a) 1 2 3 4 5 6 7 8 9 10 P S f r a g r e p l a c e m e n t s Chain V ariable b 1 1 b 1 2 b 2 1 b 2 2 c 1 L c 2 L d 11 d 12 d 21 d 22 d 31 d 32 T e s t l i k e l i h o o d T (b) 2 4 6 8 10 −446 −445.8 −445.6 −445.4 −445.2 P S f r a g r e p l a c e m e n t s Chain V a r i a b l e b 1 1 b 1 2 b 2 1 b 2 2 c 1 L c 2 L d 1 1 d 1 2 d 2 1 d 2 2 d 3 1 d 3 2 T est likeli ho od T (c) 1 2 3 4 5 6 7 8 9 10 P S f r a g r e p l a c e m e n t s Chain V ariable b 11 b 12 b 21 b 22 c 1 L c 2 L d 1 1 d 1 2 d 2 1 d 2 2 d 3 1 d 3 2 T e s t l i k e l i h o o d T (d) 1 2 3 4 5 6 7 8 9 10 P S f r a g r e p l a c e m e n t s Chain V ariable b 1 1 b 1 2 b 2 1 b 2 2 c 1 L c 2 L d 11 d 12 d 21 d 22 d 31 d 32 T e s t l i k e l i h o o d T (e) 2 4 6 8 10 −416.5 −416 −415.5 −415 P S f r a g r e p l a c e m e n t s Chain V a r i a b l e b 1 1 b 1 2 b 2 1 b 2 2 c 1 L c 2 L d 1 1 d 1 2 d 2 1 d 2 2 d 3 1 d 3 2 T est likeli ho od T (f ) Figure 11: Identifiabilit y exp erimen t for the D A G with latent v ariables. Con n ect ivities B and C L are sho wn for (u) in (a) and (i) in (d). Equiv alent mixing matrix D for (u) in (b) and for (i) in (d). T est like liho o d s for (u) and (i) are sh o wn in (c) and (f ) resp ectiv ely . The firs t column in (a,b,d,e) denoted as T is the ground truth. Dark and ligh t b o xes are negativ e and p ositive n umbers , accordingly . Ho yer et al. ( 2008 ) recent ly presen ted an appr oa c h to D A Gs with laten t v ariables b ased on LiNGAM ( Shimizu et al. , 2006 ). Their pro cedure uses p r obabilistic ICA and bo ot- strapping to in fer the equiv alen t f ac tor mo del d istribution p ( D | X ), then greedily selects m columns of D to b e laten t v ariables un til the remaining ones can b e p erm uted to triangu- lar an d the resu lti ng D A G is compatible w ith the faithfulness assump tio n (see, P earl , 2000 ). If w e assum e th at their pro cedure is able to find the exact D for the graphs in Figures 3(a) and 3(b) , due to the f ai thfulness assumption, the D A G in Figure 3(a) will b e alw a y s selected regardless of the ground tr uth 5 . In practice, the solution obtained for D is d en se and needs to b e pruned , h ence we r el y on p ( X , D ) b eing larger for the ground truth in Figure 3(b) than for the graph in Figure 3(a) , how ev er sin ce b oth mo dels differ only b y a p erm u tat ion of the column s of D , they ha ve exactly the same j oi nt densit y p ( X , D ) — they are non-iden tifi ab le, thus the algorithm will select one of the options by c hance. Since the source of non-iden tifi ab ility of their algorithm is p ermutat ions of column s of D , it do es not matter if probabilistic ICA matc h or n ot the distrib ution of the under lyin g pro cess as in our mo del. Anyw a y , we decided to try mo dels (u) and (i) describ ed ab ov e using the algorithm just describ ed 6 . Regardless of the ground truth, Figures 3(a) or 3(b) , the algorithm alw ays selected th e DA G in Figure 3(b) , whic h in this particular case is du e to p ( X , D ) b eing sligh tly larger for the denser mo d el. 5. S ee R obins et al. ( 2003 ) for a very interesting explanation of faithfulness using th e same ex ample p re- sented here. 6. Matlab pack age (v .1. 1) freely a v ailable at http://w ww.cs.helsink i.fi/group/neuroinf/lingam/ . 689 Henao and Winther No w we test th e mo del in a more general setting. W e generate 100 mo dels and datasets of size N = 500 using a similar pro cedure to the one in the artificial data exp erimen t. Th e mo dels hav e d = 5 and m = 1, no dense structures are generated and the distr ibutions for z are hea vy-tailed, drawn from a generalized Gaussian distrib ution with rand om shap e. F or SLIM, w e use the follo w ing s et tings, β m = 0 . 1, z D is Laplace with unit v ariances and z L is C auc h y . F urthermore, w e ha v e doubled th e num b er of iterations of th e D AG samp le r, i.e. 6000 samples and a bur n-in p erio d of 2000, so as to comp ensate for the additional parameters that need to b e in ferred d u e to inclusion of laten t v ariables. Our ordering searc h pro cedure w as able to find the right ord ering 78 out of 100 times. Th e tru e p ositiv e rates, true negativ e rates and median A UC are 88.28%, 96.4 0% and 0.929, resp ectiv ely , corresp onding to appro ximately 1.5 structure errors p er n et w ork. Using Ho yer et al. ( 2008 ) w e obtained 1 true orderin g out of 100, 91.63% tru e p ositiv e rate, 65.18% true negativ e rate and 0.800 median AUC, showing again the preference of the algorithm for denser mo dels. W e regard these results as ve ry satisfactory for b oth metho ds considering the difficult y of the task and the lac k of identi fiabilit y of the m odel b y Ho yer et al. ( 2008 ). 6.5 Non-linear DA Gs F or Sparse Non-linear Identifiable Mo deling (SNIM) describ ed in Section 3.5 , first we w ant to sho w that our metho d can fi nd and select from DA Gs w ith non-linear inte ractions. W e used the artificial net work fr om Ho y er et al. ( 2009 ) sh o wn here in Figur e 12(a) and generated 10 different datasets corresp onding to N = 100 observ ations, eac h time us ing driving signals sampled from different hea vy-tailed d istributions. Since w e do not yet ha v e an ordering searc h p r ocedure for non-linear D AGs, we p erform DA G inference for all p ossible orderings and datasets. The resu lts obtained are ev aluated in t wo w a ys, first we c hec k if w e can find the tru e connectivit y matrix when the ord er in g is correct. Second, we need to v alidate th at the lik eliho o d is able to select the mo del with less err or and correct ord ering among all p ossible candidates so w e can use it in p racti ce. Figures 12(b) , 12(c) and 12(d) show the median errors, tr ai ning and test likeli ho o ds (using 20% of the data) for eac h one of the orderings, resp ectiv ely . In this particular case we only ha v e tw o correct orderings, namely , (1 , 2 , 3 , 4) and (1 , 3 , 2 , 4), corresp onding to the fir st and second candidates in the plots. Figure 12(b) sho ws that the error is zero only for the tw o correct orderings, then our mo del is able to in f er the structure once the r ig ht ordering is giv en as d esired. As a result of the iden tifiabilit y , data and test lik eliho o d s sho w n in Figures 12(c) and 12(d) correlate n ice ly with the stru ctural error in Figur e 12(b) . This means that we can use use the like liho od s as a p ro xy for the structural error jus t as in the linear case. W e also tested the net work in Figure 12(a) us ing three non-linear structure learning pro cedures n amely greedy standard hill-clim b in g D AG searc h , the “ideal parent” algorithm ( Elidan et al. , 2007 ) and k er n el PC ( Tillman et al. , 2009 ). The fi r st t wo metho ds u s e a scaled sigmoid function to capture the non-linearities in the data. In particular, they assu me that a v ariable x can b e explained as scaled s ig moid transformation of a linear com bination of its paren ts. The b est m edian resu lt we could obtain after tuning the p aramet ers of the algorithms w as 2 errors and 2 r ev ersed links 7 . Both metho ds p erform similarly in this 7. Maximum number of iterations, random restarts to a void local minima, regularization of the non-linear regression and the num b er of rank ing candidates in ideal parent algorithm. 690 Sp arse Linear Identifiable Mul tiv aria te Modeling x 1 x 2 x 2 1 x 3 4 p | x 1 | x 4 2 sin ( x 2 ) 2 sin ( x 3 ) (a) 3 6 9 12 15 18 21 24 0 2 4 6 8 P S f r a g r e p l a c e m e n t s Orderings Error L i k e l i h o o d T e s t l i k e l i h o o d (b) 3 6 9 12 15 18 21 24 640 645 650 655 P S f r a g r e p l a c e m e n t s Orderings E r r o r Likeli ho od T e s t l i k e l i h o o d (c) 3 6 9 12 15 18 21 24 −390 −380 −370 −360 −350 P S f r a g r e p l a c e m e n t s Orderings E r r o r L i k e l i h o o d T est likeli ho od (d) Figure 12: Non-linear DA G artificial example. (a) Net w ork with non-linear interactio ns b et wee n observed n odes used as ground tru th. (b,c,d) Median error, like liho od and test likel iho o d for all p ossible orderings and 10 indep endent r epetitions. The plots are sorted according to num b er of errors and on ly the fir st t wo are v alid according to the groun d truth in (a), i.e. (1 , 2 , 3 , 4) and (1 , 3 , 2 , 4). Note that when the error is zero in (b) the lik eliho od s are larger with resp ect to the remaining ord erings in (c) and (d). particular example, the only significan t difference b eing their computational cost, wh ic h is consider ab ly sm al ler for the “ideal parent” algorithm, as it was also p oin ted out by Elidan et al. ( 2007 ). The reason wh y we consid er these algorithms d o not p erform w ell here is that the sigmoid f unction can b e very limited at capturin g certain non-linearities due to its p arametric form whereas the nonparametric GP giv es flexible n on-linea r fu nctions. The third metho d uses non-linear in d epen d ence tests together with non-linear regression (relev ance vecto r machines) and the PC algorithm to pr odu ce mixed D A Gs. The b est median resu lt w e could get in th is case wa s 2 errors, 0 reversed links and 1 bidirectional links. T hese thr ee non-linear D A G search algorithms h a v e the great adv an tage of not requiring exhaustiv e enumeratio n of the ord erings as our metho d and others a v ailable in the literature. Zhang and Hyv¨ arin en ( 200 9 ) pro vid es theoretical evidence of the p ossibilit y for flexible non-linear mo deling without exh au s tiv e ord er searc h but n ot a w a y to d o it in practice. Y et another p ossibilit y n ot tried here will b e to take the b est parts of b oth strategies by taking the outcome of the non-linear DA G searc h algorithm and refin e it using a n onparametric metho d lik e SNIM. Ho wev er, it is n ot en tirely clear h ow the non-linearities can affect the orderin g of the v ariables. In the remaining part of this section w e only fo cus on tasks for pairs of v ariables where the ordering searc h is not an issue. The dataset kn o wn as Old F aithfu l ( Asuncion and Newman , 2007 ) conta ins 272 observ a- tions of t wo v ariables measuring w aiting time b etw een erup tions and d uration of eruptions for the O ld F aithful geyser in Y ello wstone National P ark, USA. W e wa nt to test the t wo p ossible orderings, duration → int erv al and in terv al → d u ratio n. Figures 13(a) and 13(b) sho w training and test lik eliho od b oxplot s for 10 indep endent randomizations of th e dataset with 20% of the observ ations used to compute test lik eliho o ds. Our mo del w as able to fin d the right ordering, i.e. dur at ion → interv al in all cases wh en the test like liho od w as used bu t only 7 times with the training likeli ho o d d ue to the pr o ximit y of the densities, see Figure 13(c) . On the other hand, the p redictiv e d ensit y is v ery discriminativ e, as sh own for ins ta nce 691 Henao and Winther 420 425 430 435 P S f r a g r e p l a c e m e n t s Hypothesis T e s t l i k e l i h o o d Duration → Interval Interval → Duration D u r a t i o n → I n t e r v a l I n t e r v a l → D u r a t i o n D e n s i t y Likeli ho od (a) −5000 −4000 −3000 −2000 −1000 P S f r a g r e p l a c e m e n t s Hypothesis T est likeli ho od Duration → Interval Interv al → Duration D u r a t i o n → I n t e r v a l I n t e r v a l → D u r a t i o n D e n s i t y L i k e l i h o o d (b) 200 300 400 500 600 0 0.002 0.004 0.006 0.008 0.01 P S f r a g r e p l a c e m e n t s H y p o t h e s i s T e s t l i k e l i h o o d D u r a t i o n → I n t e r v a l I n t e r v a l → D u r a t i o n Duration → In terva l Interv al → Duration Density Likeli ho od (c) −10000 −8000 −6000 −4000 −2000 0 1 2 3 4 x 10 −3 P S f r a g r e p l a c e m e n t s H y p o t h e s i s T est likeli ho od D u r a t i o n → I n t e r v a l I n t e r v a l → D u r a t i o n Duration → In terval Interv al → Duration Density L i k e l i h o o d (d) Figure 13: T esting { du ratio n, in terv al } in Old F aithful dataset. (a,b) Data and test likeli - ho od b o xplots for 10 ind epend en t rep etitions. (c,d) T raining and test lik eliho od densities f or one of the r epetitions. Th e test like liho od separates consisten tly the tw o tested hyp otheses. in Figure 13(d) . Th is is n o t a very surpr ising result since making the duration a function of the interv al results in a v ery n on-li near function, wh ereas the alternativ e fu nctio n is almost linear (data not shown). Abalone is on e of the d at asets from the UCI ML rep ository ( Azzalini and Bo wman , 1990 ). It is targeted to pr edict the age of abalones f rom a s et of physica l measuremen ts. The dataset con tains 9 v ariables and 4177 obs er v ations. First we wan t to test the pair { age, length } . F or this p u rp ose, w e use 10 subsets of N = 200 observ ations to build the mo dels and compute like liho od s just as b efore. Figures 14(a) and 14(b) sh o w training and test lik eliho o ds resp ectiv ely as b o xp lot s. Both training and test lik eliho od s p ointed to the right ordering in all 10 r epetitions. In this exp erimen t, the separation of the d ensities for the t wo h yp otheses considered is v ery large, making age → length significan tly b ette r supp orted b y the data. Figures 14(c) and 14(d) show predictiv e densities for one of the trials indicating again that age → length is consisten tly preferred. W e also d ec ided to try another three sets of hyp otheses: { age, diameter } , { age, w eight } an d { age, length, w eight } f or wh ic h we found the right orderings { 10 , 1 0 } , { 10 , 10 } and { 10 , 6 } out of 10 by lo oking at the training and the test lik eliho o ds, r esp ectiv ely . In the mod el with three v ariables, in cr easing the num b er of observ ations used to fit the mo del from N = 200 to N = 400, increased the num b er of cases in whic h the test likelihoo d selected the true h yp othesis from 6 to 8 times, whic h is more than enough to make a decision ab out the leading h yp othesis. T o conclude th is s et of exp erimen ts we test SNIM against another three recen tly pro- p osed methods 8 , namely Non-linear Additive Noise (NAN) mod el ( H o yer et al. , 2009 ), P ost-Non-Linear (PNL) mo del ( Zhang and Hyv¨ arinen , 2009 ) and Inform at ional Geometric Causal Inference (IGCI) ( Daniusis et al. , 2010 ), using an extend ed version of “cause-effect pairs” task for the NIPS 2008 causalit y comp etition 9 ( Mooij and Janzing , 2010 ). The task consists on distinguishin g the cause fr om the effect of 51 d iffe rent pairs of observed v ari- ables. NAN and PNL rely on an ind epen d ence test (HSI C, Hilb ert-Sc hmidt Indep endence Criterion, Gretton et al. , 2008 ) to decide which of the t wo v ariable is the cause. NAN w as able to tak e 10 decisions all b eing accurate. PNL w as accurate 40 times out of 42 decisions 8. Matlab pack ages av ailable at http://webdav.tueb ingen.mpg.de/causality/ . 9. D ata av ailable at http://web dav.tuebinge n.mpg.de/cause- effect/ . 692 Sp arse Linear Identifiable Mul tiv aria te Modeling 200 250 300 350 400 450 P S f r a g r e p l a c e m e n t s Hypothesis T e s t l i k e l i h o o d Length → Age Age → Length L e n g t h → A g e A g e → L e n g t h D e n s i t y Likeli ho od (a) −280 −260 −240 −220 −200 P S f r a g r e p l a c e m e n t s Hypothesis T est likeli ho od Length → Age Age → Length L e n g t h → A g e A g e → L e n g t h D e n s i t y L i k e l i h o o d (b) 100 200 300 400 500 0 0.005 0.01 0.015 P S f r a g r e p l a c e m e n t s H y p o t h e s i s T e s t l i k e l i h o o d L e n g t h → A g e A g e → L e n g t h Length → Age Age → Length Density Likeli ho od (c) −350 −300 −250 −200 −150 0.01 0.02 0.03 0.04 P S f r a g r e p l a c e m e n t s H y p o t h e s i s T est likeli ho od L e n g t h → A g e A g e → L e n g t h Length → Age Age → Length Density L i k e l i h o o d (d) Figure 14: T esting { length, age } in Abalone dataset. (a,b) Data and test lik eliho od b ox- plots for 10 ind ep end ent rep etitio ns. (c,d) T rainin g and test lik eliho o d d ensitie s for one of the rep etitions. T he lik eliho o d s largely separate th e t w o tested h y- p otheses. made. IGCI and S NIM obtained an accuracy of 40 and 39 pairs, resp ectiv ely 10 . Th e results indicate (i) th at NAN and PNL are v ery accurate when the in d epen d ence test used is able to reac h a decision and (ii) in terms of accuracy , th e r esu lts obtained by PNL, IGCI and SNIM are comparable. F or SNIM we decide based up on the test lik eliho o d and for IGCI w e used a uniform reference measure (rescaling the data b et ween 0 and 1). F rom the four tested metho ds we can identify t wo main trends. One is to explicitly m odel the data and decide the cause-effect dir ec tion u sing ind epend ence tests or test lik eliho od s lik e in NAN, PNL and S NIM. The second is to directly define a measure f or directionalit y as in IGCI. The first option has the adv an tage of b eing able to con v ey more information ab out the data at hand whereas th e second option is orders of magnitude faster than the other th ree b ecause it only tests for d irect ionalit y . 6.6 Protein-signaling netw ork This exp eriment demonstrates a t yp ic al application of SLIM in a realistic biological large N , small d setting. T h e dataset in tro duced b y Sac h s et al. ( 2005 ) consists of flo w cytometry measuremen ts of 11 phosp horylate d proteins and phosp h olipids (raf, er k , p38, jnk, akt, mek, pk a, pkc, pip 2 , pip 3 , plc). Eac h observ ation is a v ector of quan titativ e amoun ts measur ed from single cells. Data was generated from a series of stimulatory cues and inh ib ito ry inter- v entions. Hence the d ata is comp osed of three kinds of p erturbations: general activ ators, sp ecific activ ators and sp ecific inhibitors. Here we are only us in g the 1755 observ ations — clearly non-Gaussian, e.g. see Figure 16(a) , corresp onding to general stim ulatory cond it ions. It is clear that u sing the wh ole dataset, i.e. u sing sp ecific p erturbations, will p rod uce a ric her mo del, ho wev er hand ling interv enti onal data is out of the scop e of this pap er mainly b ecause handling that kind of data with a factor mo del is not an easy task. T h us our curren t order searc h pro cedure is not ap p ropriate. F o cused only on th e obser v ational data, w e w an t to test all the p ossibilities of our mo del in this dataset, n amely , standard f ac tor mo dels, pure D AGs, DA Gs with laten t v ariables, non-linear D AGs and qu an titativ e mo del comparison using test lik eliho o ds. T he textb ook D AG structur e tak en from Sac h s et al. (see Figure 2 10. Results for NAN, PNL a nd IGCI were taken from Daniusis et al. ( 2010 ) b ecause we were unable to entirel y reprodu ce their results with th e soft ware provided by th e authors. 693 Henao and Winther pkc m 3 m 4 pk a p38 jnk raf mek erk plc pip 2 pip 3 pik3 akt ras (a) pkc pk a p38 jnk raf mek erk plc pip 2 pip 3 akt (b) log hL DA G i = − 4 . 30 e 3 pkc pk a p38 jnk raf mek erk plc pip 2 pip 3 akt (c) log h L DA G i = − 4 . 10 e 3 pkc pk a p38 jnk raf mek erk plc pip 3 pip 2 akt l 1 l 2 (d) log hL DA G i = − 3 . 4 e 3 pkc pk a p38 jnk raf mek erk plc pip 3 pip 2 akt l 1 l 2 (e) log h L DA G i = − 3 . 70 e 3 Figure 15: Result for pr ot ein-signaling net work data. (a) T extb o ok s ignaling netw ork as rep orted in Sac h s et al. ( 2005 ). E stimat ed stru ctur e using SLIM: (b) u sing the true orderin g, (c) obtaining the ord ering from the sto c h ast ic s earch, (d) top D AG with 2 laten t v ariables and (e) the run ner-up (in test likeli ho o d). F alse p ositiv es are sho wn in red dash ed lines an d rev ersed links in green d ot ted lines. Belo w eac h stru cture we also rep ort the median test lik eliho o d (larger is b etter). and T able 3, 2005 ) is sh own in Figure 15(a) and the mo dels are estimated us in g the tru e ordering and SLIM in Figures 15(b) and 15(c) , resp ectiv ely . The D A G found using the righ t ordering of th e v ariables shown in Figure 15(b) turn ed out to b e th e same structure f ound by the discrete Ba y esian net w ork from Sac h s et al. ( 2005 ) without us ing in terv en tional data (see sup plemen tary material, Figure 4(a)), with one imp ortant difference: the metho d presen ted by Sac h s et al. ( 2005 ) is n ot able to infer the directionalit y of the links in the graph without in terv en tional d at a, i.e. their resulting graph is u ndirected. SLIM in Figure 15(c) fin ds a net w ork almost equal to the one in Figure 15(b) apart from one rev ersed link, plc → pip3. Surpr isingly this w as also f ound rev ersed 694 Sp arse Linear Identifiable Mul tiv aria te Modeling 10 0 10 2 10 4 P S f r a g r e p l a c e m e n t s raf erk p38 jnk akt mek pk a pkc pip 2 pip 3 plc F r e q u e n c y ( % ) C a n d i d a t e s T e s t l o g - l i k e l i h o o d D e n s i t y T e s t l o g - l i k e l i h o o d E r r o r s Magnitude l o g h L F M i = − 3 . 4 6 e 3 F M D A G C a n d i d a t e s x y p i p 3 p k c (a) 1 2 3 4 5 6 7 8 9 10 11 P S f r a g r e p l a c e m e n t s raf erk p38 jnk akt mek pk a pkc pip 2 pip 3 plc F r e q u e n c y ( % ) C a n d i d a t e s T e s t l o g - l i k e l i h o o d D e n s i t y T e s t l o g - l i k e l i h o o d E r r o r s M a g n i t u d e log hL FM i = − 3 . 46 e 3 F M D A G C a n d i d a t e s x y p i p 3 p k c (b) −4400 −4200 −4000 −3800 −3600 −3400 −3200 0 1 2 3 4 5 6 7 x 10 −3 P S f r a g r e p l a c e m e n t s r a f e r k p 3 8 j n k a k t m e k p k a p k c p i p 2 p i p 3 p l c F r e q u e n c y ( % ) C a n d i d a t e s T est log-lik elihoo d Density T e s t l o g - l i k e l i h o o d E r r o r s M a g n i t u d e l o g h L F M i = − 3 . 4 6 e 3 FM DA G C a n d i d a t e s x y p i p 3 p k c (c) 1 2 3 4 5 6 7 8 9 10 −4100 −4090 −4080 −4070 −4060 −4050 −4040 1 2 3 4 5 6 7 8 9 10 16 15 14 13.5 13 P S f r a g r e p l a c e m e n t s r a f e r k p 3 8 j n k a k t m e k p k a p k c p i p 2 p i p 3 p l c F r e q u e n c y ( % ) Candidates T e s t l o g - l i k e l i h o o d D e n s i t y T est log-lik elihoo d Errors M a g n i t u d e l o g h L F M i = − 3 . 4 6 e 3 F M D A G C a n d i d a t e s x y p i p 3 p k c (d) −1 0 1 2 3 4 −3 −2 −1 0 1 2 P S f r a g r e p l a c e m e n t s r a f e r k p 3 8 j n k a k t m e k p k a p k c p i p 2 p i p 3 p l c F r e q u e n c y ( % ) C a n d i d a t e s T e s t l o g - l i k e l i h o o d D e n s i t y T e s t l o g - l i k e l i h o o d E r r o r s M a g n i t u d e l o g h L F M i = − 3 . 4 6 e 3 F M D A G C a n d i d a t e s x y pip3 pkc (e) Figure 16: Results for protein-signaling n et work data. (a) Bo xp lot for eac h one of the 11 v ariables in the dataset. (b) Estimated factor mo del. (c) T est lik eliho ods for the b est D A G (dashed) and the factor mo del (solid). (d) T est lik eliho o ds (squares) and structure err ors (circles) includ ed rev ersed links for all candidates. (e) Non- linear v ariables y obtained as a f unction of the observed v ariables x for p ip3 and pk c. E ach dot in the plot is an observ ation and the solid lines are 95% credible in terv als. b y Sac h s et al. ( 2005 ) using interv en tional data. In addition, there is just one false p ositiv e, the pair { jnk, p38 } , even with a d edica ted laten t v ariable in the f ac tor mo del mixing matrix sho wn in Figure 16(b) , th u s w e cannot attribu te suc h a f al se p ositiv e to estimation err ors . A total of 211 ord ering candidates w ere pro duced during the inference out of app r o ximately 10 7 p ossible and only m top = 10 of them we re us ed in the stru cture searc h step. Note fr om Figure 16(d) that the predictiv e densities for the D A Gs correlate w ell with the structural accuracy , apart f r om candidate 8. Candid at es 3 and 8 h a v e the same n umber of structural errors, ho w ev er candidate 8 has 3 rev ersed links instead of 1 as shown in Figure 15(c) . T he predictiv e densities for the b est candid at e, third in Figure 16(d) are sho wn in Figure 16( c) and suggest that the factor m odel fits the data b etter. This mak es sen s e considerin g that estimated DA G in Figure 15(c) is a subs tructure of the ground truth. W e also examined the estimated factor mo del in Figure 16(b) and w e found that seve ral f ac tors could corresp ond resp ectiv ely to three unmeasured p rote ins, n amely pi3k in factors 9 and 11, m 3 (mapkkk, mek4/7) and m 4 (mapkkk, m ek3 /6) in factor 7, ras in factors 4 and 6. W e also w anted to assess the p erformance of our method and sev eral others using this dataset, including LiNGAM and those mentio ned in the Ba y esian net work r epository ex- p erimen t, ev en k n o wing that this dataset con tains non-Gaussian d ata . W e found that all of them ha v e similar results in terms of true and false p ositiv e rates when comparing them to SLIM. Ho w ev er the n umber of rev ersed links was not in any case less than 6, which cor- resp onds to more th an 50% of the true p ositiv es found in ev ery case. This m ea ns that th ey are essentia lly able to find the ske leton in Figure 15(b) . Besides, w e do n ot ha ve knowledge of any other metho d for D A G learning u sing only the obs er v ational data that also pr o vides results sub stan tially b ett er than the on es sho wn in Figure 15(c) . The p oor p erformance of 695 Henao and Winther LiNGAM is d iffi cu lt to explain bu t the large amount of reve rsed links ma y b e du e to the F astICA based deterministic ordering search pro cedure. W e also tried D A G mo dels with laten t v ariables in this d ata set. The results obtained b y the D A G with 2 a priori assumed laten t v ariables are shown in Figures 15(d) and 15(e) , corresp onding to the first and second D A G candidates in terms of test likel iho o ds. T h e first option is different to the pure D A G in Figure 15(c) only in th e reversed link, p38 → pk c, b ut captures some of the b eha vior of pik3 and r a s in l 1 and l 2 resp ectiv ely . It is v ery int eresting to see ho w, due to the link b etw een p ik3 and ras that is not p ossible to mo del with our mo del, the second inf er r ed latent v ariable is detecting signals p oin ting tow ards pip 2 and plc. W e also considered a second option b ecause l 1 in the top mo del is only connected to a single v ariable pip 3 and thus could b e regarded as an estimation error since it can b e easily confounded with a driving signal. C omparing Figures 15(c) an d 15(e) r ev eals t w o differences in th e observ ed p art, a f al se n eg ativ e p ip 3 → p lc and a n ew true (reversed) p ositiv e mek → pk a. This candidate is particularly in teresting b eca use the first latent v ariable captures the connectivit y of pik3 while conn ec ting itself to plc due to the lac k of connectivit y b et we en pip 3 and plc. Moreo ve r, the second laten t v ariable r esem bles ras and the link b et we en p ik3 and ras as a lin k f r om itself to pip 3 . In b oth solutions there is a connection b et ween l 2 and mek that migh t b e exp la ined as a link thr o ugh a phosp h orylat ion of raf different to the observ ed one, i.e. ras s 259 . In terms of median test lik eliho o ds, the mo del in Figure 15(d) is only marginally b etter than the factor mo del in Figure 16(b) and in turn marginally worse than the D AG in Figure 15(e) . F or SNIM w e started from the true ord ering of the v ariables but we could n ot find any impro v emen t compared to the structure in Figure 15(c) . I n particular there are only t w o differences, plc → pip 2 and jnk → p 38 are missing, meaning that at least in this case there are no false p ositiv es in th e n on-linea r DA G. L ooking at th e p arame ters of the co v ariance function u sed, υ (not sho wn) w ith acceptance rates of approximat ely ≈ 20% and reasonable credible interv als, we can sa y that our mo del found almost linear functions sin ce all the parameters of the co v ariance functions are rather small. Figur e 16(e) s h o ws tw o p artic ular non-linear v ariables learned by the m odel, corresp onding to pip 3 and plc. In eac h case the uncertain t y of the estimation nicely increases with th e magnitude of the observ ed v ariable and although the functions are fairly linear they resem b le the satur ation effect we can exp ect in this kind of biological data. F rom the th ree non-linear metho ds non-requirin g exhaustiv e order searc h d esc rib ed in the p revious section (D A G searc h, “ideal paren t” and kPC), the b est result we obtained wa s 11 stru ctural errors, 10 tr u e p ositiv es, 34 true n eg ativ es, 2 rev er s ed and 6 bidirectional links for kPC vs 12, 9, 34, 1 and 0 b y S LIM and 12, 8, 35, 0 and 0 b y SNIM. 6.7 Time series data W e illustrate the use Correlated Sparse Lin ear Id en tifiable Mo deling (CLS IM) on the d at aset in tro duced b y Kao et al. ( 2004 ) consisting of temp oral gene expr essio n p rofiles of E. c oli dur- ing transition from glucose to acetate m ea sured using DNA microarrays. Samples from 100 genes w ere tak en at 5, 10, 15, 30, 60 minutes and every h our unti l 6 hour s after transition 11 . The general goal is to reconstruct the unkno wn transcription factor activitie s from the ex- 11. Data av ailable at http://www.seas. ucla.edu/ ~ liaoj/NCA_ module_Data . 696 Sp arse Linear Identifiable Mul tiv aria te Modeling pression data and s ome pr ior kno wledge. In Kao et al. ( 2004 ) the prior kno wledge consisted of taking the set of tr an s criptio n factors (ArcA, CRP , CysB, F adR, F ruR, GatR, IcIR, L euO, Lrp, NarL, PhoB, PurB, Rp oE, Rp oS, T rp R an d TyrR) con trolling the obser ved genes and the (u p -to -date) connectivit y b etw een genes and transcription factors from RegulonDB 12 ( Gama-Castro et al. , 2008 ). F rom this setting, we can immediately relate the trans criptions factors with Z , suc h a connectivit y with Q L , and th eir relativ e strengths with C L , h ence the problem can b e seen as a standard factor m odel. In Kao et al. ( 2004 ) th ey applied a metho d called Net wo rk Comp onen t Analysis (NCA), that uses a least-squares b ased algorithm to solv e a problem similar to th e one in equation ( 1 ), bu t assuming that the sparsity pattern (masking matrix Q L ) of C L is fixed and kn o wn. It is w ell-kno wn that the information in RegulonDB is still incomplete and h ard to obtain for organisms d ifferen t than E. c oli . Our goal h ere is thus to obtain similar transcrip tio n factor activities to those found by Kao et al. ( 2004 ) without using the inf ormati on from RegulonDB, bu t taking in to accoun t that the data at h and is a time series b y letting eac h transcr ip tio n factor activit y ha ve an in d epen - den t Gaussian p rocess p rior as d esc rib ed for CSLIM in Section 3.4 . W e will not attempt to use Q L to r ec o v er the ground tr uth connectivit y inform ation since RegulonDB is collec ted from a wide range of exp eriment al conditions and not only fr om the transcriptional activit y pro duced by the E . c oli du ring its transition from glucose to aceta te. T he results are sh o wn in Figure 17 . Results in Figure 17(e ) show the s ou r ce matrix Z reco v er ed b y our mo del together with those from NCA 13 . In this exp erimen t w e ran a single c hain and collected 6000 samp les after a burn-in p erio d of 2000 samp les (approximat ely 10 minute s in a desktop mac hine). Most of the profiles obtained by our metho d are similar to those obtained b y NCA ( Kao et al. , 2004 ). W e ran tw o ve rsions of our mo del, one with Q L fixed to the RegulonDB v alues, i.e. similar in spirit to NCA, and another when we infer Q L without an y restriction. The results of NCA and our mo del with fixed Q L are directly comparable (up to scaling) whereas w e had to matc h the p erm utation P f of the unr estrict ed mo del to those f ound by NCA in order to compare, using the Hungarian algorithm. Figure 17(a) sho w s the mixing matrices obtained by NCA and our t wo mo dels. Figures 17(a) and 17(b) are ve ry similar d ue to the restriction imp osed on Q L . Th e mixing m atrix obtained by our unrestricted mo del in Figure 17(c) is clearly d en ser than the other tw o, suggesting th at there are d ifferen t wa ys of connecting genes and transcription factors and still reconstruct the transcription factor activitie s giv en the observ ed gene expression data. When looking to the test log-lik eliho od densities obtained by our t wo mo dels in Figure 17(d) they are ve ry similar, whic h suggests that there is no evidence that one of the mo dels mak es a b etter fit on test data. In terms of Mean Squared Error (MSE), NCA obtained 0 . 0146 while our mo del r ea c h ed 0 . 0264 and 0 . 0218 on the r est ricted and unrestricted mo dels, resp ectiv ely , wh en usin g 90% of the d ata for inference. In addition, th e 95% credible inte rv als for the MSE were (0 . 023 1 , 0 . 032 9) and (0 . 016 4 , 0 . 030 9) resp ectiv ely . Th e latter sh ows again that there is no evidence that one of the thr ee mo dels is b etter than the other tw o, considering that: (i) NCA is trained on the en tire dataset and (ii) our un restricte d mo del could, in principle, pro duce mixing matrices arbitrarily denser than the connectivit y matrix extracted f r om RegulonDB, and thus, again in pr in ciple, lo we r MSE v alues. 12. http://re gulondb.ccg.u nam.mx/ . 13. Matlab pack age (v.2.3) av ailable at http://www .seas.ucla.e du/ ~ liaoj/down load.htm . 697 Henao and Winther 5 10 15 10 20 30 40 50 60 70 80 90 100 P S f r a g r e p l a c e m e n t s T i m e ( M i n u t e s ) A r c A C R P C y s B F a d R F r u R G a t R I c I R L e u O L r p N a r L P h o B P u r R R p o E R p o S T r p R T y r R Gene T ranscription factor L o g - l i k e l i h o o d D e n s i t y F a c t o r (a) 5 10 15 10 20 30 40 50 60 70 80 90 100 P S f r a g r e p l a c e m e n t s T i m e ( M i n u t e s ) A r c A C R P C y s B F a d R F r u R G a t R I c I R L e u O L r p N a r L P h o B P u r R R p o E R p o S T r p R T y r R Gene T ranscription factor L o g - l i k e l i h o o d D e n s i t y F a c t o r (b) 5 10 15 10 20 30 40 50 60 70 80 90 100 P S f r a g r e p l a c e m e n t s T i m e ( M i n u t e s ) A r c A C R P C y s B F a d R F r u R G a t R I c I R L e u O L r p N a r L P h o B P u r R R p o E R p o S T r p R T y r R Gene T r a n s c r i p t i o n f a c t o r L o g - l i k e l i h o o d D e n s i t y F actor (c) −2500 −2000 −1500 −1000 −500 0 0.5 1 1.5 2 2.5 3 3.5 x 10 −3 P S f r a g r e p l a c e m e n t s T i m e ( M i n u t e s ) A r c A C R P C y s B F a d R F r u R G a t R I c I R L e u O L r p N a r L P h o B P u r R R p o E R p o S T r p R T y r R G e n e T r a n s c r i p t i o n f a c t o r Log-lik elihoo d Density F a c t o r (d) 0 100 200 300 0 0.5 1 0 100 200 300 0 0.5 1 0 100 200 300 0 0.5 1 0 100 200 300 −1 −0.5 0 0 100 200 300 −1 0 1 0 100 200 300 0 0.5 1 0 100 200 300 0 0.5 1 IclR 0 100 200 300 −1 −0.5 0 0 100 200 300 −1 −0.5 0 0 100 200 300 −1 −0.5 0 0.5 0 100 200 300 −0.5 0 0.5 1 0 100 200 300 0 0.5 1 0 100 200 300 0 0.5 1 0 100 200 300 0 0.5 1 0 100 200 300 0 0.5 1 0 100 200 300 0 0.5 1 P S f r a g r e p l a c e m e n t s Time (Min utes) Time (Min utes) Time (Min utes) Time (Minutes) ArcA CRP CysB F adR F ruR GatR I c I R LeuO Lrp NarL PhoB PurR Rp oE Rp oS T rpR TyrR G e n e T r a n s c r i p t i o n f a c t o r L o g - l i k e l i h o o d D e n s i t y F a c t o r (e) Figure 17: Results for E. c oli dataset. Mixing m at rices estimated using: (a) NCA, (b) our form ulation when restricting Q L using RegulonDB information and (c) the factor mo del. (d) Mo del comparison r esults using test lik eliho o ds. The restricted mo del (dash-dotted line) obtained a m edian negativ e log-lik eliho od of 1463 . 4 w hereas the u nrestricted mo del (solid line) obtained 1317 . 1 , suggesting no significant mo del preferences. (e) Estimated tr an s criptio n factor activiti es, Z . O u r metho ds (solid and dash-dotted lines for unrestricted and restricted mo del resp ectiv ely) pro duce similar resu lts to those pro duced by NCA (dashed line). 698 Sp arse Linear Identifiable Mul tiv aria te Modeling 7. Discussion W e h a v e pr oposed a nov el approac h called SLIM (Sp arse L in ea r Id en tifiable Multiv ariate mo deling) to p erform inference and mo del comparison of general linear Ba y esian net w orks within th e same framew ork . The ke y ingredien ts for our Bay esian mo dels are slab and spike priors to promote sparsit y , hea vy -tailed p r iors to ensur e iden tifi ab ility an d predictiv e densi- ties (test likeli ho o ds) to p erform th e comparison. A set of candidate orderings is pro duced b y sto c hastic searc h during the factor mo del inference. Su bsequen tly , a linear D A G with or without laten t v ariables is learned for eac h of the cand idate s. T o the auth ors ’ knowle dge this is the fi r st time that a metho d for comparing suc h closely related linear mo dels has b een prop osed. T his s etting can b e v ery b eneficial in situations w here the p rior evidence suggests b oth DA G stru ct ure and/or u nmeasured v ariables in the d at a. W e also sho w that th e D A G with latent v ariables can b e fu lly iden tifiable and th at SLIM can b e extended to the non- linear case (SNIM - S p arse Non-linear Iden tifiable Multiv ariate mo deling), if the ordering of the v ariables is provided or can b e tested by exhaustiv e enumeration. F or example in the protein-signaling n etw ork ( Sac h s et al. , 2005 ), the textb ook ground truth suggests b oth D AG structure and a n umber of unmeasur ed p rote ins. The previous approac h ( Sac h s et al. , 2005 ) only p erformed structure learning in pure D AGs but our r esu lts usin g observ ational data alone suggest that th e data is b etter explained by a (p ossibly non -linear) D AG with laten t v ariables. O ur extensive resu lts on artificial data sho wed one by one the features of our mo del in eac h one of its v ariants, and demonstrated empirically their u sefulness and p oten tial app lic abilit y . When comparing against LiNGAM, our metho d alw a ys p erformed at least as well in ev ery case with a comparable computational cost. The presente d Ba ye sian framew ork also allo w s easy extension of our mo del to matc h different prior b eliefs ab out the problems at hand without significan tly c hanging the mo del and its conceptual foundations, as in CSLIM and SNIM. W e b eliev e that the priors that giv e r aise to sparse mo dels in the f u lly Ba y esian inference setting, like the tw o-lev el slab (cont inuous) and sp ike (p oin t-mass in zero) pr iors used are v ery p o w erful to ols for sim ultaneous m odel and parameter inference. They ma y b e usefu l in many settings in mac h in e learning where sparsity of parameters is d esirable. Although the p osterior distributions for slab and spike priors will b e non-con vex, it is our exp erience that inferen ce with blo c ke d Gibbs sampling actuall y has very go od con ve rgence prop erties. In the t wo-lev el appr oa c h , one uses a hierarc hy of t w o slab and spik e priors. The fir st is on the parameter and the second is on the mixture parameter (i.e. the probability that the parameter is non-zero). Instead of letting this parameter b e con trolled by a single Beta- distribution (one lev el appr oa c h ) we ha v e a s la b and spike distribution on it with a Beta- distributed slab component biased to wa rds one. This makes th e mo del more p arsimonious, i.e. th e probability that parameters are zero or non-zero is closer to zero and one and parameter settings are more robu st. In the follo win g we will discu s s op en questions and f uture directions. F rom the Ba y esian net work r epository exp erimen t it is clear that we need to impro v e our ordering search pro cedure if we wan t to use SLI M for pr oblems with more than sa y 50 v ariables. This basically amounts to fi n ding pr oposal distributions that b etter exp lo it the particularities of the mo del at hand . Another option could b e to pro vide the prop osal d istr ibution with some 699 Henao and Winther notion of memory to a v oid p erm u ta tions with lo w pr obabilit y and/or expand the co v erage of the searc hing pro cedure. It is we ll studied in the literature on sp arse m odels that for increasing n umber of ob- serv ations any mo del tends to lo ose its spars it y capabilities. This is b ecause the lik eliho od starts dominating the inference, making the p r ior distribution less inf ormati v e. The easiest w a y to handle s uc h an effect is to m ak e the hyp erparameters of the s parsit y prior dep endent on N . W e hav e n ot explored this phenomenon in SLIM but it should certainly b e tak en in to accoun t in the sp ecificat ion of sparsity p riors. Directly sp ecifying the d istr ibutions of the laten t v ariables in order to obtain identifi- abilit y in the general D AG with laten t v ariables requires ha v in g d ifferen t d istributions for the dr ivin g signals of the observed v ariables and latent v ariables. This ma y introdu ce mo del mismatc h or b e r estric tiv e in some cases as one will n ot h a v e this kin d of kno w ledge a pr iori. W e th u s n eed more principled w a y s to sp ecify distribu tio ns for z en suring identi fiably , with- out restricting some of its comp onen ts to h aving a p articular b eha vior, like having hea vier tails than the dr ivin g signals f or instance. W e conjecture that pr o viding z with a parame- terizatio n of Diric hlet pro cess priors with appropriate base measures w ould b e enough but w e are n ot certain whether this w ould b e su fficie nt in practice. W e set a priori that the comp onen ts of z are indep endent. Although this is a very reasonable assump tio n, it do es not allo w for connectivit y b et w een laten t v ariables as we see for example in the protein signaling net work, see Figure 15(a) . It is straigh t forwa rd to sp ecify suc h a mo del, although ident ifiabilit y b ecomes ev en harder to ensu re in this case. W e do not ha ve an ordering searc h p rocedur e for the non-linear v ers io n of S LIM. Th is is a necessary step since exh austiv e enumeration of all p ossible orderings is not an option b ey ond say 10 v ariables. T he main pr oblem is that the non-linear D A G has no equiv alen t factor mo del represent ation so we cannot directly exploit the p ermutatio n candidates w e find in SLIM. Ho w ev er, as long as the non-linearities are w eak, one migh t in pr inciple use the p ermutatio n candidates found in a factor mo del, i.e. th e linear effects will determine the correct ordering of the v ariables. SLIM cannot handle exp erimen tal (in terve nt ional) d ata , and consequently around 80% of the data fr om the Sac h s et al. ( 2005 ) stu d y is not us ed . It is well- established h o w to learn with interv ent ions in D AG s (see Sac h s et al. , 2005 ). The problem remains of how to form ulate effectiv e in ference with interv en tional data in the factor mo del. Ac kno wledgmen ts W e thank the editor and the thr ee an onymous referees for their helpful commen ts and discussions th a t impro ved the pr esentati on of this p aper. App endix A. Gibbs sampling Giv en a set of N observ ations in d dimensions, the data X = [ x 1 , . . . , x N ] and m latent v ariables, MCMC analysis is standard and can b e implemente d through Gibbs samp lin g. Note that in the follo wing, X i : and X : i are ro ws and columns of X , resp ectiv ely , and i , j , n are indexes for d imensions, f actors and observ ations, r espectiv ely . In the follo wing 700 Sp arse Linear Identifiable Mul tiv aria te Modeling w e describ e the conditional distrib utions needed to samp le fr om the stand ard factor mo del hierarc hy . Belo w we will briefly discus the mo difications needed for the D A G. Noise v ariance W e can sample eac h element of Ψ indep enden tly using ψ − 1 i | X i : , C i : , Z , V i , s s , s r ∼ Gamma ψ − 1 i s s + N + d 2 , s r + u , (13) where V i is a d iag onal matrix with en tries τ ij and u = 1 2 ( X i : − C i : Z )( X i : − C i : Z ) ⊤ + 1 2 C i : V − 1 i C ⊤ i : . F actors The conditional distrib ution of the laten t v ariables Z u sing the s ca le mixtures of Gaussians repr esentati on can b e computed in dep enden tly for eac h elemen t of z j n using z j n | X : n , C : j , Z : n , Ψ , υ j n ∼ N ( z j n | C ⊤ : j Ψ − 1 ǫ \ j n , u j n ) , (14) where u j n = ( C ⊤ : j Ψ − 1 C : j + υ − 1 j n ) − 1 and ǫ \ j n = X : n − C Z : n | z j n =0 . If the laten t factors are Laplace distributed the mixin g v ariances υ j n ha ve exp onenti al distribution, thus the resulting conditional is υ − 1 j n | z j n , λ ∼ IG υ − 1 j n λ | z j n | , λ 2 , and for the Student’s t , with corresp onding gamma densities as υ − 1 j n | z j n , σ 2 , θ ∼ Gamma υ − 1 j n θ + 1 2 , θ 2 + z 2 j n 2 σ 2 ! , where IG( ·| µ, λ ) is the inv erse Gaussian distribu tio n w ith mean µ and scale parameter λ ( Chhik ara and F olks , 1989 ). Gaussian pro cesses In practice, the p r ior distrib ution for eac h ro w of the matrix Z in CSLIM h as the form z j 1 , . . . , z j N ∼ N (0 , K j ), where K j is a co v ariance m at rix of size N × N built using k υ j ,n ( n, n ′ ). The conditional distrib ution for z j 1 , . . . , z j N can b e computed using z j 1 , . . . , z j N | X , C j : , Z \ j , Ψ ∼ N ( z j 1 , . . . , z j N | C ⊤ : j Ψ − 1 ǫ \ j V , V ) , where Z \ j is Z without ro w j , V = ( U + K − 1 j ) − 1 , U is a diagonal matrix with elemen ts C ⊤ : j Ψ − 1 C : j and ǫ \ j = X − CZ | z j 1 ,...,z j N =0 . The computation of V can b e done in a n u - merically stable w a y b y rewr iting V = K j − K j ( U − 1 + K j ) − 1 K j and then u s ing C holesky decomp osition and bac k s ubstitution to obtain in turn LL ⊤ = U − 1 + K j and L − 1 K j . The h yp erparameters of the co v ariance function in equation ( 9 ) can b e sampled using κ | υ , k s , k r ∼ Gamma κ k s + mu s , k r + m X j =1 υ j . 701 Henao and Winther F or the inv erse length-scales we use Metrop olis-Hastings u pd ate s with prop osal q ( υ ⋆ j | υ j ) = p ( υ ⋆ j ) and acceptance ratio ξ → ⋆ = N ( z j 1 , . . . , z j N | 0 , K ⋆ j ) N ( z j 1 , . . . , z j N | 0 , K j ) , where K ⋆ j is obtained usin g k υ ⋆ j ,n ( n, n ′ ). F or SNIM, we only need to replace C b y B , Z b y Y = [ y 1 . . . y N ] and k υ j ,n ( n, n ′ ) by k υ i ,x ( x , x ′ ). Mixing mat rix In order to sample eac h c ij from the conditional distr ibution of the matrix C we use c ij | X i : , C \ ij , Z j : , ψ i , τ ij ∼ N ( c ij | u ij ǫ \ ij Z ⊤ j : , u ij ψ i ) , (15) where u ij = ( Z j : Z ⊤ j : + τ − 1 ij ) − 1 and ǫ \ ij = X i : − C i : Z | d ij =0 . Note th at we only n ee d to sample those c ij for whic h r ij = 1, i.e. just the slab distribution. Sampling from the conditional distributions for τ ij can b e don e using τ − 1 ij | d j n , t s , t r ∼ Gamma τ − 1 ij t s + 1 2 , t r + d 2 ij 2 ψ i ! . (16) The conditional distribu tio ns f or the remaining p a rameters in the slab and sp ik e p rior can b e written firs t f or the masking m at rix Q as q ij | X i : , D i : , Z , ψ i , τ ij , η ij ∼ Bernoulli q ij ξ η ij 1 + ξ η ij , (17) where ξ η ij = α m ν j 1 − α m ν j ψ 1 / 2 i ( Z j : Z ⊤ j : + τ − 1 ij ) 1 / 2 exp ( ǫ \ ij Z ⊤ j : ) 2 2 ψ i ( Z j : Z ⊤ j : + τ − 1 ij ) ! , and the p robabilit y of eac h elemen t of C of b eing non -zero as η ij | u ij , q ij , α p , α m ∼ (1 − u ij ) δ ( η ij ) + u ij Beta( η ij | α p α m + q ij , α p (1 − α m ) + 1 − q ij ) , (18) where u ij ∼ Bernoulli( h ij | r ij + (1 − r ij ) ν j (1 − α m ) / (1 − ν j α m )), i.e. w e set u ij = 1 if q ij = 1. Finally , for the column-wise shared sparsit y rate we ha v e ν j | u j , β p , β m ∼ Beta ν j β p β m + d X i =1 u ij , β p (1 − β m ) + d X i =1 (1 − u ij ) ! . (19) Sampling from the D A G mo del only requir es min or changes in notation but the conditional p osteriors are essentia lly the same. The changes mostly amoun t to replacing accordingly C b y B and Q b y R . Note that Q L is the iden tity and R is strictly lo wer triangular a priori, th us we only need to sample their activ e elemen ts. 702 Sp arse Linear Identifiable Mul tiv aria te Modeling Inference with missing v alues W e in tro duce a b inary masking matrix ind ic ating whether an element of X is missing or not. F or the f ac tor mo del we h a v e the follo wing mo dified lik eliho o d p ( X tr | C , Z , Ψ , M miss ) = N ( M miss ⊙ X | M miss ⊙ ( C Z ) , Ψ ) . T esting on the missing v alues, M ⋆ miss = 11 ⊤ − M requires av eraging the test likeli ho o d p ( X ⋆ | C , Z , Ψ , M ⋆ miss ) = N ( M ⋆ miss ⊙ X | M ⋆ miss ⊙ ( CZ ) , Ψ ) , o ver C , Z , Ψ giv en X tr (training). W e can approxi mate the p redictiv e density p ( X ⋆ | X tr , · ) b y compu ting the lik eliho od ab o v e dur ing sampling using the conditional p osteriors of C , Z and Ψ and then summarizing using for example the med ia n. Dra wing from C , Z , Ψ can b e achiev ed by sampling from their resp ectiv e conditional distributions as describ ed b efore with some minor mo difications. References D. F. Andrews and C. L. Mallo ws. Scale mixtures of normal distrib u tio ns. Journal of the R oyal Statistic al So ciety: Series B (Metho dolo gy) , 36(1) :99–102 , 1974. A. Asun cio n and D .J. Newman . UC I mac hin e learning r epository , 2007. A. Azzalini and A. W. Bo wman . A look at some d ata on the O ld Faithful geyser. Journal of the R oyal Statistic al So ciety. Series C (Applie d Statistics) , 39(3):357–3 65, 1990. P . Bekk er and J. M. F. ten Berge. Generic global inden tification in factor analysis. Line ar Algebr a and its Applic ations , 264(1– 3):255– 263, 1997. M. Branco and D. K. Dey . A general class of m u ltiv ariate s kew-elliptic al distributions. Journal of Multivariate Analysis , 79(1):99 –113, 2001. C. M. Carv alho, J. Chang, J. E. Lucas, J. R. Nevins, Q. W ang, and M. W est. High- dimensional sp arse facto r mo deling: Applicatio ns in gene expression genomics. J ournal of the Americ an Statistic al Asso ciation , 103(4 84):1438 –1456, 2008. R. S. Chhik ara and L. F olks. The Inverse Gaussian Distribution: The ory, Metho dolo gy, and Applic ations . M. Dekk er, New Y ork, 1989. S. Chib. Marginal lik eliho od from the Gibbs output. Journal of the Americ an Statistic al Asso ciation , 90(732):13 13–1321, 1995. D. M. Ch ic k erin g. Learning Ba yesian n et w orks is NP-complete. In D. Fisher and H.-J. L en z, editors, L e arning fr om Data: A I and Statistics , pages 121–13 0. S p ringer-V erlag, 1996. P . Comon. Indep endent comp onen t analysis, a n ew concept? Signal Pr o c essing , 36(3): 287–3 14, 1994. G. F. Co op er and E. Hersk o vits. A Ba ye sian method for the ind uctio n of probabilistic net works from data. Machine L e arning , 9(4 ):309–34 7, 1992 . 703 Henao and Winther P . Daniusis, J. Janzing, J. Mo oij, J. Zscheisc hler, B. Steudel, K. Z hang, and B. Sc h¨ olk opf. Inferring deterministic causal r el ations. In Pr o c e e dings of the 26th Confer enc e on Unc er- tainty in Artificial Intel ligenc e , 2010. A. P Da wid and S. L Lauritzen. Hyp er Mark ov la ws in the statistic al analysis of decomp os- able graphical mo d els. Annals of Statistics , 21(3):127 2–1317 , 1993. A. P . Dempster. C o v ariance selection. Biometrics , 28: 157–175 , 1972. G. Elidan, I. Nac hman, and N. F riedman. “Ideal Parent ” structure learning for con tin uous v ariable Ba y esian netw orks. Journal of Machine L e arning R ese ar ch , 8:1799 –1833, 2007. N. F r ie dman and D. Koller. Being Ba yesian ab out net work structure: A Bay esian approac h to structur e d isco very in Ba ye sian net works. Machine L e arning , 50(1–2 ):95–12 5, 2003. N. F riedman and I. Nac hman. Gaussian pro cess net wo rks. In Pr o c e e dings of the 16th Confer enc e on Unc ertainty in Artificial Intel ligenc e , pages 211–21 9. 2000. N. F riedman, I. Nac hman, and D. P e’er. Learnin g Ba yesia n net work structur e from m assiv e datasets: The “sparse candidate” algorithm. In K. B. Lask ey and H. P rade, editors, Pr o c e e dings of the 15th Confer enc e on U nc ertainty i n Artificial Intel ligenc e , pages 206– 215, 1999. N. F r iel and A. N. P ettitt. Marginal lik eliho od estimation via p o w er p osteriors. J ournal of the R oyal Statistic al So ciety: Series B (Metho dolo g y) , 70(3):589– 607, 2008. S. Gama-Castro, V. J im ´ enez-Jacin to, M. P eralta-Gil , A. Santos- Za v aleta, M. I. Pe˜ nalo za- Spinola, B. Contreras-Mo reira, J. S eg ura-Salazar, L. Mu ˜ niz-Rasca do, I. Mart ´ ınez- Flores, H. Salgado, C. Bona vides-Mart ´ ınez, C. Abreu-Go od ger, C . Ro dr ´ ıguez- P enagos, J. Miranda-R ´ ıo s, E. Morett, E. Merino, A. M. Huerta, L. T revi ˜ no-Quint anilla, and J. C ol lado-Vides. RegulonDB (v ersion 6.0): gene regulation mo del of Esc h eric hia coli K-12 b ey ond transcrip tion, activ e (exp erimen tal) annotated p romoters and textpresso na vigation. Nuc lei c A cids R ese ar ch , 36(Dat abase Issue):120–124 , 2008. E. I. George and R. E. McCullo c h. V ariable selection via Gibbs sampling. Journal of the Americ an Statistic al A sso ciation , 88(4 23):881 –889, 1993. J. Gew ek e. V ariable selection and mo del comparison in regression. In J. Berger, J. Bernardo, A. Da w id, and A. S mith, editors, Bayesian Statistics 5 , pages 609–62 0. Oxf ord Un iv ersit y Press, 1996. Z. Gh ahramani, T. L. Griffiths, and P . Sollic h. Ba y esian n onparametric laten t feature mo dels. In J. Bernardo, M. Ba y arri, J. Berger, A. Da wid, D. Hec k erman, A. Smith , and M. W est, editors, Bayesian Statistics 8 , pages 201–22 6. Oxf ord Universit y Press, 2006. P . Giudici and P . J Green. Decomp osable graphical Gaussian mo del d et ermination. Biometrika , 86(4):78 5–801, 1999. 704 Sp arse Linear Identifiable Mul tiv aria te Modeling A. Gretton, K. F ukumizu, C. H. T eo, L. Song, B. S c h¨ olk opf, a nd A. Smola. A ke rnel statistica l test of indep endence. In J . C. Platt, D. Koller, Y. Singer, and S . Ro weis, editors, A dvanc es in Neur al Information Pr o c essing Systems 20 , pages 585–59 2. MIT Press, 2008. D. Hec k erman, D. M. Chick ering, C. Meek, R. Rount hw aite, and C. Kadie. Dep endency net works for inf erence , collab orativ e fi ltering, and d ata visualizatio n. Journal of M achine L e arning R ese ar ch , 1:49–7 5, 2000. R. Henao and O. Wint her. Ba ye sian sparse f ac tor mo dels and DA Gs inferen ce and compari- son. In Y. Bengio, D. Sc huurmans, J. Laffert y , C. K. I. Williams, and A. Culotta, editors, A dvanc e s in Neur al Information Pr o c essing Systems 22 , pages 736–74 4. The MIT Press, 2009. P . O. Ho yer, S. Sh imizu, A. J. Kerminen, and M. P alviainen. Estimation of causal effects using linear n on-Ga ussian causal mo dels with hidd en v ariables. Inter antional Journal of Appr oximate R e asoning , 49(2) :362–37 8, 2008. P .O. Ho yer, D. J a nzing, J. M. Mooij, J. Pete rs, and B. Sch¨ olk opf. Nonlinear causal disco very with additiv e noise mo dels. In D. Koller, D. Sch uurm ans, Y. Bengio, and L. Bottou, editors, A dvanc es in Neur al Information Pr o c essing Systems 21 , pages 689 –696. 200 9. A. Hyv¨ arin en, J. Karhunen, and E. Oja. Indep endent Comp onent Analysis . Wile y- In terscience, 2001. H. Ishw aran and J. S. Rao. Spik e and slab v ariable selection: F r equ en tist and Ba yesia n strategies. Annals of Statistics , 33(2):73 0–773, 2005. I. T . Jolliffe, N. T. T rend afilo v, and M. Ud din. A m o dified principal comp onen t tec hnique based on the LASSO. Journal of Computatio nal and Gr aphic al Statistics , 12(3):53 1–547, 2003. A. M. Kagan, YU. V Linnik, and C . R ad h akrishna Rao. Char acterization Pr oblems in Mathematic al Statistics . Probability and Mathematical Statistics. Wiley , New Y ork, 1973. K. C . Kao, Y-L. Y ang, R. Boscolo, C. S ab atti, V. Ro yc ho w dh ur y , and J . C. Liao. T ranscriptome-based d ete rmination of multiple transcription regulator activities in Es- c her ichia Coli b y using net w ork comp onen t an alysis. PNAS , 101(2):641– 646, 2004. D. Kn owles and Z . Ghahramani. In finite sp arse factor analysis and in finite indep endent comp onen ts analysis. I n M. E. Da vies, C. C. James, S. A. Ab dallah, and M. D. Plu m bley , editors, 7th International Confer e nc e on Indep endent Comp onent Analysis and Si g na l Sep ar ation , v olume 4666 of L e ctur e Notes in Computer Scienc e , pages 381–388. Sp ringer- V erlag, Berlin, 2007. F. B. Lemp ers. Posterior P r ob abilities of Alternative Line ar M o dels . Rotterdam Unive rsit y Press, 1971. H. F. Lop es and M. W est. Ba yesia n mo del assessmen t in factor analysis. Statistic a Sinic a , 14(1): 41–67, 2004. 705 Henao and Winther J. Lucas, C. C arv alho, Q. W ang, A. Bild, J. R. Nevins, and M. W est. Bayesian Infer enc e for Gene Expr ession and P r ote omics , c h ap ter Sparse Statistical Mo deling in Gene Exp ression Genomics, pages 155 –176. Cam bridge Univ ersity Press, 2006. J. K. Martin and R. P . McDonald. Ba y esian estimation in u n restricted facto r analysis: A treatmen t for h eyw o od cases. Psychometrika , 40(4):505 –517, 1975. T. J. Mitc h ell and J. J. Beauc hamp . Ba ye sian v ariable selection in linear regression. Journal of the Americ an Statistic al Asso ciation , 83(40 4):1023– 1032, 1988. J. Mo oij and D. Janzing. Distinguishing b et w een cause and effect . In JMLR Workshop and Confer enc e Pr o c e e dings , vo lume 6, pages 147–156, 2010. I. Murray . A dvanc es in Markov Chain Monte Carlo Metho ds . PhD thesis, Gatsby compu- tational neur o science un it, Un iversit y College Lond on, 2007. R. Neal. Ann ea led imp ortance samplin g. Statistics and Computing , 11(2):125 –139, 2001. T. Pa rk and G. Casella. The Ba yesian lasso. Journal of the Americ an Statistic al A sso ciation , 103(4 82):681– 686, 2008. J. Pe arl. Causality: Mo dels, R e asoning, and Infer enc e . Cam bridge Univ ersity Press, 2000. P . Rai and H. Daume I I I. The infinite h ierarc hical factor regression mo del. In D. Koller, D. Sc h uur m ans, Y. Bengio, and L. Bottou, editors, A dvanc es in Neur al Information Pr o c e ssing Systems 21 , pages 1321–13 28. The MIT Press, 2009. B. Ra jaratman, H. Massam, and C. Carv alho. Flexible co v ariance estimation in graphical gaussian mo dels. Annals of Statistics , 36(6):2 818–284 9, 2008. J. M. Robin s , R. S c heines, P . Sp irtes, and L. W asserm a n. Uniform consistency in causal inference. Biometrika , 90(3):491– 515, 2003. K. Sac hs, O. P erez, D. Pe’ er, D. A. L au ffenburger, and G. P . Nolan. Causal protein-signaling net works deriv ed from m ultiparameter sin gle -cell data. Scienc e , 308(572 1):523– 529, 2005. M. W. Sc hmidt, A. Niculescu-Mizil, and K. P . Mu rph y . Learning graphical mo del struc- ture using L1-regularization paths. In P r o c e e dings of the 22nd National Confer enc e on Artificial Intel ligenc e , pages 1278–1283 , 2007. S. S himizu, P . O. Ho y er, A. Hyv¨ arin en , and A. Kerminen . A lin ea r non-Gaussian acyclic mo del for causal d isco very . Journal of M achine L e arning R ese ar ch , 7:2003–203 0, 2006 . R. S ilv a. Causality in the Scienc es , c h ap ter Measurin g Latent Causal Structur e. Oxford Univ ersit y Press, 2010 . P . S pirtes, C. Glymour , an d R. Sc heines. Causation, P r e diction, and Se ar ch . The MIT Press, second ed it ion, 2001. M. T eyssier and D. Koller. Orderin g- based search: A simp le and effectiv e algorithm for learning Ba yesian net w orks. In Pr o c e e dings of the 21st Confer enc e on Unc ertainty in Artificial Intel ligenc e , pages 548–549, 2005. 706 Sp arse Linear Identifiable Mul tiv aria te Modeling R. Th ibaux and M. I. Jordan. Hierarc h ic al b eta pro cesses and th e indian bu ffet pr o cess. In M. Meila and X. Shen, editors, P r o c e e dings of the Eleventh Internationa l Confer enc e on Artificial Intel ligenc e and Statistics , pages 564– 571, 2007. R. Tibshirani. R egression sh rink age and selectio n via the lasso. Journal of the R oyal Statistic al So ciety: Series B (M etho dolo gy) , 58(1):267 –288, 1996. R. Tillman, A. Gretton, and P . Spirtes. Nonlin ear dir ected acyclic structure learning with w eakly add itiv e noise mo dels. In A dvanc es in N eur al Information Pr o c essing Systems 22 , pages 1847–1 855. Y. Bengio and D. S ch uu rmans and J. Lafferty and C. K. I. Williams and A. C u lot ta, 200 9. I. T s ama rdinos, L. E. Bro w n , and C. F. Aliferis. The max-min hill-clim bin g Bay esian net work structur e learning algorithm. Machine L e arning , 65(1): 31–78, 2006. M. W est. On scale mixtures of normal distr ibutions. Biometrika , 74(3):6 46–648 , 1987. M. W est. Ba ye sian factor r eg ression mo dels in the “large p , sm al l n ” paradigm. I n J. Bernardo, M. Ba yarri, J. Berger, A. Da wid, D. Hec kerman, A. Smith, and M. W est, editors, Bayesian Statistics 7 , pages 723–732. Oxford Universit y Press, 2003. S. Y u, V. T resp, and K . Y u. Robust m u lti -task learning with t -pr ocesses. In Pr o c e e dings of the 24th International Confer enc e on Machine L e arning , v olume 227, pages 1103– 1110, 2007. K. Zhang and A. Hyv¨ arinen. On the iden tifiabilit y of the p ost-nonlinear causal mo del. I n Pr o c e e dings of the 25th Confer enc e on U nc ertainty i n Artificial Intel ligenc e , pages 647– 655. AU AI Press, 2009. K. Zhang an d A. Hyv¨ arinen. Distinguishing causes from effect using nonlinear acyclic causal mo dels. In JMLR Workshop and Confer enc e Pr o c e e dings , volume 6, pages 157–164 , 201 0. H. Zou, T. Hastie, and R. Tibshirani. Sparse principal comp onen t analysis. Journal of Computation al and Gr aphic al Statistics , 15(2):2 62–286 , 2006. 707
Original Paper
Loading high-quality paper...
Comments & Academic Discussion
Loading comments...
Leave a Comment