Defining a robust biological prior from Pathway Analysis to drive Network Inference
Inferring genetic networks from gene expression data is one of the most challenging work in the post-genomic era, partly due to the vast space of possible networks and the relatively small amount of data available. In this field, Gaussian Graphical M…
Authors: Marine Jeanmougin, Mickael Guedj, Christophe Ambroise
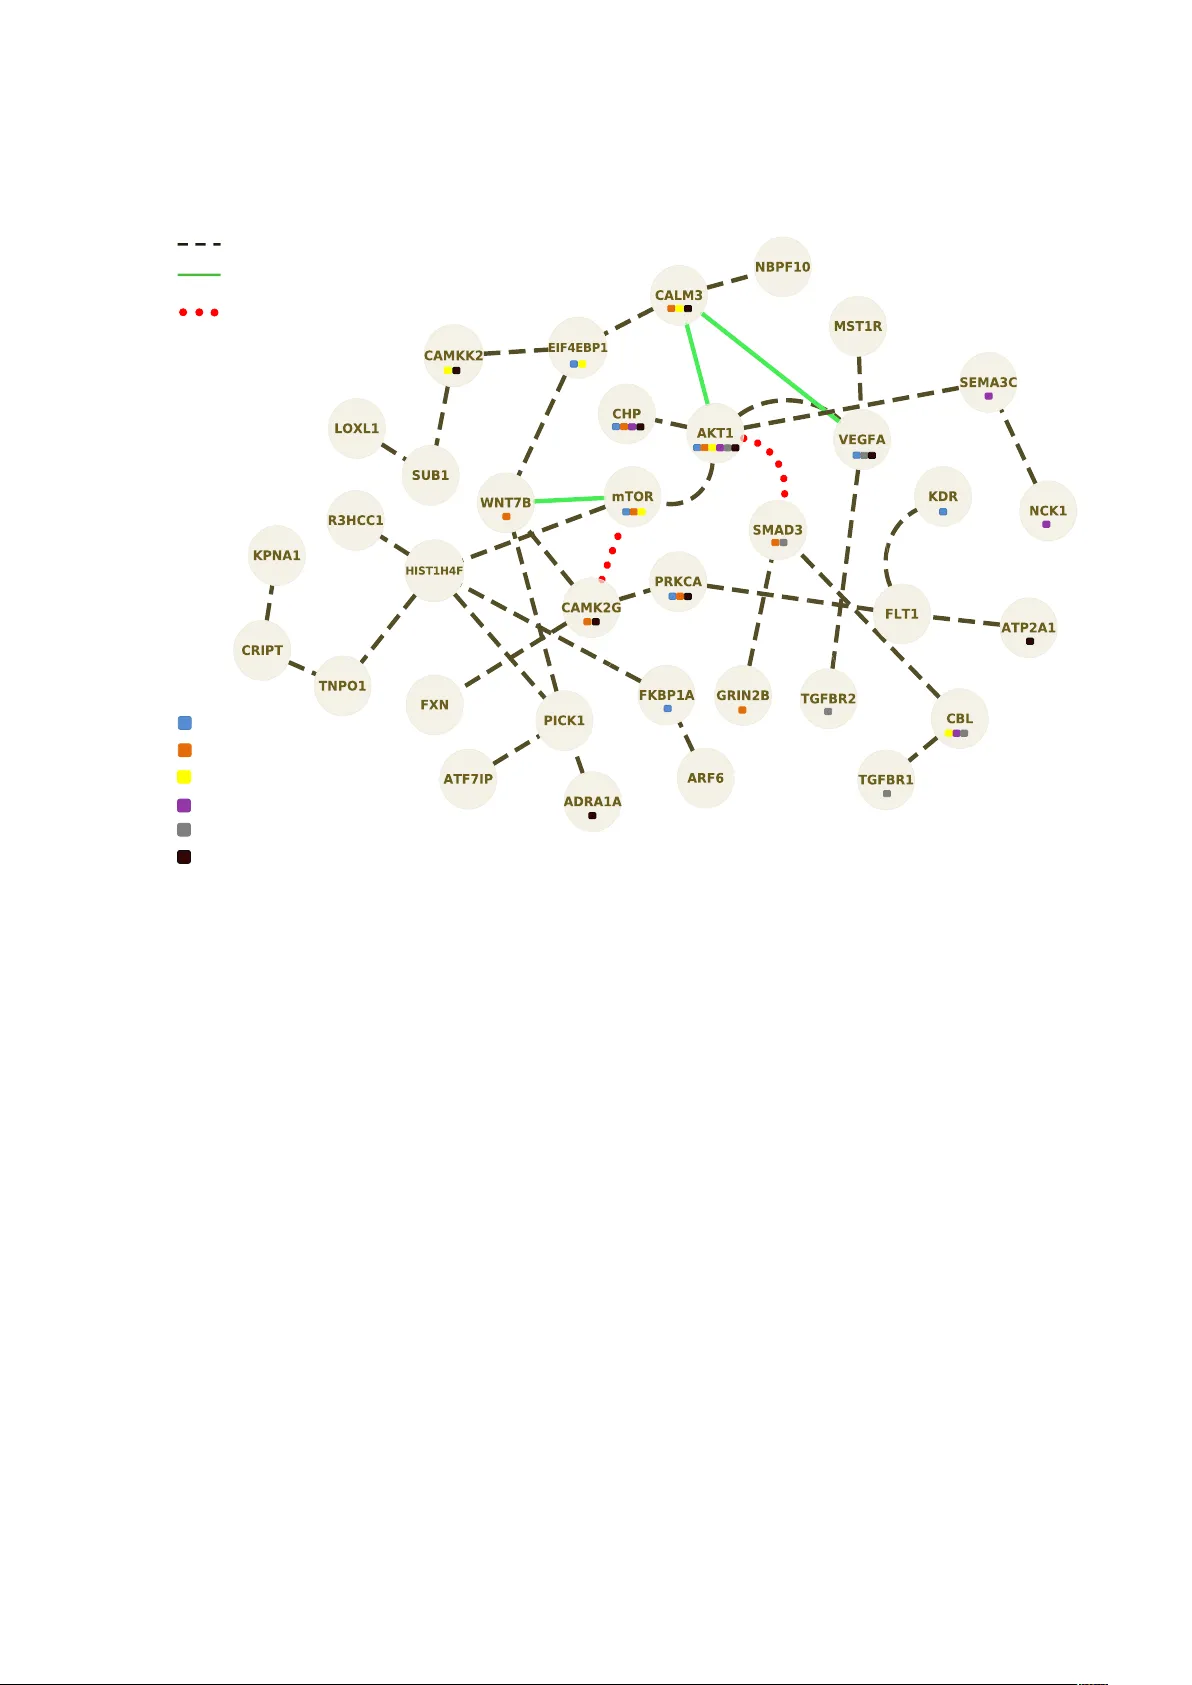
Submission Jour nal de la Société F rançaise de Statistique Defining a r ob ust biological prior fr om P athwa y Anal ysis to drive Netw ork Inference . Titr e: Construction d’un a priori biologique robuste à partir de l’analyse de v oies métaboliques pour l’inférence de réseaux. Marine Jeanmougin 1,2 , Mickael Guedj 2 and Christophe Ambroise 1 Abstract: Inferring genetic networks from gene expression data is one of the most challenging work in the post-genomic era, partly due to the vast space of possible networks and the relatively small amount of data available. In this field, Gaussian Graphical Model (GGM) provides a con v enient framew ork for the discovery of biological netw orks. In this paper , we propose an original approach for inferring gene regulation networks using a robust biological prior on their structure in order to limit the set of candidate networks. Pathways, that represent biological knowledge on the regulatory networks, will be used as an informative prior knowledge to dri ve Network Inference. This approach is based on the selection of a rele v ant set of genes, called the “molecular signature”, associated with a condition of interest (for instance, the genes in volv ed in disease development). In this context, dif ferential e xpression analysis is a well established strate gy . Howe ver outcome signatures are often not consistent and sho w little overlap between studies. Thus, we will dedicate the first part of our work to the impro vement of the standard process of biomark er identification to guarantee the rob ustness and reproducibility of the molecular signature. Our approach enables to compare the networks inferred between two conditions of interest (for instance case and control networks) and help along the biological interpretation of results. Thus it allows to identify differential regulations that occur in these conditions. W e illustrate the proposed approach by applying our method to a study of breast cancer’ s response to treatment. Résumé : L ’inférence de réseaux génétiques à partir de données issues de biopuces est un des défis majeurs de l’ère post- génomique, en partie à cause du grand nombre de réseaux possibles et de la quantité relativ ement faible de données disponibles. Dans ce contexte, la théorie des modèles graphiques gaussiens est un outil efficace pour la reconstruction de réseaux. A trav ers ce trav ail nous proposons une approche d’inférence de réseaux de régulation à partir d’un a priori biologique robuste sur la structure des réseaux afin de limiter le nombre de candidats possibles. Les voies métaboliques, qui rendent compte des connaissances biologiques des réseaux de régulation, nous per- mettent de définir cet a priori . Cette approche est basée sur la sélection d’un ensemble de gènes pertinents, appelé “signature moléculaire”, potentiellement associé à un phénotype d’intérêt (par ex emple les gènes impliqués dans le développement d’une pathologie). Dans ce contexte, l’analyse dif férentielle est la strategie prédominante. Néanmoins les signatures de gènes diffèrent d’une étude à l’autre et la robustesse de telles approches peut être remise en question. Ainsi, la première partie de notre trav ail consistera en l’amélioration de la stratégie d’identification des gènes les plus 1. Statistics and Genome laboratory UMR CNRS 8071, Univ ersity of Evry , Evry , France. E-mail: marine.jeanmougin@genopole.cnrs.fr 2. Department of Biostatistics, Pharnext, P aris, France. E-mail: mickael.guedj@pharnext.com and E-mail: Christophe.Ambroise@genopole.cnrs.fr Soumis au Journal de la Société Française de Statistique File: BBC.tex, compiled with jsfds, version : 2009/12/09 date: April 4, 2019 2 Jeanmougin, Guedj and Ambroise informatifs afin de garantir la robustesse et la reproductibilité de la signature moléculaire. Notre approche vise à comparer les réseaux inférés dans différentes conditions d’étude et à faciliter l’interprétation biologique des résultats. Ainsi, elle permet de mettre en av ant des régulations dif férentielles entre ces conditions. Nous appliquerons notre méthode à l’étude de la réponse au traitement dans le cancer du sein. Keyw ords: Network Inference, Gaussian Graphical Model, ` 1 penalization, Prior information, Pathway Analysis Mots-clés : Inférence de réseaux, Modèle graphique gaussien, Pénalisation ` 1 , Information a priori, Analyse de voies métaboliques AMS 2000 subject classifications: 60K35, 1. Introduction Adv ances in Molecular Biology and substantial improvements in microarray technology ha ve led biologists to ward high-throughput genomic studies. It has become possible to detect tens of thousands of genes and compare their expression le v els between samples in a single experiment. These data describe dynamic changes in gene expression closely related to regulatory ev ents with- out of fering any e xplanation on ho w this is all managed by the genome. The use of microarrays to discov er differentially e xpressed genes between two or more conditions (patients versus controls for instance) has found many applications. These include the identification of disease biomarkers (i.e. the genes potentially associated with a giv en disease) that may be important in the diagnosis of the different types or subtypes of diseases. A common challenge faced by the researchers is to translate the identified sets of differentially expressed genes into a better understanding of the underlying biological phenomena. A wealth of analysis tools are a v ailable among which Pathw ay Analysis and Netw ork Inference are getting especially popular in the field of gene expression data analysis. The y both hold great promise to interpret genome-wide profile. Pathw ays can be defined as sets of gene products interacting in order to achiev e a specific cellular function (cell c ycle or apoptosis for instance). Pathw ay Analysis aims at determining whether the set of dif ferentially e xpressed genes is “enriched” by a gi ven pathway or cellular func- tion. Pathway Analysis approaches ha ve the adv antage of pro viding a clear and direct biological interpretation. Ho wev er it can appear restricti ve as pathways represent a strong biological prior and results will not de viate from our current knowledge of the cellular mechanisms. On the other side, the purpose of Netw ork Inference is to predict the presence or absence of edges between a set of genes known to form the vertices of a network, the prediction being based on gene expression le vels. V arious statistical frame works ha v e been proposed to solv e the netw ork inference problem [7, 33]. Graphical models such as Bayesian network [9] and constraint-based methods are popular framew orks to model the gene re gulatory netw orks. Modelings with the Boolean networks [14, 17, 25, 30] or dif ferential equations hav e also been in vestig ated. Discov ering structures of regulation networks based on lar ge-scale data represents a major chal- lenge in Systems Biology , partly because the space of possible networks is often too lar ge compared to the relati vely small amount of data a vailable. Moreov er , exploring all possible network topologies is not computationally feasible. Howe v er , all the networks are not equally Soumis au Journal de la Société Française de Statistique File: BBC.tex, compiled with jsfds, version : 2009/12/09 date: April 4, 2019 Network Inference from a biological prior 3 plausible and the use of biological knowledge may help to limit the set of candidate networks. Little research have already been made to associate biological informativ e prior to Network Inference in a Bayesian network framew ork [19] or by the use of dynamic Bayesian networks [3] from time series data. In the field of Machine Learning other kinds of approaches hav e been proposed based on kernel metric learning [32, 35]. In this paper , we propose a 3-step approach to define a biological prior on network structure to driv e the Network Inference. Our intention here is to overcome both Pathway Analysis and Network Inference limitations by inte grating these two approaches. W e will dedicate the first part of our work to the improvement of the standard process of biomarker identification to guarantee the rob ustness and reproducibility of the gene signature. Indeed due to the biological and technical v ariability within the e xpression data, robust gene selection is a crucial issue. Most informati ve genes hav e to be identified to ensure the inference of a rele v ant network. The second step consists in correlating the signature with a priori defined gene sets from biological pathway databases. The resulting metabolic and signaling pathw ays will be used as an informati ve prior in the last step. Finally , a network is inferred with the idea to encourage the inference of an edge between two genes when they are known to participate to the same cellular function. A way to describe the interactions among the genome functional elements is by using conditional independencies and, more concretely , graphical models [16, 23, 34] which provide a con v enient setting for inferring gene regulatory netw orks. W e base our approach on this strate gy implemented in the R package SIMoNe (Statistical Inference for Modular Network) [5] which enables inference of undirected networks based on partial correlation. In this approach, Chiquet et al presents the first method dedicated to the inference of multiple graphs. In other words, when v arious e xperimental condi- tions are av ailable, they propose to estimate multiple GGMs jointly , in a multi-task framew ork by coupling the estimation of se veral networks. W e conduct our global approach on breast cancer data to identify the molecular mechanisms underlying the response to treatment using the cohort from Hess et al. 2006 [11] by comparing the networks inferred under 2 conditions: patients who achie v e pathological complete response (pCR) and those who do not (not-pCR). 2. Materials and Methods The purpose of this work is to provide a global frame work for transcriptomic data analysis and in particular for inferring co-expression networks from a relev ant biological informativ e prior based on P athway Analysis. The co-e xpression networks are seen as re gulation networks for which the direction of the edges and hence causality events are not known. Such analyses require as a preliminary step to select the genes in volv ed in the phenotype of interest that are assumed to be dif ferentially expressed between the conditions to compare. This selection is of great importance since the results of P athway Analysis and Netw ork Inference directly depend upon it. Hence, our global approach can be vie wed as a 3-step process: i) an improved selection of Soumis au Journal de la Société Française de Statistique File: BBC.tex, compiled with jsfds, version : 2009/12/09 date: April 4, 2019 4 Jeanmougin, Guedj and Ambroise dif ferentially expressed genes ii) a Pathw ay Analysis and iii) a Network Inference strategy using Pathw ay Analysis results as an informati v e biological prior . These 3 steps are fully described belo w and summarized in Figure 1. Normalized+ data+ Robust+g ene+selec4on+ A"priori" construc4on+from+ pathwa y+analysis+ Network+inf erence+ Step+1+ Step+2+ Step+3+ Figure 1. Global appr oach of expression data analysis. Our approach follows a 3-step process: from the expression data we first perform a rob ust selection to identify the most informati ve genes, called the signature. Then, we define the biological prior by conducting a Pathw ay Analysis on the gene signature. The last step consists in inferring a network dri ven by the prior defined at the pre vious step. Let us first introduce some notations. W e consider hereafter a sample of a random vectors X cr = ( X 1 cr , . . . , X p cr ) where X i cr is the le v el of e xpression observed for gene i , replicate r , under condition c ; The vector X cr is assumed to be Gaussian with positiv e definite cov ariance matrix Σ c = ( Σ c i j ) ( i , j ) ∈ P 2 where P = { 1 , . . . , p } . No loss of generality is in v olved when centering X cr , so we may assume that X cr ∼ N ( 0 p , Σ c ) . Step1: Gene selection by robust dif ferential analysis Gi ven two conditions to compare (called condition 1 et condition 2 in the following), a key question in the first step of expression data analysis is to identify a set of genes that shows a dif ferential expression between the two conditions of interest. This consists, for each gene, in testing the null hypothesis ( H 0 ) that the expected v alues of expression are equal between the two conditions, against the alternati ve hypothesis ( H 1 ) that they dif fer . The general model is then gi ven by: E ( X i cr ) = µ i c and Var ( X i cr ) = ( σ i c ) 2 . So defined, the null hypothesis to test comes do wn to: H 0 : µ i 1 = µ i 2 , H 1 : µ i 1 6 = µ i 2 . Soumis au Journal de la Société Française de Statistique File: BBC.tex, compiled with jsfds, version : 2009/12/09 date: April 4, 2019 Network Inference from a biological prior 5 At first glance, dif ferential analysis appears easy enough b ut in practice results from dif ferential analysis show a lack of reproducibility when compared in the literature [8]. In fact, due to the biological and technical noise inherent to high-throughput biological data, methodological aspects are still to in vestigate to obtain a more robust selection of differentially expressed genes. T o do so we propose se v eral methodological impro vements to the strate gy commonly used, that is generally reduced to the application of a t -test. If the t -test is certainly the most natural and popular test to assess differential expression, its efficacy in term of v ariance modeling and power on small sample sizes has been seriously questioned. The recent study from Jeanmougin et al. [12] demonstrates that the Bayesian frame work proposed by limma [26] outperforms all the usual methods to test for differential expression. Briefly , limma has the same interpretation as an ordinary t -statistic except that the standard errors hav e been moderated across genes: t i limma = ¯ x i 1 · − ¯ x i 2 · S i q 1 n 1 + 1 n 2 , where n 1 and n 2 are number of replicates of conditions 1 and 2 and ¯ x i 1 · is the a verage e xpression le vel for gene i and condition 1 (across all possible replicates). Indeed, posterior variance, S i , has been substituted into the classical t -statistic in place of the usual v ariance. Using Bayes rules, this posterior variance becomes a combination of an estimate obtained from a prior distribution and the pooled v ariance. Including a prior distribution on v ari- ances has the ef fect of borro wing information from the ensemble of the genes to aid with inference about each indi vidual gene. Thus, the posterior v alues shrink the observed v ariances to wards a common v alue, that is why it is called “moderated” t -statistic. This approach is implemented in the R package limma . Despite the use of limma , such a hypothesis testing strate gy to select dif ferentially expressed genes between 2 conditions can be biased by outliers. In this context, re-sampling based ap- proaches are pretty common methods. Here, we use random forest [4] for improving the o verall homogeneity of the signature obtained from differential analysis. The algorithm consists in fitting many binary decision trees built using se veral bootstrap samples and then in combining the predictions from all the trees. Random forest uses both bagging and random v ariable selection for tree b uilding. Thus, at each node, a gi ven number of input v ariables are randomly chosen and the best split is calculated only within this subset. The Out-Of-Bag sample (i.e. the set of observ ations which are not used for b uilding the current tree) is used to estimate the prediction error and then to e valuate v ariable importance. W e apply Random Forest algorithm (implemented in the R package randomForest ) to rank the significant genes resulting from limma according to v ariable importance (i.e ability to well discriminate the conditions). This approach enables to clean the set of differentially e xpressed genes from putati v e outliers by selecting most important v ariables. A simple Principal Component Analysis of the samples before and after the application of the Random Forest algorithm clearly sho w how it increases the separation of the conditions (Figure 2). Soumis au Journal de la Société Française de Statistique File: BBC.tex, compiled with jsfds, version : 2009/12/09 date: April 4, 2019 6 Jeanmougin, Guedj and Ambroise ● ● ● ● ● ● ● ● ● ● ● ● ● ● −40 −20 0 20 −40 −20 0 20 40 Before running Random Forest Axis1 Axis2 ● condition 1 condition 2 ● ● ● ● ● ● ● ● ● ● ● ● ● ● −5 0 5 10 −10 −5 0 5 10 After running Random Forest Axis1 Axis2 ● condition 1 condition 2 Figure 2. Impro ving discrimination between conditions using Random F orests . A Principal Component Analysis is performed on conditions of interest. The signature obtained by Random Forest (RF) algorithm enables to better discriminate condition 1 from condition 2 as shown in the figures before and after running the RF . Finally little agreement between studies in the literature is also due to the heterogeneity inherent to genetic diseases and to sampling variation for moderate sample size. Thus, two differential analyses based on tw o dif ferent studies may lead to dif ferent selection of genes, ho wev er resulting from the same regulatory process. Motiv ated by the observ ation that genes causing the same phenotype are likely to be functionally related [10, 15] (i.e they form some kind of module [21], for instance a multi-protein complex), we explore a network-based approach to identify modules of genes rather than individual genes. W e will refer to this approach as “functional partners identification” in the follo wing. One of the strongest manifestation of a functional relation between genes is Protein-Protein Interaction (PPI). Oti et al. [22] demonstrated that e xploiting PPIs can lead to nov el candidate gene prediction. While many PPI network databases are a vailable, such as Ingenuity Pathway Analysis (Ingenuity ® Systems, www.ingenuity.com ) or STRING [27], fe w studies hav e actually integrated such kno wledge for biomarkers identification. The PPI network was extracted using STRING . The interactions include direct (physical) and indirect (functional) associations deri ved from v arious sources on the basis of both experimental e vidence for PPIs as well as interactions predicted by comparativ e genomics and text mining. STRING uses a scoring system that is intended to reflect the evidence of predicted interactions. In the present study , we add the relev ant functional partners with a score of at least 0.9 (which corresponds to a high-confidence network) to the set of dif ferentially expressed genes. In the follo wing, our final set of genes will be called the "molecular signature" of the conditions Soumis au Journal de la Société Française de Statistique File: BBC.tex, compiled with jsfds, version : 2009/12/09 date: April 4, 2019 Network Inference from a biological prior 7 to compare. Step2: P athway Analysis to define a rob ust a priori Pathw ay Analysis aims at identifying the cellular processes inv olv ed in differentiating the tw o conditions to compare (cases and controls for instance) in order to enhance the interpretation of the molecular signature generated at step 1. In practice, P athway Analysis consists in determining whether the signature is enriched in pathway k ey actors. Gi ven the M genes measured on a microarray , our signature is defined as a subset of length n of these genes, and a given pathw ay is defined as another subset of length K of these genes. The probability of having y genes in common between our signature and a pathway is gi ven by the hyper geometric distribution: P ( Y = y ) = n y M − n K − y M K . This approach requires a pre-defined set of pathways to analyze. Several databases exist to- day and the K yoto Encyclopedia of Genes and Genomes (KEGG [13]) is often taken as a reference. The problem with the analysis of pathways is that they do not represent clearly distinct entities and two pathways can in volve common genes and hence share a common biological information. Consequently a set of genes can be responsible for the positi ve results of se veral pathw ays. In order to ease the interpretation of Pathw ay Analysis results, we propose to summarize the set of pathways found significant because of the same genes into a reduced set of "core pathways" (each core pathway represented by a set of pathways). In practice we apply a Hierarchical Clustering algorithm on a binary matrix, that contains the genes in ro w and the pathways in column, summarizing the membership of each gene to each pathway . Dissimilarity , which accounts for pairwise dif ferences between the pathways, is assessed by using a binary metric, also kno wn as the Jaccard distance. Finally , from this dissimilarity matrix we perform a Hierarchical Agglomerati ve Clustering using W ard’ s criterion. Each core pathway defines a gene cluster which will be used in the next step for inferring the regulation netw ork. Step 3: Network Inf erence from biological prior knowledge The last step of the procedure consists in inferring a part of the regulation network using the transcriptomic data from all av ailable conditions and from the prior structure e xhibited in the pathway analysis. This last step relies on a Gaussian Graphical Model, taking a dvantage of the relation existing between conditional independence and the concentration matrix. V ariables (i.e. genes) X i and X j with i 6 = j are independent conditional on all other variables indexed by P \{ i , j } , if and only if the entry ( Σ − 1 ) i j is zero. The inv erse of the cov ariance matrix K = ( K i j ) ( i , j ) ∈ P 2 = Σ − 1 , kno wn as the concentration matrix, thus describes the conditional Soumis au Journal de la Société Française de Statistique File: BBC.tex, compiled with jsfds, version : 2009/12/09 date: April 4, 2019 8 Jeanmougin, Guedj and Ambroise independence structure of X . Moreov er , each entry K i j , is directly linked to the partial correlation coef ficient r i j | P \{ i , j } between variables X i and X j . The inferred graph is described by the adjacency matrix defined by the nonzero elements of the concentration matrix. Merging dif ferent e xperimental conditions from transcriptomic data is a common practice in GGM-based inference methods [31]. This process enlarges the number of observ ations av ailable for inferring interactions. Ho we ver , GGMs assume that the observed data form an independent and identically distrib uted (i.i.d.) sample. But assuming that the merged data is drawn from a single Gaussian component is obviously wrong, and is likely to ha ve detrimental side ef fects in the estimation process. In this paper, we assume that the distributions of these dif ferent conditions ha v e strong common- alities. W e thus propose to estimate these graphs jointly . In this context, the multi-task learning provides a con v enient framew ork [5]. This approach allo ws to o vercome the dif ficulties arising from the scarcity of data in each experimental condition by coupling the estimation problems. Moreov er we tak e advantage of the pre viously exhibited gene clusters to put some prior structure on the inferred network. W e assume that the edges of the graph defined by the nonzero elements of the concentration matrix are distributed among a set Q = { 1 , . . . , Q } of gi ven ov erlapping clusters. For any gene i , the indicator variable Z iq is equal to 1 if i ∈ q and 0 otherwise, hence describing to which cluster the gene i belongs. The structure of the graph is thus described by the matrix Z = ( Z iq ) i ∈ P , q ∈ Q . Thus the group structure ov er the Q gene clusters and the structure ov er the 2 conditions lead to estimating the 2 concentration matrices which are the solutions of the follo wing penalized log-likelihood maximization problem: max K ( c ) , c ∈ 1 , 2 2 ∑ c = 1 L K ( c ) ; X − λ ∑ i , j ∈ P i 6 = j ρ Z i Z j 2 ∑ c = 1 h K ( c ) i j i 2 + ! 1 / 2 + 2 ∑ c = 1 h K ( c ) i j i 2 − ! 1 / 2 , (1) where [ u ] + = max ( 0 , u ) and [ u ] − = min ( 0 , u ) and the coef ficients of the penalty are defined as: ρ Z i Z j = ∑ q ,` ∈ Q Z iq Z j ` 1 λ in , if i 6 = j , and q = `, ∑ q ,` ∈ Q Z iq Z j ` 1 λ out , if i 6 = j , and q 6 = `, 1 , otherwise , (2) and L ( K ( c ) ; X ) = n 2 log det ( K ( c ) ) − n 2 T r ( S ( c ) K ) + C , with S ( c ) the empirical cov ariance matrix relati ve to condition c and C a constant term. The first part of the criterion ∑ 2 c = 1 L K ( c ) ; X consists in the sum of the log-likelihoods of the two concentration matrices gi v en the observ ations. The second part of the criterion is a penalty , which considers two types of edges: edges between two genes belonging to the same core pathw ay Soumis au Journal de la Société Française de Statistique File: BBC.tex, compiled with jsfds, version : 2009/12/09 date: April 4, 2019 Network Inference from a biological prior 9 are penalized with a coef ficient 1 / λ in and edges between two genes which are nev er present together in a pathway are penalized with a coef ficient 1 / λ out . The basic form of the penalty has been proposed in [2] where it has been sho wn via simulations that the kno wledge of an existing group structure was indeed impro ving the estimation of the non-zeros entries of the concentration matrix. The current form of the penalty [5] encourages co-regulation of the same sign across the two conditions. Specifically , co-regulation encompasses up-regulation and do wn-re gulation and the type of re gulation is not likely to be in verted across assays: in terms of partial correlations, sign swaps are v ery unlikely . 3. A pplication W e apply our approach to the study of the response to chemotherapy in breast cancers. The pathologic Complete Response (pCR), defined as the absence of disease in both the breast and lymph nodes, is used as an early surrogate marker of treatment efficac y . Most studies on response to chemotherapy ha ve considered breast cancer as a single homogeneous entity . Ho wev er , it is a complex disease that has a molecular and cellular heterogeneity that should not be ov erlooked in such studies. Perou et al. [24] were the first to report e vidence for breast cancer tumor subtypes based upon gene e xpression profiles. Since the v arious tumor subgroups were re-e valuated and breast cancers ha ve been classified into fi ve molecular classes: luminal A and B, basal, ErbB2+, and normal-like subgroups [28, 29]. These subtypes dif fer markedly in prognosis and in the repertoire of therapeutic targets they e xpress [20]. W ithin these five groups, basal-like breast cancers, quickly became a subtype of interest because of its features. Indeed it is associated with poor prognosis and characterized by its aggressi ve beha vior . Many reports hav e demonstrated that basal-lik e tumors are chemo-sensiti ve. This particular subtype of breast cancer correlated with significantly higher pCR rates when compared to other subtypes [18]. Ne vertheless, basal tumors harboring homogeneous clinical and pathologic features may exhibit highly v ariable response to chemotherapy . It raises ne w questions to biologists such as how to e xplain the dif ferences between patients who achieve a pCR from those that do not (not-pCR), and which are the molecular mechanisms in volv ed in chemo-sensitivity or resistance ? W e demonstrate that our approach based on Pathw ay Analysis and Network Inference can provides ef fecti ve tools to address such questions of biological and clinical interests. T o do so, we in v estigate the dataset proposed by Hess et al. [11] including 133 breast cancer samples for which the pCR status is kno wn. Gene expression profiling has been made based on the Af fymetrix U133A microarray . Following the methodology described in Sorlie et al. [28], we identify 29 basal tumors from the 133 samples, di vided into 15 pCR and 14 not-pCR. Step 1 - Comparison of the gene e xpression profiles between the pCR and not-pCR samples yields about 100 genes with statistically significant dif ferences (at a 10 − 3 le vel). W e add 30 k ey regulatory genes identified from the STRING database. These 130 genes represent the molecular signature of the pCR in our 29 basal tumors. Step 2 - The P athway Analysis dri v en from the molecular signature identified 22 significant Soumis au Journal de la Société Française de Statistique File: BBC.tex, compiled with jsfds, version : 2009/12/09 date: April 4, 2019 10 Jeanmougin, Guedj and Ambroise KEGG pathways (at a 5% le vel). The Hierarchical Clustering of these pathways lead to 6 core pathways that summarize 6 main, distinct and clear biological processes in v olved in the mecha- nisms of response to treatment in basal tumors (Figure 3). F or instance, one core pathw ay includes the VEGF , mT OR and IL8 signaling pathways, all associated with angiogenesis, the ne w blood vessel formation process required for tumor progression. Consequently , such results lead us to relate this core pathway to angiogenesis. Adherens junction Chronic m y eloid leuk emia P ancreatic cancer Colorectal cancer Nitric Oxide Signaling in the Cardiovascular System Calcium signaling pathway Calcium induced T Lymphocyte Apoptosis Wnt signaling pathw a y Olf actor y tr ansduction Long ter m potentiation Glioma Melanogenesis DNA polymerase Axon guidance T cell receptor signaling pathway Adipocytokine signaling pathw a y Insulin signaling pathw a y Acute m y eloid leuk emia Renal cell carcinoma VEGF signaling pathway MTOR pathway IL8 signaling 0.0 0.5 1.0 1.5 2.0 2.5 Height !"#$%#&"&'$'( !)%"(#*$+,"-&( .,/-$*0('$#",//$"#(1,234,5( Adherens junction Chronic myeloid leukemia Pancreatic cancer Colorectal cancer Nitr ic Oxide Signaling in the Cardio v ascular System Calcium signaling pathw a y Calcium induced T L ymphocyte Apoptosis Wnt signaling pathway Olfactory transduction Long term potentiation Glioma Melanogenesis DNA polymer ase Axon guidance T cell receptor signaling pathw a y Adipocytokine signaling pathway Insulin signaling pathway Acute myeloid leukemia Renal cell carcinoma VEGF signaling pathw a y MT OR pathw a y IL8 signaling 0.0 0.5 1.0 1.5 2.0 2.5 Height !"#$%$&'()*&+,-&( ./0('12&3441&2(536#738( 9$2*43,-&(-:(+$44(2%-76#( A B Figure 3. Core pathways. From the Hierarchical Clustering we identify 6 core pathways. Figure 3-A highlights the core pathways related to tumor cell gro wth and proliferation mechanism and Figure 3-B highlights the core pathways associated with angiogenesis acti vity . Step 3 - The 6 core pathways are taken as a biological prior for driving the Network Inference using the R package SIMoNe . A particularly interesting network subpart is shown on Figure 4, wich includes many genes known to be associated with breast cancer (for instance: mTOR, WNT , VEGF , AKT1...). In particular , it has been shown that the CALM3 gene regulates the acti vity of AKT1 in breast tumors [6]. Our network suggests that this re gulation occurs only in the pCR condition, and hence, may be broken for not-pCR tumors. 4. Discussion and conclusion The ability to infer networks from high-throughput genomic data is one of the most promising applications of Systems Biology . In this paper, we propose a global frame work to infer networks on the basis of a biological informati v e prior over network structures. It has the advantage to reduce the space of possible netw ork structures to in vestig ate, and to propose a more relev ant network in order to facilitate the interpretation of its edges. Network Inference is done using the SIMoNe algorithm de veloped by Chiquet et al. [5] and based on a weighted Lasso criterion in a Gaussian Graphical Model frame work. Soumis au Journal de la Société Française de Statistique File: BBC.tex, compiled with jsfds, version : 2009/12/09 date: April 4, 2019 Network Inference from a biological prior 11 Angiogenesis WNT signaling Cell growth Axon guidance Adherens junction Calcium signaling Edges&pr esent&in&both&pCR&and¬‐pCR&ne tworks& Edges&pr esent&in&pCR&network&only& Edges&pr esent&in¬ ‐pCR&network&only& Figure 4. Inferred graph from the Hess cohort. The figure displays an enlarged vie w of a network subpart. The black dashed edges are present in both pCR and not-pCR networks. In red are the edges inferred only in the not-pCR network and con versely , the green edges are only inferred in the pCR network. In this context, determining the biological prior to use is not a simple task. T o this purpose, we define an informati ve prior using P athway Analysis that allo ws, from molecular signature, to identify which are the main cellular mechanisms associated with a condition of interest. Man y public domain repositories exist for storing biological pathways, each based on its o wn set of con ventions. Thus pathways are not consistent among databases and the same pathway can present se veral definitions that v ary greatly in quality and completeness [1]. Pathway Analysis is hence database dependent. Howe v er our approach overcomes this limitation in tw o points: i) the definition of core pathways from the molecular signature makes our analysis less sensiti v e to the strict definition of pathways found in the databases and ii) it is possible to adjust the weighted penalization according to the confidence we hav e in each pathway definition. The core of such an approach, combining both P athway Analysis and Network Inference, is the selection of the most informati ve set of genes to discriminate between the two conditions Soumis au Journal de la Société Française de Statistique File: BBC.tex, compiled with jsfds, version : 2009/12/09 date: April 4, 2019 12 Jeanmougin, Guedj and Ambroise (i.e. the molecular signature). The rele vance of the biological findings at the end of the analysis greatly depends on this signature. In consequence, as a first step of our global Network Inference process, we propose an improved Differential Analysis. In particular , we aim to increase the reproductibility of the signature by removing potential outliers and identifying modules of genes via functional partners identification. It allo ws to include some well-studied genes (such AKT1) not detected in the differential analysis. Ho wev er the noise inherent to PPI data is one of the main limitations of this approach. Indeed, only fe w protein interactions are confirmed by the HPRD (Human Protein Reference Database). These high noise lev els reduce the accuracy of functional partners identification. By restricting our study to high-confidence score interactions, we focused on the most biologically relev ant interactions. Ho we ver it introduces a bias into our approach by selecting the most studied and documented proteins. Then, the functional partners identification step is highly dependent on the quality and the amount of data av ailable. The functional partners identification method still needs to be further improv ed and explored. In particular , we ha ve to de v elop an ev aluation strate gy to better assess the contrib ution of such a method in identifying genes of interest. Our application on breast cancer data highlights ke y re gulations in cancer progression and response to treatment. The co-expression of AKT1 and CALM3 that occurs specifically in the group responding to chemotherapy is a good e xample. Such results can be a starting point of more important applications at the biological and clinical le vels. Finally , the regulation of gene e xpression is a complex process resulting from se v eral regula- tory mechanisms occurring at distinct steps of the biological system (miRN A, eQTL, genomic alterations and epigenetic factors for instance) and gene expression data enables us to understand a limited part of the whole system. In this context, the inference of networks from heterogeneous biological data, such as eQTL, is a very promising topic to de v elop in the near future. Acknowledgement W e thank Caroline Paccard, Matthieu Bouaziz, Fabrice Glibert, Julien Chiquet, Carene Rizzon, Claudine De vauchelle, Camille Charbonnier and Serguei Nabirotchkin for helpful discussions. W e also thank Celeste Lebbe and Ilya Chumako v for their support. A uthor Contributions Concei ved and implemented the global process: MJ. Wrote the paper: MJ, MG and CA. Co-supervised the study: MG and CA. References [1] Michiel E. Adriaens, Magali Jaillard, Andra W aagmeester , Susan L.M. Coort, Ale x R. Pico, and Chris T .A. Evelo. The public road to high-quality curated biological pathways. Drug Discovery T oday , 13, 2008. [2] Christophe Ambroise, Julien Chiquet, and Catherine Matias. Inferring sparse gaussian graphical models with latent structure. Electr onic Journal of Statistics , 3:205–238, 2009. Soumis au Journal de la Société Française de Statistique File: BBC.tex, compiled with jsfds, version : 2009/12/09 date: April 4, 2019 Network Inference from a biological prior 13 [3] Allister Bernard and Alexander J Hartemink. Informative structure priors: joint learning of dynamic regulatory networks from multiple types of data. P ac Symp Biocomput , pages 459–470, 2005. [4] Leo Breiman. Random forests. Machine Learning , 45:5–32, 2001. 10.1023/A:1010933404324. [5] Julien Chiquet, Yves Grandv alet, and Christophe Ambroise. Inferring multiple graph structures. Statistics and Computing , 2010. [6] Christine M Coticchia, Chetana M Re v ankar , T ushar B Deb, Robert B Dickson, and Michael D Johnson. Calmodulin modulates akt activity in human breast cancer cell lines. Br east Cancer Res T r eat , 115(3):545–560, Jun 2009. [7] Hidde de Jong. Modeling and simulation of genetic regulatory systems: a literature review . J Comput Biol , 9(1):67–103, 2002. [8] Liat Ein-Dor , Itai K ela, Gad Getz, David Gi vol, and Eytan Doman y . Outcome signature genes in breast cancer: is there a unique set? Bioinformatics , 21(2):171–178, 2005. [9] Nir Friedman, Michal Linial, Iftach Nachman, and Dana Pe’er . Using bayesian networks to analyze expression data. J Comput Biol , 7(3-4):601–620, 2000. [10] T . K B Gandhi, Jun Zhong, Suresh Mathiv anan, L. Karthick, K. N. Chandrika, S. Sujatha Mohan, Salil Sharma, Stefan Pinkert, Shilpa Nag araju, Balamurugan Periaswamy , Goparani Mishra, Kannabiran Nandakumar , Beiyi Shen, Nandan Deshpande, Rashmi Nayak, Malabika Sarker , Jef D Boek e, Giov anni Parmigiani, Jörg Schultz, Joel S Bader , and Akhilesh P andey . Analysis of the human protein interactome and comparison with yeast, w orm and fly interaction datasets. Nat Genet , 38(3):285–293, Mar 2006. [11] Kenneth R Hess, K eith Anderson, W . Fraser Symmans, V icente V alero, Nuhad Ibrahim, Jaime A Mejia, Daniel Booser , Richard L Theriault, Aman U Buzdar , Peter J Dempsey , Roman Rouzier, Nour Sneige, Jef frey S Ross, T atiana V idaurre, Henry L Gómez, Gabriel N Hortobagyi, and Lajos Pusztai. Pharmacogenomic predictor of sensitivity to preoperati ve chemotherapy with paclitax el and fluorouracil, doxorubicin, and cyclophosphamide in breast cancer . J Clin Oncol , 24(26):4236–4244, Sep 2006. [12] Marine Jeanmougin, Aurelien de Reynies, Laetitia Marisa, Caroline Paccard, Gregory Nuel, and Mickael Guedj. Should we abandon the t-test in the analysis of gene e xpression microarray data: A comparison of variance modeling strategies. PLoS ONE , 5(9):e12336, 09 2010. [13] Minoru Kanehisa, Susumu Goto, Masahiro Hattori, Kiyok o F Aoki-Kinoshita, Masumi Itoh, Shuichi Kaw ashima, T oshiaki Katayama, Michihiro Araki, and Mika Hirakawa. From genomics to chemical genomics: ne w dev elop- ments in kegg. Nucleic Acids Res , 34(Database issue):D354–D357, Jan 2006. [14] Stuart A. Kauf fman. Metabolic stability and epigenesis in randomly constructed genetic nets. Journal of Theor etical Biolo gy , 22(3):437–467, March 1969. [15] Kasper Lage, E. Olof Karlberg, Zenia M Størling, Páll I Olason, Anders G Pedersen, Olga Rigina, Anders M Hinsby , Zeynep Tümer , Flemming Pociot, Niels T ommerup, Yves Moreau, and Søren Brunak. A human phenome- interactome network of protein complex es implicated in genetic disorders. Nat Biotec hnol , 25(3):309–316, Mar 2007. [16] Steffen L. Lauritzen. Graphical models . Clarendon Press, 1996. [17] Shoudan Liang, Stefanie Fuhrman, and Roland Somogyi. Reveal, a general re verse engineering algorithm for inference of genetic network architectures, 1998. [18] Cornelia Liedtke, Chafika Mazouni, K enneth R Hess, F abrice André, Attila T ordai, Jaime A Mejia, W . Fraser Symmans, Ana M Gonzalez-Angulo, Bryan Hennessy , Marjorie Green, Massimo Cristofanilli, Gabriel N Hortobagyi, and Lajos Pusztai. Response to neoadjuvant therap y and long-term survi val in patients with triple-negati ve breast cancer . J Clin Oncol , 26(8):1275–1281, Mar 2008. [19] Sach Mukherjee and T erence P Speed. Network inference using informativ e priors. Pr oc Natl Acad Sci U S A , 105(38):14313–14318, Sep 2008. [20] T orsten O Nielsen, Forrest D Hsu, Kristin Jensen, Maggie Cheang, Gamze Karaca, Zhiyuan Hu, Tina Hernandez- Boussard, Chad Li vasy , Dav e Co wan, L ynn Dressler, Lars A Akslen, Joseph Ragaz, Allen M Go wn, C. Blake Gilks, Matt van de Rijn, and Charles M Perou. Immunohistochemical and clinical characterization of the basal-like subtype of in v asiv e breast carcinoma. Clin Cancer Res , 10(16):5367–5374, Aug 2004. [21] M. Oti and H. G. Brunner . The modular nature of genetic diseases. Clin Genet , 71(1):1–11, Jan 2007. [22] M. Oti, B. Snel, M. A. Huynen, and H. G. Brunner . Predicting disease genes using protein-protein interactions. J Med Genet , 43(8):691–698, Aug 2006. Soumis au Journal de la Société Française de Statistique File: BBC.tex, compiled with jsfds, version : 2009/12/09 date: April 4, 2019 14 Jeanmougin, Guedj and Ambroise [23] Judea Pearl. Pr obabilistic reasoning in intellig ent systems : networks of plausible infer ence . Mor gan Kaufmann, September 1997. [24] Charles M. Perou, Therese Sorlie, Michael B. Eisen, Matt van de Rijn, Stefanie S. Jeffrey , Christian A. Rees, Jonathan R. Pollack, Douglas T . Ross, Hilde Johnsen, Lars A. Akslen, Oystein Fluge, Alexander Pergamen- schikov and Cheryl W illiams, Shirley X. Zhu, Per E. Lonning, Anne-Lise Borresen-Dale, Patrick O. Bro wn, and David Botstein. Molecular portraits of human breast tumours. Natur e , 406(6797):747–752, Aug 2000. [25] Elisabeth Remy and Paul Ruet. From minimal signed circuits to the dynamics of Boolean regulatory netw orks. Bioinformatics , 24(16):i220–i226, 2008. [26] Gordon K. Smyth. Linear models and empirical bayes methods for assessing differential e xpression in microarray experiments. Statistical applications in genetics and molecular biology , 3(1), 2004. [27] B. Snel, G. Lehmann, P . Bork, and M. A. Huynen. String: a web-server to retrie ve and display the repeatedly occurring neighbourhood of a gene. Nucleic Acids Res , 28(18):3442–3444, Sep 2000. [28] Therese Sorlie, Robert Tibshirani, Joel P arker , T rev or Hastie, J. S. Marron, Andrew Nobel, Shibing Deng, Hilde Johnsen, Robert Pesich, Stephanie Geisler , Janos Demeter , Charles M Perou, Per E Lønning, Patrick O Bro wn, Anne-Lise Børresen-Dale, and David Botstein. Repeated observation of breast tumor subtypes in independent gene expression data sets. Proc Natl Acad Sci U S A , 100(14):8418–8423, Jul 2003. [29] Christos Sotiriou, Soek-Y ing Neo, Lisa M. McShane, Edw ard L. K orn, Philip M. Long, Amir Jazaeri, Philippe Martiat, Stev e B. Fox, Adrian L. Harris, and Edison T . Liu. Breast cancer classification and prognosis based on gene expression profiles from a population-based study. Pr oceedings of the National Academy of Sciences of the United States of America , 100(18):10393–10398, 2003. [30] René Thomas. Boolean formalization of genetic control circuits. J ournal of Theor etical Biology , 42(3):563 – 585, 1973. [31] Hiroyuki T oh and Katsuhisa Horimoto. Inference of a genetic network by a combined approach of cluster analysis and graphical gaussian modeling. Bioinformatics , 18:287–297, 2002. [32] Jean-Philippe V ert and Y oshihiro Y amanishi. Supervised graph inference. Advances in Neural Information Pr ocessing Systems , pages 1433–1440, 2005. [33] Adriano V . W erhli, Marco Grzegorczyk, and Dirk Husmeier . Comparati ve e valuation of re verse engineering gene regulatory networks with rele v ance networks, graphical gaussian models and bayesian networks. Bioinformatics , 22(20):2523–2531, 2006. [34] Joe Whittaker . Graphical Models in Applied Multivariate Statistics (Wile y Series in Probability & Statistics) . John W iley & Sons, March 1990. [35] Y oshihiro Y amanishi, Jean-Philippe. V ert, and Minoru Kanehisa. Protein network inference from multiple genomic data: a supervised approach. Bioinformatics , 20 Suppl 1:i363–i370, Aug 2004. Soumis au Journal de la Société Française de Statistique File: BBC.tex, compiled with jsfds, version : 2009/12/09 date: April 4, 2019
Original Paper
Loading high-quality paper...
Comments & Academic Discussion
Loading comments...
Leave a Comment