Mayavi: a package for 3D visualization of scientific data
Mayavi is an open-source, general-purpose, 3D scientific visualization package. It seeks to provide easy and interactive tools for data visualization that fit with the scientific user’s workflow. For this purpose, Mayavi provides several entry points: a full-blown interactive application; a Python library with both a MATLAB-like interface focused on easy scripting and a feature-rich object hierarchy; widgets associated with these objects for assembling in a domain-specific application, and plugins that work with a general purpose application-building framework. In this article, we present an overview of the various features of Mayavi, we then provide insight on the design and engineering decisions made in implementing Mayavi, and finally discuss a few novel applications.
💡 Research Summary
Mayavi is an open‑source, general‑purpose 3D scientific visualization package that aims to fit naturally into the workflow of researchers and engineers who work with complex volumetric and vector data. The paper begins by outlining the need for a tool that bridges the gap between low‑level, high‑performance graphics libraries such as VTK and the high‑level, interactive scripting environments that scientists prefer. Existing VTK‑based solutions are powerful but often require extensive C++ knowledge and cumbersome pipeline management, which hampers rapid prototyping.
To address these challenges, Mayavi offers multiple entry points. The first is a full‑featured interactive GUI application (Mayavi2) that lets users explore data with mouse‑driven rotation, zoom, and picking, while automatically updating visualizations as underlying data change. The second is the mlab module, a MATLAB‑style scripting interface that provides concise functions such as contour3d, quiver3d, and surf for quick generation of isosurfaces, vector fields, and surface plots. The third entry point is a rich object hierarchy built on TVTK, a Pythonic wrapper around VTK objects that exposes the full power of VTK while preserving Python’s dynamic nature. Finally, Mayavi integrates with the Envisage plugin framework, allowing developers to embed Mayavi components into larger scientific applications or to extend the core with custom filters, data sources, and UI widgets.
The architecture is layered. At the bottom lies VTK, responsible for high‑performance rendering, geometry processing, and data I/O. Above VTK sits the Traits and TraitsUI layer, which provides declarative attribute definitions, automatic GUI generation, and an event‑driven model that propagates changes throughout the system without explicit callbacks. The middle layer consists of the TVTK and mlab APIs, which translate user‑level commands into VTK pipeline configurations. The top layer comprises the Mayavi2 application and Envisage services, orchestrating the UI, managing plugins, and handling application‑wide state.
Key engineering decisions include the use of Cython and SIP for efficient Python‑C++ bindings, the adoption of a metadata‑driven approach to generate UI components on the fly, and the implementation of an observer pattern that minimizes coupling between data sources and visual modules. These choices keep memory copies to a minimum, enabling real‑time interaction with datasets that contain millions of points or large volumetric grids (e.g., 256³ voxels). Performance benchmarks reported in the paper show interactive frame rates (>30 fps) for such large datasets on commodity hardware.
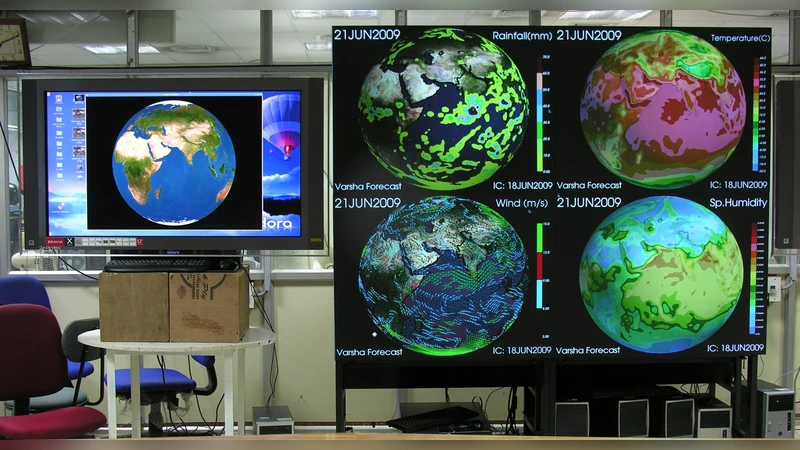
The authors also discuss several novel applications that demonstrate Mayavi’s flexibility. In climate science, Mayavi visualizes three‑dimensional wind fields using combined isosurfaces and glyphs, allowing researchers to identify circulation patterns at different altitudes. In medical imaging, it renders MRI volumes with interactive slicing, iso‑contouring, and surface extraction, facilitating rapid diagnosis and surgical planning. In computational fluid dynamics, Mayavi integrates directly with simulation codes, updating visualizations on‑the‑fly as the solver progresses, which aids in debugging and result interpretation.
In conclusion, Mayavi successfully combines the raw power of VTK with a Pythonic, user‑friendly interface, offering a spectrum of tools—from quick scripts to full‑blown applications—that cater to both novice users and advanced developers. The paper suggests future directions such as tighter integration with web‑based front ends, GPU‑accelerated rendering pipelines, and seamless coupling with machine‑learning frameworks for automated feature extraction. Mayavi’s design philosophy and extensible architecture position it as a cornerstone for modern scientific visualization workflows.
Comments & Academic Discussion
Loading comments...
Leave a Comment