Zonas costeras bajas en el Golfo de Mexico ante el incremento del nivel del mar
This paper presents an estimate of the land area affected in the event of sea level rise of 0.6 m, 1 m and 2 m for Mexican sates with coasts along Gulf of Mexico. Likewise, the number of residents in vulnerable areas that would occur in the scenario of sea level rise of 1 m is estimated. To do so, terrain elevation data of NASA’s Shuttle Radar Topography Mission is used, along with a proprietary algorithm that allows the reconstruction of the affected area. In order to estimate the land area digital image processing is used. These results are geo-referenced for comparison with human settlements in the regions of interest. Results show that the total affected area corresponds to 1.26% of Mexico national territorial extension and 3.18% of the Mexico total population. 174 settlements with 1000 inhabitants or more are expected to be affected. The Mexican state with the largest area affected is Tabasco with more than 21% of its territory, while the most vulnerable population will be Veracruz, with more than 1 million people at risk if the scenario 1m increase would appear today. Meanwhile, 81.1% Quintana Roo population will be at zones with high flood risk. Vulnerable settlements are listed and the maps corresponding to different Mexican states are shown.
💡 Research Summary
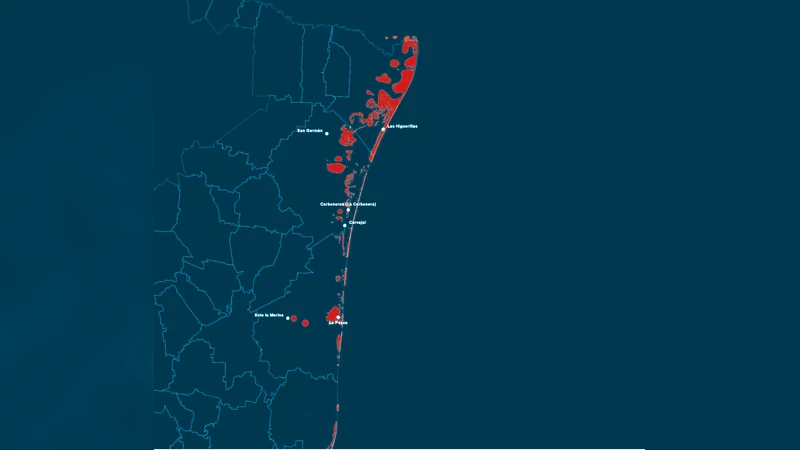
This study quantifies the coastal vulnerability of the Mexican Gulf basin under three sea‑level rise (SLR) scenarios: 0.6 m, 1 m, and 2 m. Using freely available Shuttle Radar Topography Mission (SRTM) digital elevation models (30 m resolution, ~100 m sampling), the authors develop a proprietary algorithm that first binarizes all pixels whose elevation is below the target rise, then applies a two‑dimensional Gaussian convolution (radius ≈ 1 km) via Fourier transforms to generate continuous inundation polygons. The resulting raster is exported as KML for visualization in GIS platforms (WorldWind, Google Earth).
Population exposure is assessed by intersecting the inundation layers with 2005 INEGI census data for the seven Gulf‑coastal states (Tamaulipas, Veracruz, Tabasco, Campeche, Yucatán, Quintana Roo, and the state of “Quintana Roo” – a typographical duplication in the original). For the 1 m scenario, the authors compute the number of people living within the flooded zones and identify all settlements with ≥1,000 inhabitants that intersect the risk area, yielding a total of 174 vulnerable localities.
Key findings: the total inundated area corresponds to 1.26 % of Mexico’s landmass (≈41 000 km²) and affects 3.18 % of the national population (≈3.29 million people). Tabasco experiences the greatest proportional land loss (21–26 % of its territory), while Veracruz hosts the largest at‑risk population (≈1 million people, 14 % of its residents). Quintana Roo is especially vulnerable, with 81 % of its inhabitants located in high‑risk flood zones. Population density within the flooded zones varies markedly: Quintana Roo (≈23 000 people km⁻²) and Campeche (≈19 000 people km⁻²) show the highest densities, whereas Tabasco and Yucatán have lower densities but larger absolute numbers of affected settlements.
Method validation was performed by comparing the results with those obtained from the University of Arizona’s Sea‑Level Rise mapping tool. For most states the discrepancy is ≤3 %, confirming the robustness of the custom algorithm. Larger differences for Tabasco and Campeche are attributed to radar‑derived DEM errors in vegetated or permanently inundated low‑lying areas, where radar backscatter can misrepresent true ground elevation.
The paper discusses limitations, notably the reliance on 2005 census data (which may under‑represent recent demographic shifts) and the inherent uncertainties of radar‑based DEMs in coastal wetlands. The authors recommend future work incorporating higher‑resolution LiDAR DEMs, updated population datasets, and socioeconomic vulnerability indices to produce a more comprehensive risk assessment.
Overall, the research provides a low‑cost, reproducible workflow for mapping SLR‑induced coastal inundation and linking it to demographic exposure. The results are directly applicable for regional planners, disaster‑risk managers, and policymakers seeking science‑based guidance for mitigation, relocation, and infrastructure investment in the Gulf of Mexico coastal zone.
Comments & Academic Discussion
Loading comments...
Leave a Comment