The semantic mapping of words and co-words in contexts
Meaning can be generated when information is related at a systemic level. Such a system can be an observer, but also a discourse, for example, operationalized as a set of documents. The measurement of semantics as similarity in patterns (correlations) and latent variables (factor analysis) has been enhanced by computer techniques and the use of statistics; for example, in “Latent Semantic Analysis”. This communication provides an introduction, an example, pointers to relevant software, and summarizes the choices that can be made by the analyst. Visualization (“semantic mapping”) is thus made more accessible.
💡 Research Summary
The paper proposes a systematic approach to generate and visualize meaning by treating a collection of documents as an observable system. It begins by framing meaning as an emergent property when information is related at a systemic level, where the system can be a human observer or, more concretely, a discourse represented by a set of texts. Within this framework, the authors argue that the relationships among words and co‑words can be quantified using two complementary statistical perspectives: similarity in observable patterns (correlation analysis) and latent structures (factor analysis or related dimensionality‑reduction techniques).
The methodological core consists of constructing a word‑document matrix from a corpus, applying appropriate weighting (e.g., TF‑IDF, log‑entropy, BM25) and preprocessing steps (stop‑word removal, stemming, minimum frequency thresholds) to mitigate sparsity and frequency bias. Once the matrix is prepared, the authors compute pairwise similarity measures—Pearson, Spearman, or point‑wise mutual information—producing a correlation matrix that captures direct co‑occurrence patterns. To uncover deeper, hidden semantic dimensions, they apply factor analysis, principal component analysis (PCA), singular value decomposition (SVD), or non‑linear embeddings such as t‑SNE and UMAP. The number of latent factors is determined through scree plots, eigenvalue criteria, or cross‑validation, and factor rotation (varimax or promax) is used to enhance interpretability.
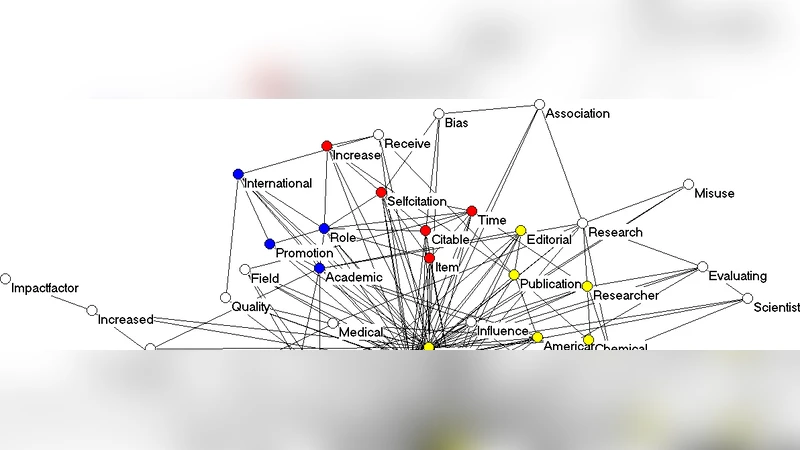
An empirical example illustrates the workflow on a scientific literature corpus of roughly 5,000 articles. After extracting about 2,000 unique terms from titles, abstracts, and keywords, the authors reduce the term set via preprocessing, then calculate a correlation matrix and extract six meaningful factors. Each factor corresponds to a coherent research theme (e.g., nanomaterials, artificial intelligence, environmental policy). The latent factor scores are then visualized as a semantic map using tools such as VOSviewer and Gephi. In the visualizations, node size reflects term frequency, node color encodes factor membership, and edge thickness represents the absolute value of the correlation coefficient. The resulting map shows tight clusters for intra‑theme terms and bridging edges for interdisciplinary terms, providing an intuitive overview of the discourse structure.
The paper also enumerates the analyst’s decision points: (1) choice of weighting scheme for the word‑document matrix; (2) selection of similarity metric; (3) selection of dimensionality‑reduction technique (linear vs. non‑linear); (4) factor extraction and rotation method; (5) visualization parameters (layout algorithm, color palette, label density). The authors stress that these choices have substantial impact on the final semantic representation and must be aligned with the research question.
In conclusion, the authors demonstrate that semantic mapping—combining pattern‑based similarity with latent‑variable modeling—offers a richer, more nuanced view of textual corpora than simple frequency analysis. The availability of open‑source software (R packages like FactoMineR, Python’s scikit‑learn, and dedicated network visualizers) democratizes the technique, allowing scholars without deep computational backgrounds to construct and explore meaning networks. The paper suggests future extensions such as dynamic semantic mapping over time, cross‑lingual semantic alignment, and integration of semantic networks with citation or collaboration networks to build comprehensive models of scientific discourse.
Comments & Academic Discussion
Loading comments...
Leave a Comment