Liquid chromatography mass spectrometry-based proteomics: Biological and technological aspects
Mass spectrometry-based proteomics has become the tool of choice for identifying and quantifying the proteome of an organism. Though recent years have seen a tremendous improvement in instrument performance and the computational tools used, significa…
Authors: Yuliya V. Karpievitch, Ashoka D. Polpitiya, Gordon A. Anderson
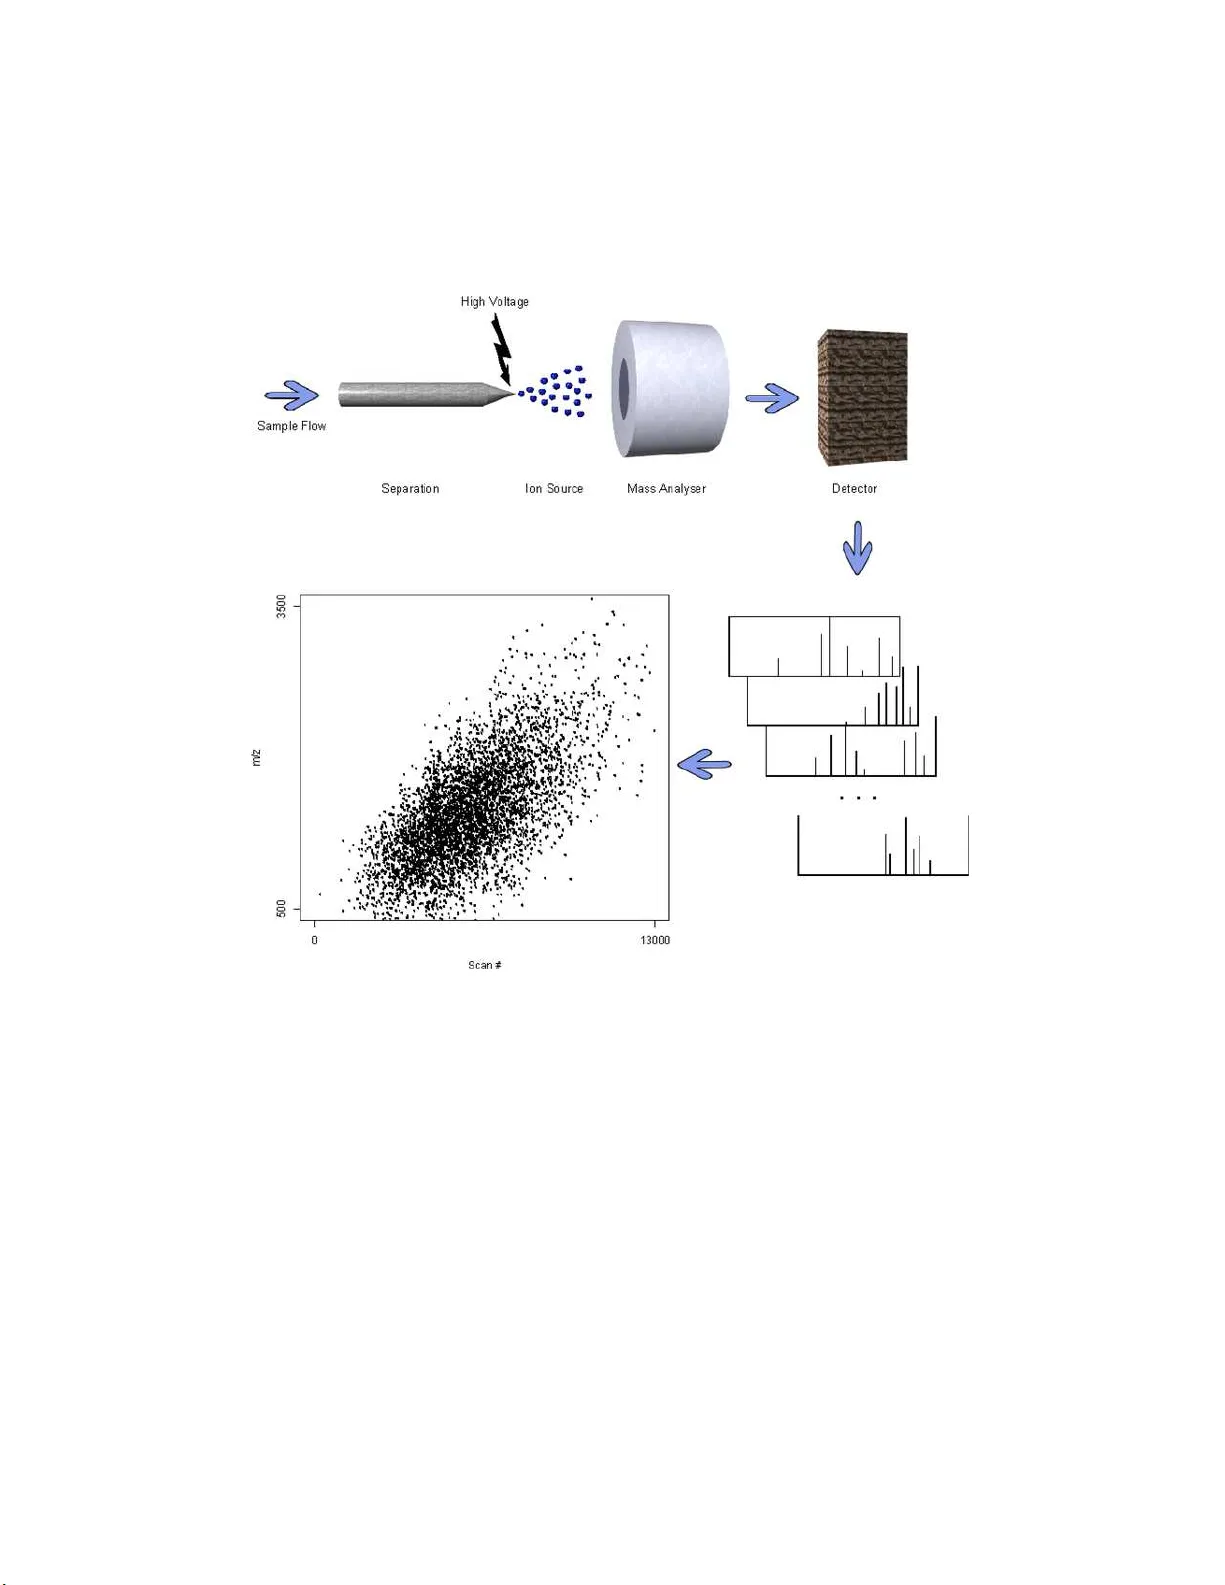
The Annals of Applie d Statistics 2010, V ol. 4, No. 4, 1797–182 3 DOI: 10.1214 /10-A OAS341 c Institute of Mathematical Statistics , 2 010 LIQUID CHR OMA T OGRAPHY MASS S PECTR OMETR Y-BASED PR OTEOMICS: BIOLOGICAL AND TECHNOLOGICAL ASPECTS 1 By Yuliy a V. Karpievitch, Ashoka D. Polpitiy a, Gordon A. Anderson , Richard D. Smith and Alan R. D abn ey Pacific Northwest National L ab or a tory, Pacific Northwest National L ab or atory, Pacific N orthwest N ational L ab or atory, Pacific Northwest National L ab or atory and T e xas A&M University Mass sp ectrometry -based proteomics h as b ecome t he tool of choic e for identifying and q uantif y ing the proteome of an organism. Though recent years hav e seen a tremendous improv ement in instrument p er- formance and the computational to ols u sed, significant chall enges remain, and there are many opp ortunities for statisticians to make imp ortant contributions. In the most widely used “b ottom-up” ap - proac h to proteomics, complex mixtures of proteins are fi rst sub - jected to enzymatic clea va ge, the resulting p eptide p rodu cts are sep- arated based on chemica l or physical properties and analyzed u sing a mass spectrometer. The tw o fund amental challenges in the analy- sis of b ottom-up MS- b ased proteomics are as follo ws: ( 1) Identifying the p roteins th at are present in a sample, and (2) Q uantif ying the abundance levels of the identified proteins. Both of these challenges require knowl edge of th e biologi cal and tec h nological context that giv es rise to observed data, as well as the app lication of sound statis- tical principles for estimation and inference. W e present an ov erview of b ottom-u p proteomics and outline t he key statistical issues that arise in protein identificatio n and qu an tification. 1. In tro du ction. The 1990s mark ed the emergence of genome sequenc- ing and d eo xyrib onucleic acid (DNA) microarra y technolog ies, giving r ise to Received May 2009; revised F ebruary 2010. 1 P ortions of this work w ere supp orted by the NIH R25-CA-90301 training gran t in biostatistics and bioinformatics at T AMU, t h e National Institute of Allergy and Infectious Disease NIH/DH H S t h rough in teragency agreemen t Y1-AI -4894-01, National Cen t er for Researc h Resources (NCRR) gran t R R 18522, and were p erformed in the Environmen tal Molecular Science Laboratory , a United S tates Department of Energy (DOE) national scien tific user facilit y at Pacific Northw est National Lab oratory ( PNNL) in Ric hland, W A. PNNL is op erated for the DO E Battelle Memorial Institute u n der contract DE- AC0 5-76RLO01830. Key wor ds and phr ases. LC-MS proteomics, statistics. This is an electronic reprint of the original ar ticle published by the Institute of Mathematical Statistics in The Annals of Applie d Statistics , 2010, V ol. 4, No. 4, 179 7–182 3 . This reprint differs from the original in pa gination and typogr aphic deta il. 1 2 Y. V . KARPIEVI TCH ET AL. the “-omics” era of researc h. Proteomics is the logica l con tinuation of the widely-used transcriptional p rofiling metho dology [Wilkins et al. ( 1996 )]. Proteomics inv olv es the study of m u ltiprotein systems in an organism, the complete protein complement of its genome, with the aim of un d erstanding distinct proteins and th eir roles as a part of a larger net work ed system. Th is is a vital comp onen t of mo d er n systems biology approac hes, where the goal is to c haracterize the sys tem b eh a vior rather than the b eha vior of a single comp onen t. Measuring messenger rib on u cleic acid (mRNA) lev els as in DNA microarra ys alone do es not necessarily tell us muc h ab out the level s of cor- resp ondin g proteins in a cell and th eir regulatory b eha vior, since p roteins are su b jected to many p ost-translational mo difi cations and other mo d ifi- cations by environmen tal agen ts. Proteins are r esp onsible f or the structure, energy p ro duction, comm un ications, mo vemen ts and d ivision of all cells, and are th u s extremely imp ortan t to a comprehensiv e u nderstanding of systems biology . While genome-wide m icroarra ys are ubiqu itous, pr oteins do not share th e same hybridization prop erties of nucleic acids. In particular, interroga ting man y proteins at the same time is difficult d ue to the need for ha ving an an tib o dy dev elop ed f or eac h pr otein, as well as the different binding con- ditions optimal for the proteins to bind to their corresp onding an tib o d ies. Protein m icroarrays are thus not w id ely used for wh ole proteome screen- ing. Two -dimensional gel electrophoresis (2-DE) can b e used in differential expression studies by comparing staining patterns of d ifferen t gels. Qu an ti- tation of proteins u sing 2-DE has b een limited du e to the lac k of robust and repro du cible metho ds for detecting, m atc hing and quan tifying sp ots as well as some physical prop erties of the gels [Ong and Mann ( 2005 )]. Although efforts hav e b een made to pro vide metho d s for sp ot detection and quan tifi- cation [Morris, C lark and Gutstein ( 2008 )], 2-DE is not currentl y the most widely-used tec hnology for protein quant itation in complex mixtures. Mean- while, mass sp ectrometry (MS) has p ro ven effectiv e for the charact erization of p r oteins and for the analysis of complex protein samples [Nesvizhskii, Vitek and Aeb ersold ( 2007 )]. Sev eral MS metho d s f or interroga ting the pro- teome hav e b een d evelo p ed: Surface Enh anced Laser Desorption Ionization (SELDI) [T ang, T ornatore and W ein b erger ( 2004 )], Matrix Assisted Laser Desorption Ionizatio n (MALDI) [Karas et al. ( 198 7 )] coupled with time-of- fligh t (TOF) or other ins tr umen ts, and gas c h romatograph y MS (GC-MS) or liquid c hromatograph y MS (LC-MS). SELDI and MALDI do not incor- p orate onlin e separation dur ing MS analysis, th u s, sep aration of complex mixtures needs to b e p erform ed b eforehand. MALDI is widely us ed in tissu e imaging [Cap r ioli, F armer and Gile ( 1997 ); Cornett et al. ( 200 7 ); Sto ec kli et al. ( 2001 )]. GS-MS or LC-MS allo w for online separation of complex sam- ples and th u s are m uch more widely used in h igh-throughput qu an titativ e MASS S PECTR OMETR Y-BASED PROTEOMICS 3 Fig. 1. Ove rview of LC-MS-b ase d pr ote omics. Pr oteins ar e extr acte d f r om biol o gic al sam- ples, then digeste d and ioni ze d prior to intr o duction to the mass sp e ctr ometer. Each MS sc an r esults in a mass sp e ctrum, me asuring m/z values and p e ak intensities. B ase d on observe d sp e ctr al i nformation, datab ase se ar ching is typic al ly employe d to identify the p ep- tides most l ikely r esp onsible for high-abundanc e p e aks. Final ly, p eptide information is r ol le d up to the pr otein level, and pr otein abundanc e is quantifie d using ei ther p e ak intensities or sp e ctr al c ounts. Fig. 2. Sample pr ep ar ation. Complex biolo gic al samples ar e first pr o c esse d to extr act pr oteins. Pr oteins ar e typic al ly f r actionate d to eli minate high-abundanc e pr oteins or other pr oteins that ar e not of inter est. The r emaining pr oteins ar e then digeste d into p eptides, which ar e c ommonly intr o duc e d to a l i quid chr omato gr aphy c olumn for sep ar ation. Up on eluting fr om the LC c ol umn, p eptides ar e ionize d. 4 Y. V . KARPIEVI TCH ET AL. Fig. 3. Mass sp e ctr ometry. The mass sp e ctr ometer c onsists of an ion sour c e, r esp onsible for i onizing p eptides, the mass analyzer and the dete ctor, r esp onsible for r e c or ding m/z values and intensities, r esp e ctively, for e ach ion sp e cies. Each MS sc an r esults in a m ass sp e ctrum, and a si ngle sample may b e subje cte d to thousands of sc ans. proteomics. Here we fo cu s on the most widely-used “b ottom-up” approac h to MS-based proteomics, LC-MS. In LC-MS-b ased proteomics, complex mixtures of proteins are fi rst sub - jected to enzymatic clea v age, then the resulting p eptide pr o ducts are an- alyzed usin g a mass sp ectrometer; this is in contrast to “to p-do w n” pro- teomics, whic h deals with in tact pr oteins and is limited to s imple pr otein mixtures [Han, Aslanian and Y ates ( 2008 )]. A stand ard b ottom-up exp er - imen t has the f ollo wing key steps (Figures 1 – 3 ): (a) extractio n of proteins from a sample, (b) fractionation to remo ve con taminan ts and proteins that are not of in terest, esp ecially high abu n dance house-k eeping pr oteins that are not usu ally indicativ e of the disease b eing studied, (c) d igestion of proteins MASS S PECTR OMETR Y-BASED PROTEOMICS 5 Fig. 4. Data ac quisition: ( a ) Sc an numb ers and m/z values for an example r aw LC-MS data set. Each i ndividual sc an c ontains a single mass sp e ctrum. ( b ) The mass sp e ctrum for sc an 5338. ( c ) A zo ome d-in l o ok at the sc ans 5275–5400 in m/z r ange 753–755.5. The cluster of dots i s indic ative of a single LC-MS “fe atur e.” ( d ) The i sotopic distribution for this fe atur e i n sc an 5280. Pe aks ar e sep ar ate d by appr oximately 1 / 3 , indic ating a char ge state of +3 . The monoisotopic mass is thus 753 . 36 × 3 = 2260 . 08 Da. ( e ) The elution pr ofile at m/z 753.36. in to p eptides, (d) p ost-digestion separations to obtain a more homogeneous mixture of p eptides, and (e) analysis b y MS. The tw o fun damen tal c hallenges in the analysis of MS-based pr oteomics data are then the ident ification of the p roteins presen t in a samp le, and the qu an tification of the abu n dance lev els of th ose proteins. T here are a h ost of informatics tasks asso ciated with eac h of these challenge s (Figures 4 – 6 ). The first step in protein id entificatio n is the iden tification of the con- stituen t p eptid es. Th is is carried out by comparin g observ ed features to 6 Y. V . KARPIEVI TCH ET AL. Fig. 5. Pr otein i dentific ation. Peptide and pr otein identific ation is most c ommonly ac- c omplishe d by m atching observe d sp e ctr al me asur ements to the or etic al or pr eviously-ob- serve d me asur ements in a datab ase. In LC -MS/MS, me asur ements c onsist of f r agmenta- tion sp e ctr a, wher e as mass and elution time alone ar e use d in hi gh-r esolution LC-MS. Onc e a b est m atch is found, one of the fol lowing metho ds f or assessing c onfidenc e in the match is employe d: de c oy datab ase s, empiric al Bayes, or “exp e ctation values.” en tries in a database of theoretical or previously iden tified p eptides (Figure 5 ). In tandem mass sp ectrometry (denoted by MS/MS), a paren t ion p ossi- bly corresp ond ing to a p eptide is selected in MS 1 for furth er fr agmenta tion in MS 2 . Resulting fragmen tation sp ectra are compared to fragmen tation sp ectra in a database, using soft ware lik e SEQUEST [Eng, McCormack and Y ates ( 1994 )], Masco t [P er k in s et al. ( 1999 )] or X!T and em Alternativ ely , high-resolution MS in strument s can b e used to obtain extremely accurate mass measurements, and th ese can b e compared to mass m easuremen ts in a database of p eptides previously iden tified w ith high confid en ce via MS/MS [P asa-T olic et al. ( 2004 )] us ing the s ame soft w are to ols ab o v e. In either case, a statistical assessmen t of the p eptide iden tification confidence lev el is de- sired. Protein iden tification can b e carried out b y rolling up p eptide-lev el iden tifi cation confid ence lev els to th e protein lev el, a pro cess that is asso ci- ated with a host of issu es and complexities [Nesvizhskii et al. ( 2003 )]. The goal of the iden tification pro cess is generally to iden tify as many proteins as p ossible, wh ile con trolling th e num b er of false iden tifications at a tolerable lev el. T here are a myriad of options f or the exact id en tification metho d u s ed, including (i) the c hoice of a statistic for scoring the similarit y b etw een an MASS S PECTR OMETR Y-BASED PROTEOMICS 7 Fig. 6. Pr otein quantitation. The left p anel shows the pr op ortion of mi ssing values in an example data set as a function of the me an of the observe d intensities for e ach p ep- tide. Ther e is a str ong inverse r elationship b etwe en these, suggesting that many missing intensities have b e en c ensor e d. The right p anel shows an example pr otein found to b e dif- fer ential l y expr ess e d in a two-class human study. The pr otein had 6 p eptides that wer e identifie d, although two wer e filter e d out due to to o many mi ssing values (p eptides 1 and 2, as indic ate d by the vertic al shade d lines). Estimate d pr otein abundanc es and c onfidenc e intervals ar e c onstructe d fr om the p eptide-level intensities by a c ensor e d li keliho o d mo del [Karpievitch et al. ( 2009a )]. observ ed sp ectral pattern and a database en try [Craig and Bea vis ( 2004 ); P erkin s et al. ( 1999 )], and (ii) the c hoice of ho w to mo d el the n u ll distri- bution of the s im ilarity metric [Elias and Gygi ( 2007 ); Keller et al. ( 2002 )]. Tw o other m etho d s of pr otein identifica tion exist: de n ov o and h y b rids of de n o v o and database matc hing. This is further explained in Section 5 . In qu antitat ion exp erimen ts, pr otein abundances are inferred fr om the iden tifi ed p eptides. One of the most common and simplest metho ds is to coun t the num b er of times a p eptide has b een seen and accum ulate those coun ts for all the p eptides seen for a give n protein. This giv es a v alue that is prop ortional to th e abundance of the p rotein, that is, a more abundant p r o- tein would b e exp ected to ha ve p eptides that are obs er ved more often [Liu, Sadygo v and Y ates ( 2004 ); Zh ang et al. ( 2009 )]. A more accurate metho d for quan tifying the abun d ance of a p eptide is to calculat e the p eak volume (or area) across its elution profile usin g its extracted ion c hromatogram. Protein abundances are inf erred from the corresp ondin g p eptide abun dances (Figure 6 ). P eak capacit y is a f unction of the n umber of ions detected for a particu- lar p eptide, and is related to p eptide abu ndance [Old et al. ( 2005 )]. Pe ptide abundances can b e compu ted with or without the use of stable isotope la- b els [Gygi et al. ( 1999 ); W ang et al. ( 2003 )]. In the case of isotopic lab eled exp eriment s, usually a r atio of the p eak capacitie s of the t wo isotopically la- 8 Y. V . KARPIEVI TCH ET AL. b eled comp onents is r ep orted. Regardless of the sp ecific tec hnology used to quan tify p eptide abundances, statistical m o dels are required to roll p eptide- lev el abundance estimates u p to the protein lev el. Issues include widesp r ead missing data due to lo w-abund ance p eptides, m isiden tified p eptides, under- sampling of p eaks for fragment ation in MS/MS, and degenerate p eptides that map to multiple pr oteins, among others. This is further explained in Section 6 . The pu r p ose of this pap er is to pro vid e an accessible o verview of LC-MS- based proteomics. Our template for this pap er wa s a 2002 Biometrics pap er of similar fo cus in the DNA microarra y s etting [Nguyen et al. ( 2002 )]. It is our hop e that this, lik e the 2002 pap er for DNA microarra ys, will serve as an entry-point for more statisticians to join the exciting r esearc h that is ongoing in the field of LC-MS-based proteomics. 2. B asic biolog ical principles un derlying p roteomics. Proteins are the ma jor stru ctural and functional units of an y cell. Proteins consist of amino acids arranged in a linear sequence, which is then folded to make a fun c- tional protein. The sequence of amino acids in proteins is enco ded by genes stored in a DNA molecule. Th e transfer of information f r om genetic se- quence to p rotein in euk aryo tes pro ceeds by transcription and translation. In transcription, single-stranded mRNA repr esen tations of a gene are con- structed. The mRNA lea v es the nucleus and is pro cessed into p r otein by the rib osome in the translation step. T his information transfer, from DNA to mRNA to protein, is essential for cell viabilit y and fu nction. In genomic studies, microarra y exp eriments measure gene expression level s by measur- ing th e transcrib ed mRNA abun dance. Such measurements can s h o w the absence, un d er- or o v er-expr ession of genes und er different cond itions. How- ev er, protein lev els do n ot alw a y s corresp ond to the mRNA lev els due to a v ariet y of factors s u c h as alternativ e splicing or p ost translational mo d ifica- tions (PTMs). Th u s, pr oteomics serves an imp ortan t role in a systems-lev el understand ing of biological systems. A three-n ucleotide sequence (co d on) of mRNA enco des for one amino acid in a protein. Th e genetic co de is said to b e de gener ate , as more than one co don can sp ecify the same amino acid. In th eory , mRNA could b e read in th ree different r eading frames pro ducing distinct pr oteins. In pr ac- tice, how ev er, most mRNAs are read in one r eading frame d u e to start and stop co don p ositions in the sequence. Th e raw p olyp eptide c hain (a c hain of amino acids constituting a protein) th at emerges from the rib osome is not y et a fu nctional protein, as it will need to fold into its 3-dimen s ional struc- ture. I n most organisms, prop er p rotein folding is assisted by pr oteins called c hap erones that stabilize the unfolded or partially folded proteins, preve nt- ing incorrect foldin g, as w ell as chaperonin s that directly facilitate folding. Misfolded proteins are d etected and either r efolded or degraded. Proteins MASS S PECTR OMETR Y-BASED PROTEOMICS 9 also u ndergo a v ariet y of PTMs, s u c h as p hosphorilation, u biquitination, meth ylation, acet ylation, glycosylation, etc., wh ic h are additions/remo v als of sp ecific chemica l group s. PTMs can alter th e function and activit y lev el of a protein and play imp ortan t roles in cellular regulation and resp onse to disease or cellular damage. A k ey c hallenge of proteomics is the h igh complexit y of the proteome du e to th e one-to-man y relationship b et wee n genes and proteins and the wide v ariet y of PTMs. F ur thermore, MS-based p roteomics do es n ot h a ve the b en- efit of prob e-dir ected assa y s like those u sed in microarrays. Although protein arra ys are a v ailable, they (a) are c h allenging to d esign and implemen t and (b) are n ot well su ited for protein disco very , and are thus not as widely used as MS-based tec h nologies [Nesvizhskii, Vitek and Aeb ersold ( 2007 )]. Sev eral steps are in vo lv ed in pr eparing samples for MS , s uc h as protein extraction, fractionation, digestion, separation and ionization, and eac h contributes to the o verall v ariation observ ed in p roteomics data. I n addition, tec hnical fac- tors lik e day-to -d a y and ru n-to-run v ariation in the complex exp erimen tal equipment can create systematic b iases in the data-acquisition stage. 3. E xp eriment al pro cedure. A LC-MS-based proteomic exp erimen t re- quires sev eral steps of sample pr eparation (Figure 2 ), in cluding cell lysis to break cells apart, protein separation to spread out the collect ion of pro- teins into more h omogenous groups, and protein digestion to break inta ct proteins into more manageable p eptide comp onents. Once this is complete, p eptides are fur ther separated, then ionized and in tro du ced in to the mass sp ectrometer. 3.1. Sample pr ep a r ation. Analysis of th e complete cell p roteome usually in volv es collecting in tact cells, w ashing them and adding a lysate buffer, con taining a com b ination of c h emicals that break the cell mem brane and protease inhibitors that p r ev ent p rotein degradation. Cells are h omogenized and incub ated with the b uffer, after whic h cen trifugation is used to separate the cellular deb r is and mem br ane from the su p ernatant , or cell lysate. The cell lysis step is unn ecessary when analyzing b o dily fl uids su c h as blo o d serum. Blo o d samples are cen trif u ged, after whic h red blo o d cells p ellet at the b ottom of the tub e, and plasma is collected at the top. Fibrinogen and other clotting factors are remo ved to obtain seru m. High abu ndance proteins are also remov ed, as usu ally they d o n ot pla y a role in disease. If some of the high abundance proteins are n ot r emov ed, they ma y domin ate sp ectral features and obscure less abund an t proteins of int erest. In LC-MS/MS, for example, the most abundant p eptides are selecte d in the fir st MS step for further fragmenta tion in the follo wing MS step, and only p eptides selected for furth er fragmen tation ha v e a c hance to b e ident ified; s ee Section 3.2 for more details. 10 Y. V . KARPIEVI TCH ET AL. Because of the complexity of the proteome, s ep aration steps are emplo y ed to sp read out the proteins according to different c h emical or physical c har- acteristics, making it easier to observe a greater num b er of proteins in more detail. At the protein lev el, t w o-dimens ional gel electrophoresis (2-DE) is often used to separate on the basis of b oth iso electric p oint and mass [Berth et al. ( 2007 ); Gorg, W eiss and Dun n ( 2004 )]. Proteins in th e gel can b e stained and extracted. Analyzing eac h stained region of the gel s eparately , for examp le, wo uld allo w for more d etailed assessment of th e total collect ion of pr oteins in the sample than if all p roteins were analyzed at once. On e of the main sources of err or in the gel analysis is unequ al pr ecipitation of the proteins b et ween gels. Thus, horizon tal or v ertical shifts and ev en diagonal stretc hing effects can b e seen in tw o-dimensional (2-D) gels, necessitating alignmen t of all the gels to a reference gel. After gel alignmen t, sp ot de- tection is p erformed whic h may in tro du ce fu rther errors; see Section 7.2 for more details. T o f acilitate protein iden tifi cation, pr oteins are usually clea v ed/digested c hemically or enzymatically int o fr agmen ts. Digestion ov ercomes many of the chall enges associated with the complex structural c h aracteristics of pr o- teins, as the r esulting p eptide f ragmen ts are more tractable c hemically , and their r educed size, compared to p roteins, make s them m ore amenable to MS analysis. As examples of d igestion agen ts, the trypsin enzyme clea v es at th e carb o xyl side of lysine and arginine residues, except when either is follo w ed by proline, while chemical cy anogen bromide (CNBr) clea v es at the carb o xyl site of methionine residu es; trypsin is the most commonly used di- gestiv e enzyme. Sp ecificit y of th e tr y p sin enzyme allo ws for the prediction of p eptide fragmen ts exp ected to b e pro d u ced by the enzyme and create theoretical d atabases. Enzymatic digestion of proteins could b e ac hieved in solution or gel, although digestion in solution is usually preferred, as gel is harder to separate f rom th e sample after digestion. Missed clea v ages can cause misidentified or missed p eptides w hen searc hed against the database. Database searches can b e adjusted to include one or more missed clea v ages, but such searc hes tak e longer to complete. Multiple distinct p eptides can hav e very similar or id en tical molecular masses and th us pro du ce a single in tense p eak in the initial MS (MS 1 ) sp ec- trum, making it difficult to id en tify the o verlapping p eptides. T he use of separation techniques n ot only increases the o ve rall dynamic range of mea- surements (i.e., the range of relativ e p eptide abundances) but also greatly re- duces the cases of coincident p eptide masses simultaneously in tr o duced in to the mass sp ectrometer. W e will describ e one of the m ost commonly used sep- aration tec hniques, high-p erformance liquid c hromatography (HPLC ), whic h is generally practiced in a capillary column format for proteomics. Other sep- aration techniques exist and are similar in that they separate based on some molecular p rop erties. MASS S PECTR OMETR Y-BASED PROTEOMICS 11 A HPLC system consists of a column pac k ed with n onp olar (h yd rophobic) b eads, referred to as the stationary ph ase, a pump that creates pressu re and mo ves the p olar mobile ph ase through the column and a detector that cap- tures the retentio n time. T he sample is dilu ted in the aqueous s olution and added to the mobile p hase. As the p eptides are push ed through the column, they bin d to the b eads p rop ortionally to th eir hydrophobic segments. Thus, h y d rophilic p ep tides will elute faster than hydrophobic p eptides. HPLC s ep - aration allo ws for th e in tro d uction of only a small sub set of p eptides eluting from the LC column at a particular time into the mass sp ectrometer. Pep- tides of similar molecular mass but d ifferen t hydrophobicit y elute from the LC column and en ter the mass sp ectrometer at differen t times, n o longer o ve rlapping in the in itial MS analysis. The additional time required for the LC separation is well wo rth the effort, as the reduction in the o v erlap of the p eptides of the same mass in MS 1 phase dramaticall y increases p eak reso- lution (and hence, p eak capacit y). Note th at LC columns must b e regularly replaced, and it is common to observe sys tematic differen ces in the elution times of similar samples on difference columns. Th us, replacing a column during an exp erimen t ma y con tribute to tec hn ical v ariation in th e r esulting observ ed abund ances b et ween t wo columns. F urther sep aration tec hniqu es includ e sample fractionation pr ior to HPLC, and complemen tary tec hn iques su c h as Ion Mobilit y S eparation (IMS) after HPLC. Multidimensional LC has b een successfully used to b etter separate p eptides. S tr ong cati on exchange (SCX) c h romatograph y is usu ally used as a fir st separation step and rev ersed-p h ase chromatog raphy (RPLC ) as a secondary separation step b ecause of its abilit y to remo ve salts and its com- patibilit y w ith MS through electrospra y ionization (ESI, d escrib ed b elo w) [Lee et al. ( 2006 ); Link et al. ( 1999 ); Peng et al. ( 2003 ); Sandr a et al. ( 2009 ); Sandra et al. ( 2008 )]. Combination of S CX with RPLC forms the basis of the Multidimensional Protein Identi fication T ec hnology (MudPIT ) appr oac h [W ash bu rn, W olters and Y ates ( 2001 ); W olters, W ash burn and Y ates ( 200 1 )]. While multidimensional LC is capable of achievi ng greater separation, it re- quires larger sample quan tities and more analysis time. In HPLC coupled with IMS, p eptides eluting fr om the HPLC system are ionized u sing ES I, and the ions are in jected in to a d rift tub e con taining neutral gas at cont rolled pressure. An electric fi eld is app lied, and th e ions separate b y colliding with the gas molecules. Larger ions exp erience more collisions with th e gas and tak e longer to tra vel through the dr if t tub e than smaller ions. IMS is v ery fast as compared w ith HPLC and , when used in conjunction with HPLC , ac hiev es b etter separation than HPL C alone. IMS is not enti rely orthogonal to HPLC, bu t it has b een shown to increase the p eak capacit y (num b er of detected p eaks) b y an order of magnitude [Belo v et al. ( 2007 )]. While not currentl y in wide use, IMS tec hn ologies are rapidly ev olving, and MS-based proteomics will lik ely in volv e m ultiple dimensions of separation based on 12 Y. V . KARPIEVI TCH ET AL. b oth IMS and HPLC in the near f uture. New algorithms will n eed to b e dev elop ed and existing ones mo dified to incorp orate th e extra separation dimensions. 3.2. Mass sp e ctr ometry. A mass sp ectrometer measures the mass-to- c harge ratio ( m/z ) of ionized molecules. Recen t y ears hav e seen a tremendous impro v ement in MS tec hnology , and there are ab out 20 different mass sp ec- trometers commercially av ailable for proteomics. All m ass sp ectrometers are designed to carry out the distinct fu nctions of ionizatio n and mass analysis. The key comp onen ts of a mass sp ectrometer are the ion source, mass ana- lyzer and ion detector (Figure 3 ). T he ion s ource is r esp onsible for assigning c harge to eac h p eptide. Mass analyzers tak e many different forms but ulti- mately measure the mass-to-c harge ( m/z ) ratio of eac h ion. The detector captures the ions and m easur es the in tensity of eac h ion sp ecies. In terms of a mass sp ectrum, the mass analyzer is resp onsible for the m/z in forma- tion on the x -axis, and the detector is resp onsible for the p eak in tensity information on the y -axis. Ionization metho d s in clude electron im p act, c hemical ionization, fast atom b om bardment, field d esorption, elec trospra y ionization (ES I) and laser des- orption, and they usu ally op erate by the ad d ition of p rotons to th e p eptides. ESI and matrix assisted laser desorption/ionization (MALDI) are the most widely used metho d s in proteomics. In the ES I metho d, the sample is pre- pared in liqu id form at atmosph er ic pr essure and flows into a v ery fine needle that is sub jected to a high v oltage. Due to the electrostatic repulsion, the solv ent dr ops lea ving the needle tip d isso ciate to form a fine spra y of highly c harged d roplets. As the solv ent ev ap orates, the droplets d isapp ear, lea ving highly c harged molecules. ESI is the most effectiv e in terface for LC-MS, as it naturally accommo dates p eptides in liquid solution. ES I is a soft ioniza- tion metho d, in th at it ac hiev es ionizat ion withou t breaking c hemical b onds and further fr agmen ting the p eptides. In MALDI analysis, the biologica l molecules are disp ersed in a crystalline matrix. A UV laser p u lse is then directed at the matrix, w h ic h causes the ionized molecules to eject so that they can b e extracted into a mass sp ectrometer. The mass analyzer is k ey to the sens itivit y , resolution and m ass accu- racy of an ins trumen t. Sensitivit y describ es an in s trumen t’s abilit y to detect lo w-abun d ance p eptides, r esolution to its abilit y to distinguish ions of very similar m/z v alues, and mass accuracy to its abilit y to obtain mass mea- surements that are v ery close to the truth . There are sev eral basic mass analyzer typ es: quadr up ole (Q), ion-trap (IT), time-of-fligh t (T O F), F our ier transform ion cyclotron resonance (FTICR), and the orb itrap. Different an- alyzers are commonly com bined to ac hiev e the b est utilization as a single mass sp ectrometer (e.g., Q-TOF, triple-Q). W e do not go in to the d etails of MASS S PECTR OMETR Y-BASED PROTEOMICS 13 the differen t mass analyzer t yp es; in terested readers are p oin ted elsewhere [Domon and Aeb ersold ( 2006 ); Siu zd ak ( 2003 )]. In tandem MS (referr ed to as MS/MS or MS n ), multiple rounds of MS are carried out on the same sample. This r esu lts in detailed signatures for detected f eatures, which can b e used for ident ification. Most MS/MS instru- men ts can automatically s elect seve r al of the most intense (high abundance) p eaks fr om a paren t MS (MS 1 ) scan and sub jects the corresp ondin g ions (precursor or parent ions ) for eac h to fur ther fragment ation, follo w ed b y further scans. This pro cess is rep eated un til all candidate p eaks of a par- en t scan are exhaus ted [Domon and Aeb ersold ( 2006 ); Zhang et al. ( 2005 )]. This results in a fragmenta tion pattern for eac h selected p eptide, pr o vid- ing detailed information on the c hemical mak eup of the p eptide. While the resulting fragmen tation patterns are the b asis for identificatio n , MS/MS suf- fers from undersamplin g, in th at relativ ely few (and generally only higher in tensity) precursor ions are selected for fragmen tation [Domon and Aeb er- sold ( 2006 ); Garza and Moini ( 2006 ); Zh ang et al. ( 2005 )]. The issu e of undersamp ling is not serious enough to steer a w a y from using MS n for pro- tein identificati on and quan titation, but r esearc hers should remember that not all p eptides w ill ha ve equal c hances of b eing selected for fragmen tation and th us ma y not b e observed in the subsequent MS scans. F u rthermore, MS/MS is time-in tensive and thus not alw ays ideal for high-throughp ut analysis [Masselon et al. ( 2008 )]. Nev ertheless, MS/MS is w idely used for quan titativ e MS-based proteomics and forms the b asis for most p eptide and protein id entificatio n pro cedures (Section 5 ). Typica lly , MS/MS is preceded b y LC separation and can more accurately b e d enoted by LC-MS/MS. High-resolution LC-MS in struments (e.g., FTIC R ) are v ery fast and can ac hiev e mass measurements that are suffi cien tly accurate for iden tification purp oses. F urth er m ore, since fragmen tation and r ep eated scans are not re- quired, the und ersampling issu es due to p eptide selection for MS/MS are a vo ided. S till, fragmen tation patterns are v aluable for iden tification, and so h y b rid platforms inv olving b oth LC-MS/MS and high-resolution LC-MS are increasingly b eing us ed . One suc h example is th e Accurate Mass and Time (AMT) tag approac h [Pasa -T olic et al. ( 2004 ); T olmac hev et al. ( 2008 ); Y anofsky et al. ( 2008 )]. In the AMT tag approac h, MS/MS analysis is used to create an AMT d atabase of p eptide theoretica l mass and p redicted elu- tion time, based on high-confidence id entificatio ns from fr agmenta tion pat- terns, follo wed by a sin gle MS r un on FTICR to obtain highly accurate mass measuremen ts, as w ell as liquid chromatog raphy elution times; p eptide iden- tification is then made b y comparing th e observ ed mass measuremen ts and elution times to the AMT database entries. W e note that an AMT database is t yp ically constructed using man y LC-MS/MS runs , resulting in a nearly complete d atabase of proteot ypic p eptid es [Mallic k et al. ( 2007 )]. Because in the AMT-based approac h LC -MS sp ectra are matc h ed to th e database 14 Y. V . KARPIEVI TCH ET AL. built from previous m ultiple MS/MS scans, the und ersampling asso ciated with LC-MS/MS on individu al samples is a voided. 4. D ata acquisition. In L C-MS, eac h samp le may give rise to thousand s of scans, eac h con taining a m ass sp ectrum [Figure 4 (a)]. T he mass sp ectrum for a single MS scan can b e su mmarized by a plot of m/z v alues v ersu s p eak in tensities [Figure 4 (b)]. Buried in these data are signals that are sp ecific to individual p eptides. As a fi rst step to ward identifying and quantifying those p eptides, features need to b e identified in the data and, for example, distinguished from backg round noise. The fir st step in this is MS p e ak dete c- tion . Man y ap p roac hes to p eak detection ha ve b een prop osed, as th is is an old pr oblem in th e field of signal pr o cessing. Our lab emplo ys a simple filter on the signal-to-noise ratio of a p eak relativ e to its lo cal bac kground [Jaitly et al. ( 2009 )]. Eac h p eptide giv es an env elop e of p eaks d ue to a p eptide’s con- stituen t amino acids. The pr esence of a p eptide can b e characte rized by the m/z v alue corresp ond ing to the p eak arising from the most common isotop e, referred to as the monoisotopic mass. While there are sev eral isotop es of the elemen ts that mak e up amino acids, 13 C is the most abun d an t, constituting ab out 1.11% of all carb on sp ecies. Since the mass difference b etw een 13 C and 12 C is appr o ximately 1 Da, the monoisotopic p eak for a p eptide will b e separated from an isotop e with a single 13 C b y appro ximately 1 /z , w here z is the c harge state of that p eptide. Similarly , isotop es with additional copies of 13 C will b e separated in units of app r o ximately 1 /z . [Figure 4 (d)]. The p ro cess of deisotoping a sp ectrum is often used to simplify the data b y remo ving the redund ant information from isotopic p eaks and in v olve s (i) lo cating isotopic distributions in a MS scan, (ii) computing the c harge state of eac h p eptid e based on the distance b et we en the p eaks in its isotopic d is- tribution, and (iii) extracting eac h p eptide’s monoisotopic mass. Note that this step is only p ossible if sufficientl y high-resolution mass measur ements ha ve b een obtained, as otherwise isotopic p eaks can not b e resolv ed. F or (i), detected p eaks are consider ed as p ossible mem b er s of an isotopic dis- tribution, an d theoretical isotopic distributions, derived from a database of p eptide sequ ences, are o verlai d with the observed sp ectra. A measure of fit is computed, and the p eaks are calle d an isotopic distribution if the fi t is go o d enough. One of the chall enges encountered in d eisotoping is the presence of o ve rlapping isotopic distrib utions from differen t p eptides. Th ere are man y algorithms a v ailable for p eak detection and deisotoping, includ ing commer- cial soft ware from vendors su c h as Agilent, Rosetta Biosoft ware and Thermo Fisher. Our lab uses Decon2LS [Jaitly et al. ( 2009 )], op en-sour ce soft ware that im p lemen ts a v ariation of the THRASH algorithm [Horn, Z ubarev and McLaffert y ( 2000 )]; the Decon2LS p ublication contai ns an extensiv e discus - sion of the ab o ve issu es, as we ll as man y helpful references for the inte rested reader. MASS S PECTR OMETR Y-BASED PROTEOMICS 15 A p eptide will like ly elute f rom the HPLC o v er multiple scans, creating an elution pr ofile [Figure 4 (e)]. Elution profiles for p eptides are typica lly relativ ely sh ort in du r ation, and serv e to define a fe atur e in LC-MS data sets. Ho wev er, there are often conta minan ts p resen t in an LC-MS sample with v ery long elution profiles, and these are fi ltered out in p repro cessing steps. V arious approac hes to summ arizing an elution profile are a v ailable. Our lab computes a normalized elution time (NET) [P etritis et al. ( 2006 )]. At this stage, an LC-MS sample has b een resolv ed into a list of LC-MS f eatures, eac h with an assigned monoisotopic mass and an elution time. How ev er, due to mass measurement errors and the rand om n atur e of elution times, (mass, elution time) assigned p airs w ill v ary b et we en L C-MS s amp les. Alignment is often p erformed to line up the LC -MS features in differen t samples. There are sev eral algorithms f or LC-MS alignmen t; examples in clude Crawdad [Finney et al. ( 2008 )] and LCMS W arp [Jaitly et al. ( 2006 )]. As with all h igh-throughput -omics tec hnologies, MS-based p roteomic data is t ypically sub jected to sub stan tial p repro cessing and normalizatio n. Systematic biases are often seen in mass measuremen ts, elution times and p eak intensitie s [Callister et al. ( 2006 ); Pet yuk et al. ( 2008 )]. Filtering of p o or-qualit y proteins and p eptides is also common [Karp ievitc h et al. ( 2009a )]. In normalization, care must b e taken to separate biological signal from tec hnical bias [Dabney and S torey ( 2006 )]. Widely-used n ormalizati on tec h- niques in high-throughput genomic or proteomic studies inv olv e some v ari- ation of global scaling, scatterplot smo othing or ANO V A [Quack en bu sh ( 2002 )]. Global scaling generally inv olv es shifting all the measur emen ts f or a s ingle sample b y a constan t amoun t, so that the means, medians or total ion currents (TICs) of all samples are equiv alen t. S ince common tec hn ical biases are more complex than simple s hifts b etw een samples, global scaling is un able to capture complex bias features. Scatterplot sm o othing, T I C and ANO V A normalization metho ds are sample-sp ecific and hence more flexi- ble. Ho wev er, more complex prepro cessing steps can result in o verfitting, causing errors in do w nstream inf erence. F or example, fitting a complex pre- pro cessing mo del ma y use up substantia l degrees of freedom, and analyzing the pro cessed data, assum ing that n o degrees of freedom ha ve b een u sed, ma y result in ov erly optimistic accuracy lev els and o v erestimated statistical significance; s p ecific examples can b e seen in Karp ievitc h et al. ( 2009b ). Ide- ally , pr epro cessing would b e carried out simulta neously with inference, or the do w nstream inferen tial steps w ould incorp orate kno wledge of what pre- pro cessing was d one [Leek and Storey ( 2007 )]. A recentl y prop osed m etho d , called EigenMS, remo v es bias of arbitrary complexit y by the use of the sin- gular v alue decomp osition to capture and remo ve biases from LC-MS p eak in tensity measurements [Karpievitc h et al. ( 2009b )]. EigenMS remo v es bi- ases of arbitrary complexit y and adju sts the normalized in tensities to correct 16 Y. V . KARPIEVI TCH ET AL. the p -v alues after normalization (ensurin g that n ull p -v alues are uniformly distributed). Mass sp ectrometer manufacturers h a ve develo p ed a v ariet y of pr opri- etary binary data formats to store in strument output. Examples include . b af (Bruk er), .R aw (Thermo) and .PKM (App lied Biosystems). Handling data in differen t proprietary form ats t ypically r equires corresp ond ing pro- prietary soft wa re, making it difficult to share datasets. S ev eral op en-source, XML-based v endor-ind ep endent data formats ha v e recen tly b een dev elop ed to add ress th is limitation: mzXML [Lin et al. ( 2005 ); P edr ioli et al. ( 2004 )], mzData [Orc h ard et al. ( 2007 )] and mzML [Deutsc h ( 200 8 ); Or chard et al. ( 2009 )]. mzML 1.0 w as released in June 2009 and is considered a merge of the b est of mzData and mzXML. The format can store sp ectral infor- mation, instrument information, instrument settings and data pr o cessing details. mzML also has extensions suc h as c hr omatograms and multi ple re- action monitoring (MRM) profile capture, and it no w r eplaces b oth mzData and mzXML. 5. Pr otein identificati on. I n b ottom-up pr oteomics protein identifica- tion is u sually accomplished b y firs t comparing observ ed MS features to a database of pr edicted or previously iden tified features (e.g., b y MS/MS or on the basis of p revious analysis of a w ell c haracterized sample, Figure 5 ). T he most widely-used approac h is tandem MS w ith d atabase searc h- ing [Nesvizhskii, Vitek and Aeb ersold ( 2007 )], in whic h p eptide fragmen ta- tion patterns are compared to theoretical patterns in a database using soft- w are lik e Sequest [En g, McCormac k and Y ates ( 1994 )], X!T andem [C raig and Bea vis ( 2004 )] and Mascot [Pe rkins et al. ( 1999 )]. With high-resolution LC-MS instruments, identificati ons can b e made on the basis of mass and elution time alone, or in conju nction with MS/MS fr agmen tation patterns [P asa-T olic et al. ( 2004 )]. Alternativ es to database-searc hin g in clude (i) de novo p eptide sequencing [Dancik et al. ( 1999 ); Johnson et al. ( 2005 ); L u and Chen ( 2003 ); Stand ing ( 2003 )] and (ii) hybrids of the de novo and database searc hing approac h es [F rank and P evzner ( 2005 ); Suny aev et al. ( 2003 ); T abb, Saraf and Y ates ( 2003 ); T anner et al. ( 2005 )]. F or detailed reviews of the database searc hing algorithms see Kapp and Sc h utz ( 2007 ), Nesvizhskii ( 2007 ), Nesvizhskii, Vitek and Aeb ersold ( 2007 ), S adygo v, Co- ciorv a and Y ates ( 2004 ) and Y ates ( 1998 ). In tandem MS, precursor ions for the most abundant p eaks in a scan are fragmen ted and scanned again. In collision-induced disso ciation (C I D), pre- cursor ions are f ragmen ted by collisio n with a neutral gas [Laskin and F u tr ell ( 2003 ); Pittenauer and Allmaier ( 2009 ); Sleno and V olmer ( 2004 ); W ells an d McLuc key ( 2005 )]. Su b sequen t MS analysis measures the m/z and intensit y of the fragmen t ions (pr o duct or daughte r ions), creating a fragmen tation pattern (Figure 5 ). CID usually leads to b - and y -ions through break age of MASS S PECTR OMETR Y-BASED PROTEOMICS 17 the amide b ond along the p eptide bac kb one. b -ions are formed w hen the c harge is retained b y the amino-terminal fragment, and y -ions are formed when c h arge is retained b y the carb oxy-te r minal fr agmen t. Breaks near the amino acids glutamic acid (E), aspartic acid (D) and proline (P) are more common, as w ell as breaking of the side-c hains [Sob ott et al. ( 2009 )]. Other fragmen tation patterns are p ossible, suc h as a -, c -, x - and z -types. Electron capture disso ciation (ECD) p ro duces c - and z -ions and leav es side-c hains in tact. The fr agmen tation pattern is like a fingerprint for a p eptide. It is a function of amino acid sequ ence and can therefore b e predicted. Th e ob- serv ed fragmen tation p attern should matc h well with its theoretical pattern, assuming that its p eptide s equence is includ ed in the search database. A search database is created by s p ecifying a list of p roteins exp ected to con tain an y proteins pr esen t in a sample. In h u man studies, for example, the complete kno w n pr oteome can b e sp ecified with a F AST A file, which can then b e used to create p eptide fr agmen t sequences by simula ting diges- tion with tryp sin. F or eac h resulting p eptide, a theoretical fragmen tation pattern is then created. F or details on p rotein d igestion and fr agmen tation see Siuzdak ( 2003 ). Sev eral soft w are programs are av ailable for d atabase matc hing (e.g., SEQUEST , X!T andem and Mascot). Eac h h as its o wn al- gorithm for assessing th e fit b et w een observed and theoretical sp ectra, and there can b e surprisin gly little o v er lap in th eir results [Searle, T urner and Nesvizhskii ( 2008 )]. Note that a correct matc h can only b e m ade if the cor- rect sequence is in the database in the first p lace. I f an organism’s genome is incomplete or has errors, this will not b e the case. F urthermore, b ecause of undersamp ling iss ues in MS/MS, only a s mall p ercent age of p eptides present in a s amp le w ill ev en b e considered f or iden tification. Th is is due to th e fact that only a small p ortion of h igher abundance p eaks (for example, the 10 most abundant p eaks) are selected from the sp ectra in the fi rst MS step for fragmen tation in the second MS analysis. Thus, low er abu ndance proteins are obscured b y the presence of the high abu ndance ones. High-resolution LC-MS instrument s can b e used to identify p eptides on the basis of extremely accurate mass measurements and LC elution times. A database is again r equ ired, con taining theoretical or p reviously-observ ed mass and elution time measur emen ts. In h ybrid appr oac hes, like the AMT tag approac h [P asa-T olic et al. ( 2004 )], iden tifications from MS/MS are used to create a database of putativ e mass and time tags for comparison with high-resolution LC-MS data. Since MS/MS is sample- and time-int ensiv e, h y b rid app roac hes allo w for higher-throughput analysis, sub jecting only a subset of the sample to MS/MS and the rest to r apid LC-MS. Alternative ly , previously-observ ed MS/MS fr agmen tation patterns can b e used to create a mass and time tag d atabase. By using man y LC-MS/MS datasets in the cre- ation of the database, the under s ampling issu es asso ciated w ith LC -MS/MS are a v oided. 18 Y. V . KARPIEVI TCH ET AL. In eac h of the ab ov e app roac hes, there is a statistical problem of assessing confidence in database matc hes. This is t yp ically dealt with in one of tw o w ays. T he fir st inv olv es mo d eling a collec tion of database matc h scores as a mixture of a correct-matc h distribution an d an incorrect-matc h distribution. The confiden ce of eac h matc h is assessed b y its estimated p osterior pr oba- bilit y of having come from the correct-matc h distribution, conditional on its observ ed score [K¨ all et al. ( 2008b )]; P eptideProph et is a wid ely-used exam- ple [Keller et al. ( 2002 )]. Impr o ve men ts ha v e b een made to PeptideProphet to a vo id fixed co efficien ts in computation of d iscriminan t search score and utilization of only one top scoring p eptide assignmen t p er sp ectrum [Ding, Choi and Nesvizhskii ( 2008 )]. Deco y databases are an alternativ e approac h, in w hic h the search database is scrambled so that an y matc hes to th e deco y database can b e assu med to b e false [Ch oi, Ghosh and Nesvizhskii ( 2008 ); K¨ all et al. ( 2008a )]. Th e distrib ution of d eco y matc hes is then u sed as th e null distribution for the observ ed scores for matc hes to the searc h database, and p -v alues are computed as simple pr op ortions of deco y matches as strong or stronger than the observ ed matc hes from the searc h database. A h ybrid ap- proac h that com b ines mixture mo dels w ith deco y database searc h can also b e us ed [C h oi and Nesvizhskii ( 2008b )]. Whether w orking from p osterior probabilities or p -v alues, lists of high-confidence p ep tid e iden tifications can b e selected in terms of false disco ve r y r ates [Choi and Nesvizhskii ( 2008a ); Storey and Tibsh irani ( 2003 )]. Both deco y database matc hing and empirical Ba y es approac h es are global, in that they mo del the d istribution of database matc h scores for all sp ectra at the same time. An “exp ectation v alue” is an alternativ e significance v alue, whic h mo d els th e distribution of scores for a single exp erim ental sp ectrum with all p eptide matc h scores from the theo- retical database [F en y¨ o and Bea vis ( 2003 )]. An alternativ e to d atabase search app r oac hes is de novo s equ encing [Dan- cik et al. ( 1999 ); F rank and P evzner ( 2005 ); Joh n son et al. ( 2005 ); Lu and Chen ( 2003 ); S tanding ( 2003 ); T abb, S araf and Y ates ( 2003 )]. De novo se- quencing inv olv es assembling th e amin o acid sequences of p eptides based on direct insp ection of sp ectral patterns. F or a giv en amino acid sequence, the p ossible fragmen tation ions and masses can b e en u m erated, as w ell as the ex- p ected f requency with whic h eac h t yp e of fragment ion would b e form ed. De novo sequencing th erefore tries to find the sequence for w hic h an observ ed sp ectral p attern is most lik ely . The key distinction from d atabase-sea rc h ap- proac hes is that th ere is no need for a priori sequence kno w ledge. Supp ose, for example, that we are study in g human samples. With database-searc h, w e wo uld load a human proteome F AST A fi le and only h a ve access to amino acid sequences generated therein. With de novo sequencing, any amino acid sequence could b e considered. T his can b e imp ortan t when studying organ- isms w ith incomplete or imp erf ect genome information [Ram et al. ( 2005 )]. MASS S PECTR OMETR Y-BASED PROTEOMICS 19 Dra wbacks include increased computational exp ense as w ell as the need for relativ ely large sample quan tities. Com b inations of de novo sequence tag generation and database s earc hing (h yb rid metho d s) are widely used in PTM id entificatio n [Mann and Wilm ( 1994 )]. The de novo approac h infers a p eptide sequence tag (n ot the full- length p eptide) from th e sp ectrum w ithout searc hing the pr otein database. These sequence tags can then b e used to filter the database to red u ce its size, wh ic h in turn sp eeds up the calculatio n of the sp ectrum matc hes with all p ossible PTMs. InsPect is a wid ely used to ol for ident ification of PTMs [T anner et al. ( 2005 )]. Lui et al. prop osed a similar sequence tag-based ap- proac h with a deterministic fi nite automaton mo del for searc h ing a p eptide sequence database [Liu et al. ( 2006 )]. While b ottom-up MS-based proteomics deals with p eptides, the r eal goal is to iden tify pr oteins pr esen t in a sample. In most cases, a p eptide amino acid sequence can b e used to identify the protein from whic h it was d eriv ed. Soft ware like ProteinProphet can translate p eptide-lev el ident ifications to the protein lev el and assign eac h r esulting protein ident ification a confid en ce measure [Nesvizhskii et al. ( 2003 )]. A key c hallenge in translating p eptide iden tifi cations to the protein lev el is de gener acy . A degenerate p eptide is one that could h av e come from multiple proteins; this is most common for p ep- tides with short amino acid sequences or ones that come from homologo u s proteins (where homology refers to a similarit y in amino acid sequences). Based on th e inform ation present in an individual d egenerate p eptide, it is not necessarily clear ho w to decide b et ween multiple proteins. Ho wev er, by taking the information present in uniquely iden tified an d degenerate p ep- tides that we re id en tified as b elonging to multiple proteins in to accoun t, sensible mo del-based decisions can b e achiev ed [Sh en et al. ( 2008 )]. Pep- tideProphet sh ares degenerate p eptides among their corresp onding pr oteins and pro du ces a minimal pr otein list that account s for suc h p eptides. Another c hallenge is du e to the fact that correctly iden tified p ep tides usu ally b elong to a small set of pr oteins, but incorrectly identified p eptides matc h r an d omly to a large v ariet y of proteins. Thus, a small n u mb er of incorrectly iden tified p eptides (with high scores) can make it difficult to determine th e correct paren t pr otein, esp ecially in a single-p eptide identifica tion, and ma y result in a m uch higher err or rate at the protein lev el [Nesvizhskii and Aeb ersold ( 2004 )]. 6. Pr otein quant itation. Quan titativ e proteomics is concerned with quan- tifying and comparin g protein abun dances in differen t conditions (Figure 6 ). T here are t w o main approac hes: stable isotop e lab eling and lab el free. In all cases, as in the id en tification setting, ther e is the c h allenge of rolling p eptide-lev el in formation u p to the protein lev el. Th is can b e view ed as an 20 Y. V . KARPIEVI TCH ET AL. analogous problem to the pr ob e-set summarization step r equired with many DNA microarra ys [Li and W ong ( 2001 )]. In lab el-based quantitat iv e LC-MS, c h emical, metab olic or enzymatic sta- ble isotop e lab els are in corp orated in to con trol and exp erimen tal samples, the samples are mixed together and then analyzed with LC-MS [Goshe and Smith ( 2003 ); Guerrera and Kleiner ( 2005 ); Gygi et al. ( 199 9 )]. In c hemical lab eling, such as isotop e-co ded affinit y tag (ICA T), C ystine ( Cys ) residu es are lab eled [Gygi et al. ( 1999 )]. In m etab olic lab eling, cells fr om t wo differen t conditions are gro wn in media w ith either n orm al amino acids ( 1 H/ 12 C/ 14 N) or stable isotop e amin o acids ( 2 H/ 13 C/ 15 N) [Oda et al. ( 1999 ); Ong et al. ( 2002 )]. T his approac h is not app licable to h uman or most mammalian pro- tein profiling. In enzymatic lab eling, proteins from t w o groups are digested in the pr esence of n ormal wat er (H 2 16 O) or isotopically lab eled w ater (H 2 18 O) [Sc hn olzer, Jedrzejewski and Lehmann ( 1996 ); Y e et al. ( 2009 )]. In all of the ab o v e metho d s, differences in lab el w eight create a shift in m/z v alues for the same p eptide under the t wo conditions. After tandem mass analysis (LC-MS/MS), sp ectra are matc hed against a d atabase, and ratios of p eptide abundances in the t wo conditions are determined b y in tegrating the areas under the p eaks of eac h lab eled ion that was detected. Str ong linear agree- men t has b een shown b et ween tru e concen trations and those estimated b y lab el-based app r oac hes [Old et al. ( 2005 )]. Of the tw o quan titation method s considered here, lab el-based metho ds are able to ac h ieve th e most precise estimates of r elativ e abundance. Limitations include the f ollo wing: (i) its restriction to tw o comparison group s, (ii) asso ciated difficulties w ith in- corp orating futur e samples into an existing d ata set, and (iii) exp ense. A new er metho d that allo ws for the comparison of four treatmen t samples at a time and av oids the cystine-selectiv e affinit y of I CA T is iTRA Q [Ross et al. ( 2004 ); Thompson et al. ( 2003 ); Wiese et al. ( 2007 )]. iTRA Q uses isobaric lab els at N-terminus whic h hav e tw o comp onents: rep orter and b alance moi- eties. Com bin ed rep orter and balance moieties alwa ys hav e masses of 145 Da. F or example, if for treatmen t group one w e use rep orter of m ass 114 and balance of mass 31, then for another treatmen t group we can u se rep orter of mass 116 and b alance of mass 29. Pr ecur sor ions from all treatmen t groups app ear as a single p eak of the same w eight in MS 1 . After further fragmen- tation, p eptides break do wn into smaller pieces and separate balance and rep orter ions. Rep orter ions thus app ear as distinct masses, and p eptide abundances are determined from those. iTRA Q is limited to four or eigh t group comparisons, but limitations (ii) and (iii) ab o ve still apply . Lab el-free qu antita tiv e analysis measures relativ e pr otein abundances with- out the use of stable isotopic lab els. In contrast to lab el-based metho ds, samples from d ifferen t comparison groups are analyzed separately , allo wing for more complex exp eriments as w ell as the add ition of su b sequen t samples MASS S PECTR OMETR Y-BASED PROTEOMICS 21 to an analysis; lab el-free metho ds are also f aster than lab el-based meth- o ds. Lab el-free quantificat ion can b e group ed in to t wo catego r ies: sp ectral feature analysis and sp ectral counting. In sp ectral feature analysis, p eak ar- eas of iden tified p eptides are used for abund ance estimates. T h e p eak areas are sometimes normalized to the p eak area of an internal standard protein spik ed int o the sample at a known concen tration level. Goo d linear correla- tion b et w een estimated and true relativ e abundances has b een sho wn f or this metho d of p ep tide quan tification [Bondaren k o, Chelius and Shaler ( 2002 ); Chelius and Bondarenk o ( 2002 ); Old et al. ( 2005 ); W ang et al. ( 2003 )]. In sp ectral coun ting, p eptide ab u ndances for one sample are estimated by the coun t of MS/MS fragmen tation sp ectra that were observed for eac h identi- fied p eptide [Ch oi, F ermin and Nesvizhskii ( 2008 )]. Rep eated iden tifications of the same p eptide in the same samp le are du e to its p r esence in seve ral pro x im al scans constituting its elution profile. Go o d linear correlation b e- t wee n tru e and estimated relativ e abu ndance from sp ectral coun ting ha ve b een sho wn [Ghaemmaghami et al. ( 2003 ); Liu, Sadygo v and Y ates ( 2004 )]. Sp ectral coun ts are easy to collect and do n ot require p eak area integrat ion lik e sp ectral p eak analysis or lab el-based metho ds. Missing p eptides are common in MS-based proteomic data. In fact, it is common to ha ve 20–40 % of all attempted in tensit y measures missing. Abundan ce measur emen ts are missed if, for example, a p eptide wa s id entified in some samples but n ot in others. This can h app en in seve ral w a ys: (i) the p eptide is pr esent in lo w abundances, and in some samples the p eak in tensities are n ot high enough to b e d etected or for the corresp onding ions to b e selected for MS/MS fr agmen tation, (ii) comp etition for c h arge in the ionization pro cess, b y wh ic h some ion sp ecies are liable to b e dominated b y others, and (iii) p eptides wh ose c hemical or physical structure cause th em to get trapp ed in the LC column, among others. Mec hanism (i) is essen tially a censoring mec hanism and app ears to b e resp on s ible for the v ast ma jority of missing v alues [Figure 6 (a)]. Th is complicate s inte nsit y-based qu an titation, as simple s olutions will tend to b e biased. F or example, analysis of on ly the observ ed inte nsities w ill tend to o verestimat e abu n dances and und er estimate v ariances. Simple imputation routines lik e ro w-means or k -nearest-neigh b ors suffer from similar limitations. Statistical mo d els are n eeded to address these issues, as w ell as to h andle the p eptide-to-protein r ollup [Karp ievitc h et al. ( 2009 a ); W ang et al. ( 2006 ); also, see Figure 6 (b )]. Note that a furth er b enefit of sp ectral coun tin g is that it is less sen sitiv e to missing v alues. W e note that p r otein id entificatio n and quan titation are complemen tary exercises. Un id en tified proteins cannot b e quant ified, and the confid ence with wh ic h a pr otein wa s identified should p erhaps b e incorp orated into that protein’s abund ance estimate. Degenerate p eptides, for example, pr esent problems for b oth identi fication and quantita tion, bu t evidence for the pres- ence of sibling p eptides from one protein in high abu ndance can b e useful in deciding b et ween m u ltiple p ossible p rotein iden tities. 22 Y. V . KARPIEVI TCH ET AL. 7. Other tec hnologies. 7.1. MALDI and mass fingerprinting. MALDI (matrix assisted lazed desorption ionization) is mostly used for s in gle MS, typica lly using a TOF mass analyzer. MALDI refers to the metho d of ionizatio n, in whic h a laser is pulsed at a crystalline m atrix cont aining the sample (analyte) [Guerrera and Kleiner ( 2005 ); Karas et al. ( 1987 )]. The analyte is mixed with the matrix solution, sp otted in a w ell on a MALDI plate and allo w ed to crystal- lize. The matrix consists of small organic molecules that absorb ligh t at th e w av elength of th e laser radiation. Up on absorption, the matrix molecules transfer energy to the sample molecules to p ermit ionization and desorp- tion of eve n large molecules as intact gas-phase ions; the m atrix also serves to protect the analyte from b eing destroy ed by th e laser pulse. MALDI is considered a soft ionization tec hnique, resulting in very little analyte frag- men tation. Crystallized samples can b e stored for some time b efore analysis or for rep eated analysis. While MALDI MS/MS instrum ents exist, MALDI is most commonly used for mass fi ngerprinting, where s p ectral patterns are ident ified for discrimi- nating samples from differen t conditions (e.g., cancer vs. normal). Mac h ine learning tec hn iques, suc h as linear discrim in an t analysis, Rand om F orest and Supp ort V ector Mac h in e, among others, are typicall y u sed to bu ild classifiers in hop es of fi nding tools for the early detection of a disease. Disease biomark- ers (sp ecific m/z v alues) can b e ident ified fr om the set of the d ifferentiall y expressed features. Ho w ev er, to date, the s uccess rate for identi fication of true biomark er s is lo w , in part du e to the p o or repro d ucibilit y of the ex- p eriments in time and b et ween labs [Bagg erly , Morris and Co om b es ( 2004 ); P etricoin et al. ( 2002 )]. 7.2. 2-D gels. 2-D gel electrophoresis (2-D E) is an alternativ e tec hnique for protein separation [Gorg, W eiss and Dunn ( 2004 ); Klose and K obalz ( 1995 ); W eiss and Gorg ( 2009 )], fi rst introd uced in 1975 [Klose ( 1975 ); O’F arrell ( 1975 )]. Here, t wo orthogonal separations are used: proteins are first separated b ased on their iso electric p oint (pI ), then based on their size (mass). T he first d imension utilizes the fact that the net c harge of the pro- tein is pH-dep endent . Proteins are loaded int o the pH gradient (v ariable pH) and sub jected to high v oltage. Eac h protein m igrates to th e pH lo cation in the gradien t where its charge is zero and b ecomes immobilized there. The second dimension gel con tains SDS, detergen t molecules with hydrophobic tails and negativ ely charge d heads. S DS denatures (unfolds) the proteins and adds n egativ e charge in p r op ortion to the size of the pr otein. An electric field is applied to mo v e negativ ely charge d pr oteins to wa rd the p ositiv ely c harged electrode, smaller pr oteins migrating throu gh th e gel f aster than larger ones. MASS S PECTR OMETR Y-BASED PROTEOMICS 23 Multiple copies of the p roteins will generally mo ve at the same sp eed and will end up fixated in bulk at a certain sp ot on the gel. Protein detection is p erformed with staining (most common) or radio- lab eling. Proteins can then b e quantified based on their sp ot in tensity . The staining intensit y is app ro ximately a linear function of the amoun t of protein present . Images of the 2-D gels can b e compared b etw een different compar- ison groups to study p rotein v ariations b etw een the group s and identify biomark ers. T h e follo wing steps are generally required b efore quantita tiv e and comparativ e analysis can b e d one, not necessarily in this ord er: (a) denoising, (b) b ac kground correction, (c) sp ot detection, (d) sp ot matc h- ing/gel alignmen t, (e) sp ot qu antificatio n . Although all steps are n eeded, sp ot matc hing is the m ost imp ortant, as proteins can shift along th e axis from image to image (gel to gel) as well as exhib it a pattern of s tr etc hing along the diagonals. Examples of programs d esigned to p erform the ab o ve steps are P r ogenesis (Nonlinear Dynamics Ltd., Newc astle-up on-T yn e, UK ) and PDQu est V ersion 8.0 (Bio-Rad L ab oratories, Hercules, CA, USA), b oth of whic h are proprietary . Pinnacle is an op en source program that p erforms sp ot detection and quantificati on in the aligned gels [Morris, Clark and Gut- stein ( 2008 )]. 8. D iscussion. While the fi eld of LC-MS-based p roteomics has seen rapid adv ancemen ts in recen t years, there are s till significant challe nges in pro- teomic analysis. The complexit y of the proteome and the myria d of compu- tational tasks that must b e carried out to translate samp les in to data can lead to p o or repro ducibilit y . Ad v ancemen ts in mass sp ectrometry and sep- aration tec hnologies will surely help, but there will con tinue to b e a crucial role for statistici ans in the design of exp erimen ts and metho ds sp ecific to this setting. Careful assessmen ts of the capabilitie s of curren t L C-MS-based proteomics to ac h iev e certain leve ls of sensitivit y and sp ecificit y , b ased on instrument configuration, exp erimenta l proto col, exp eriment al design, sam- ple size, etc., w ould b e extremely v aluable for assisting in the establishment of b est-practices, as well as for gauging the capabilities of the technolog y ; the National Cancer Institute’s Clinical Pr oteomic T ec h nologies for Cancer program is an example. It is likely th e case th at ve ry large studies will b e required f or tru e br eakthrough find ings (e.g., biomark ers ) in sys tems b iology using pr oteomics. Sp ecific method ologica l areas that can u s e additional inpu t from statisti- cians includ e the dev elopment of statistical mo d els for rolling up from p ep- tides to p roteins; d etermin ation of protein net works; construction of con- fidence lev els with w hic h we identify p eptides and su bsequentl y proteins; alignmen t of L C-MS r uns and assurance of qualit y of those alignmen ts, that is, assigning a p -v alue to a set of aligned LC-MS r uns to assess “correctness” of alignmen t. F u rthermore, as additional dimensions of s eparation (as in 24 Y. V . KARPIEVI TCH ET AL. IMS-LC-MS) are in tr o d uced, more flexible and generalizable prepr o cessing, estimation and inf er ential metho ds will b e required. In general, statistic ians can play a pivo tal r ole in LC-MS-based proteomics (as we ll as other -omics tec hnologies) by participating in inte rdisciplinary researc h teams and assist- ing with th e applicatio n of classical statistical concepts [Ob erg and Vitek ( 2009 )]. I n particular, the statistician can con tr ib ute by ensurin g that well- planned exp erimental d esigns are emplo ye d, assumptions required for reli- able inferen ce are met, and p rop er interpretatio n of statistical estimates and inferences are used [Dougherty ( 2009 ); Hand ( 2006 )]. These con trib utions are arguably more v aluable than the devel opmen t of additional algorithms and computational metho d s. Due to the great complexit y of high-throughpu t -omics tec hnologies and th e data that result, careful statistical reasoning is imp erativ e. Ac kn owledgmen t. W e thank J osh Adkins for m any helpful discus sions. REFERENCES Baggerl y, K. A ., Morris, J. S. and Coombes, K. R. (2004). Repro ducibility of SELDI- TOF protein patterns in serum: Comparing datasets from different exp erimen ts. Bioi n- formatics 20 777–785. Belov, M. E. et al. (2007). Multiplexed ion mobilit y sp ectrometry-orthogonal time-of- flight mass sp ectrometry . Anal. Chem. 79 2451–24 62. Ber th, M. et al . ( 2007). The state of the art in the analysis of tw o-dimensional gel electrophoresis images. Appl. Micr obiol. Bi ote chnol. 76 1223–12 43. Bondarenk o, P. V., Chelius, D. and Shaler, T. A. (2002). Identification and relative quantitation of protein mixtu res by enzymatic digestion follo w ed by capillary reversed– phase liqu id chromatog raphy–tandem mass sp ectrometry . Anal. C hem. 74 4741–4749. Callister, S. J. et al. ( 2006). Normalization approaches for remo ving sy stematic biases associated with mass sp ectrometry and lab el-free proteomics. J. Pr ote ome R es. 5 277– 286. Caprioli, R. M., F armer, T. B. and Gile, J. (1997). Molecular imaging of biological samples: Localization of pep t ides and proteins using MALDI-TOF MS. A nal . Chem. 69 4751–4760. Chelius, D. and Bondarenk o, P. V. (2002). Q uantitati ve profiling of p roteins in com- plex mixtures using liquid chroma tography and mass sp ectrometry . J. Pr ote ome R es. 1 317–323. Choi, H., Fermin, D. and Ne svizhski i, A. I. (2008). Significance analysis of sp ectral count data in lab el-free shotgun p roteomics. Mol. Cel l. Pr ote omics 7 2373–2385. Choi, H., Ghosh, D. and Nesvizhski i, A. I . (2008). Statistical v alidation of p ep tide identificatio ns in large-scale proteomics using the target-deco y database searc h strategy and flexible mixture mod eling. J. Pr ote ome R es. 7 286–292 . Choi, H. and N esvizhski i, A . I. (2008a). Semisup ervised mo del-based v alidation of p ep- tide identificati ons in mass sp ectrometry-based p roteomics. J. Pr ote ome R es. 7 254–2 65. Choi, H. and Ne svizhski i, A. I. (2008b). F alse d isco very rates and related statistical concepts in mass sp ectrometry-based proteomics. J. Pr ote ome R es. 7 47–50. Cornett, D. S. et al. (2007). MALDI imaging mass spectrometry: Molecular snap sh ots of b iochemical systems. Nat. Metho ds 4 828–833. MASS S PECTR OMETR Y-BASED PROTEOMICS 25 Craig, R. and B ea vi s, R. C. (2004). T AN D EM: Matching proteins with tand em mass sp ectra. Bi oinformatics 20 1466–1467 . Dab ney, A. R . and S torey, J. D. (2006). A reanalysis of a pub lished Aff ymetrix GeneChip control dataset. Genome Bi ol. 7 401. Dancik, V. et al. (1999). D e novo p eptide sequencing via tandem mass sp ectrometry . J. Comput. Biol. 6 327–342. Deutsch, E. (2008). mzML: A single, unifying d ata format for m ass sp ectrometer outp ut. Pr ote omics 8 2776–2777. Ding, Y., Choi, H. and Nesvi zhski i, A. I. (2008). Adaptive discriminant function analy- sis and rerank ing of MS/MS d atabase search results for improved p eptide identificatio n in shotgun proteomics. J. Pr ote ome Re s. 7 4878–4889. Domon, B. an d Aebersold, R. (2006). Mass sp ectrometry and protein analysis. Scienc e 312 212–217. Dougher ty, E. R. (2009). T ranslational science: Epistemology and the investig ative p ro- cess. Curr ent Genomics 10 102–109. Elias, J. E. and Gygi, S. P. (2007). T arg et-decoy search strategy for increased confidence in large-scale protein identifications by mass sp ectrometry . Nat. Metho ds 4 207–214. Eng, J. K., McCormack, A. L. and Y a tes, J. R., 3rd. (1994). An approac h to correlate MS/MS data to amino acid sequences in a protein d atabase. J. Am. So c. Mass Sp e ctr om. 5 976–989. Feny ¨ o, D. and Bea vis, R. C. (2003). A metho d for assessing the statistical significance of mass sp ectrometry-b ased protein identifications u sing general scoring schemes. Anal. Chem. 75 768–774. Finney, G. L. et al. (2008). Lab el-free comparative analysis of proteomics mixtu res using c h romatographic alignment of high-resolution muLC-MS d ata. Anal. Chem. 80 961–971 . Frank, A. and Pevzner, P. (2005). P ep No vo: De no vo p eptide sequencing via p roba- bilistic n et w ork mo deling. Anal. Chem. 77 964–973. Garza, S. and Moini, M. (2006). A nalysis of complex p rotein mix tures with impro ved sequence co verag e using (CE-MS/MS)n. Anal. Chem. 78 7309–7316. Ghaemmaghami, S. et al. (2003). Global analysis of protein expression in yeast. Natur e 425 737–741. Gorg, A., We iss, W. and Dunn, M. J. (2004). Current tw o-dimensional electrophoresis technolo gy for p roteomics. Pr ote omics 4 3665–3685 . Goshe, M. B. and Sm ith, R. D. (2003). S t able isotop e-cod ed proteomic mass sp ectrom- etry . Curr. Opin. Bi ote chnol. 14 101–109 . Guerrera, I. C . and Kleiner, O. (200 5). Ap p lication of mass spectrometry in pro- teomics. Bi osci. R ep. 25 71–93. Gygi, S . P. et al. ( 1999). Quantitativ e analysis of complex protein mixtures u sing isotope-co ded affinity tags. Nat. Biote chnol. 17 994–999 . Han, X., Aslania n, A. and Y a tes, J. R., 3rd . (2008). Mass sp ectrometry for proteomics. Curr. Opi n. Chem. Biol. 12 483–490. Hand, D. J. (2006). Classifier technology and the illusion of progress. Statist. Sci. 21 1–15. MR2275965 Horn, D. M., Zubarev, R. A. and M cLaffer ty, F. W . (2000). Automated redu ction and interpretation of high resolution electrospra y mass sp ectra of large molecules. J. Am. So c. Mass Sp e ctr om. 11 320–332. Jaitl y, N. e t al. (2006). Robust algorithm for alignment of liquid c hromatograph y–mass sp ectrometry analyses in an accurate mass and time tag d ata analysis pip eline. Anal. Chem. 78 7397–7409. 26 Y. V . KARPIEVI TCH ET AL. Jaitl y, N. et al. (2009). Decon2LS: An op en- source soft ware p ack age for automated processing and visualization of high resolution mass sp ectrometry data. BMC Bioin- formatics 10 87. Johnson, R . S. et al. (2005). Informatics for protein identification by mass spectrometry . Metho ds 35 223–236. K ¨ all, L. et al. (2008a). P osterior error probabilities and false discov ery rates: Two sides of t he same coin. J. Pr ote ome R es. 7 40–44. K ¨ all, L. et a l. (2008b). Assigning significance to p eptides identified b y tandem mass sp ectrometry u sing decoy databases. J. Pr ote ome R es. 7 29–34. Kapp, E. and Schutz, F. (2007). Overview of tandem mass sp ectrometry (MS/MS) database searc h algorithms. Curr. Pr oto c. Pr otein. Sci. Ch apter 25 Un it25 22. Karas, M. et al. (1987 ). Matrix-assisted u ltra v iolet laser desorption of non-volatil e compou n ds. International Journal of M ass Sp e ctr ometry and I on Pr o c esses 78 53–68. Karpievitch, Y . et al. (2009a). A statistical framework for protein quantitation in b ottom-up MS- based proteomics. Bioinf ormatics 25 2028–203 4. Karpievitch, Y. V. et al. (2009b). Normalization of p eak intensities in b ottom-up MS- based p roteomics using singular v alue d ecomposition. Bioinf ormatics 25 2573–258 0. Keller, A. et al. (2002). Empirical statistical mo del to estimate the accuracy of p eptide identificatio ns m ad e by MS/MS and d atabase search. Anal. Chem. 74 5383–5392. Klose, J. (1975). Protein mapping by com bined isoelectric focusing and electrophoresis of mouse tissues. A nov el approach to testing for induced p oint mutations in mammals. Humangenetik 26 231–243. Klose, J. and Kob alz, U. (1995). Two-dimensional electrophoresis of proteins: An up- dated p rotocol and implications for a functional analysis of th e genome. Ele ctr ophor esis 16 1034–1059. Laskin, J. and Futrell, J. H. ( 2003). Collisional activ ation of p eptide ions in FT-ICR mass sp ectrometry . Mass Sp e ctr om. R ev. 22 158–181. Lee, H. J. et al. (2006). Biomark er disco very from th e plasma proteome using multidi- mensional fractionation proteomics. Curr. Opin. Chem. Biol. 10 42–49. Leek, J. T . and Storey J. D. (2007). Capturing heterogeneit y in gene expression stu d ies by surrogate v ariable analysis. PL oS Genet. 3 1724–1735 . Li, C. and Wong, W. (2001). Mo del-based analysis of oligonucleotide arra y s: Expression index compu t ation and outlier detection. Pr o c. Natl. A c ad. Sci. 98 31–36. Lin, S. M. et al. (2005). What is mzXML goo d for?. Exp ert R ev. Pr ote omics 2 839–845. Link, A. J. et al. ( 1999). Direct analysis of protein complexes using mass sp ectrometry . Nat. Biote chnol. 17 676–682 . Liu, C. et al. (2006). Peptide sequence tag-based blind identification of post-t ranslational mod ifi cations with p oint pro cess mo del. Bioinformatics 22 e307–313. Liu, H., Sadygov, R. G. and Y a tes, J. R., 3rd (2004). A mo del for random sampling and estimation of relativ e protein abund an ce in shotgun proteomics. A nal. Chem. 76 4193–42 01. Lu, B. and Che n, T . (2003). A sub optimal algorithm for de novo pep tide sequencing via tandem mass sp ectrometry . J. Comput. Biol. 10 1–12. Mallick, P. et al. (2007). Computational prediction of proteotypic p eptides for q u an- titative p roteomics. Nat. Biote chnol. 25 125–131. Mann, M. and W ilm, M. (1994). Error-toleran t identification of p eptides in sequence databases by p eptide sequence tags. Anal. Chem. 66 4390–4399. Masselon, C. D. e t al. (2008). Influen ce of mass resolution on sp ecies matching in accurate mass and retentio n time (AMT) tag proteomics exp eriments. R apid Commun. Mass Sp e ctr om. 22 986–992. MASS S PECTR OMETR Y-BASED PROTEOMICS 27 Morris, J. S., Clark, B. N. and Gutstein, H. B. ( 2008). Pinnacle: A fast, automatic and accurate metho d for detecting and q uantif ying p rotein sp ots in 2-dimensional gel electrophoresis data. Bi oi nformatics 24 529–536. Nesvizhski i, A. I. ( 2007). Protein identification by tandem mass spectrometry and se- quence d atabase searching. Metho ds Mol. Biol. 367 87–119. Nesvizhski i, A. I. and Aebersold, R. ( 2004). Analysis, statistical v alidation and dis- semination of large-scal e proteomics datasets generated by tandem MS. Drug Disc ov. T o day 9 173–181. Nesvizhski i, A. I. et al. (2003). A statistical mo del for identifying proteins by tandem mass sp ectrometry . Anal. Chem. 75 4646–4658. Nesvizhski i, A. I., Vitek, O. and Aebersold, R. (2007). Analysis and v alidation of proteomic data generated by tand em mass sp ectrometry . Nat. Metho ds 4 787–797. Nguyen, D. V. et al. (2002). DNA microarra y exp eriments: Biologica l and technological aspects. Bi ometrics 58 701–717. MR1939398 O’F arrell, P. H. (1975). High resolution tw o-dimensional electrophoresis of proteins. J. Biol. Chem. 250 4007–4021. Oberg, A. L. and Vitek, O. (2009). S tatistical design of quantitativ e mass spectrometry- based p roteomic exp eriments. J. Pr ote ome R es. 8 2144–21 56. Oda, Y. et al. (1999). Accurate quantitation of protein expression and site-sp ecific phosphorylation. Pr o c. Natl. A c ad. Sci. USA 96 6591–65 96. Old, W. M. et al. (2005). Comparison of lab el-free meth ods for quantifying human proteins by shotgun proteomics. Mol. Cel l. Pr ote omics 4 1487–1502. Ong, S . E. et al. (2002). Stable isotop e lab eling by amino acids in cell cultu re, SILAC, as a simple an d accurate approach to expression proteomics. Mol. Cel l. Pr ote omics 1 376–386 . Ong, S. E. and Mann, M. (2005). Mass spectrometry-b ased proteomics t urns q uantita- tive. Nat. Chem. Biol . 1 252–262. Orc hard, S. et al. (2009). Managing the data explosion. A report on the HU PO-PSI W orkshop. August 2008, Amsterdam, The Netherlands. Pr ote omics 9 499–501. Orc hard, S . et al. (2007). Proteomic data exchange and storage: The need for common standards and pub lic rep ositories. Metho ds Mol . Biol. 367 261–270. P asa-Tolic, L. et al. (2004). Proteomic an alyses u sing an accurate mass and time tag strategy . BioT e chniques 37 621–624 , 626–633, 636 passim. Pedrioli, P. G. et a l. (2004). A common op en representation of mass sp ectrometry data and its application t o proteomics researc h. Nat. Biote chnol. 22 1459–14 66. Peng, J . et al. (2003). Eval uation of multidimensional c hromatograph y coupled with tandem mass sp ectrometry (LC/LC-MS/MS) for large-scale protein analysis: The ye ast proteome. J. Pr ote ome R es. 2 43–50. Perkins, D. N. et al. (1999). Probability-based protein identification by searching se- quence d atabases using mass sp ectrometry data. Ele ctr ophor esis 20 3551–356 7. Petricoin, E. F. et al. (2002). Use of proteomic patterns in serum to identify ov arian cancer. L anc et 359 572–577. Petritis, K. e t al. (2006). Imp roved p ep t ide elution time prediction for reversed-phase liquid chromatograph y -MS by incorporating p eptide sequence information. Anal. Chem. 78 5026–5039. Petyuk, V. A. et al. (2008). Elimination of systematic mass measurement errors in liquid chromatograph y–mass sp ectrometry b ased proteomics u sing regression mo dels and a priori partial knowle dge of the sample content. Anal. Chem. 80 693–706. 28 Y. V . KARPIEVI TCH ET AL. Pittenauer, E. and A llmaier, G. (2009). H igh-energy collision induced dissociation of biomolecules: MALDI - TOF/R TOF mass sp ectrometry in comparison to tandem sector mass sp ectrometry . Comb. Chem. High Thr oughput Scr e en 12 137–155 . Quack enbush, J. (2002). Microarray d ata normalization and transformation. Nat. Genet. 32 Su p pl 496–501. Ram, R. J. et al. (2005). Communit y proteomics of a natural microbial b iofilm. Scienc e 308 1915–1920. Ro ss, P. L. et al. (2004). Multiplexed protein q u anti tation in S acc h aromyces cerevisiae using amine-reactive isobaric tagging reagents. M ol. Cel l. Pr ote omics 3 1154–116 9. Sadygo v, R. G., Cocior v a, D. and Y a tes, J. R., 3rd. (2004). Large-scale database searc hin g using t an d em mass sp ectra: Lo oking up t h e answer in the back of the b o ok. Nat. Metho ds 1 195–202. Sandra, K. et al. (2008). Highly efficient p eptide separations in proteomics. Part 1. Unidimensional high p erformance liquid chromatog raphy . J. C hr omato gr. B A nalyt. T e chnol. Biome d. Life Sci. 866 48–63. Sandra, K. et al. (2009). Highly efficient p eptide separations in proteomics. Part 2: Bi- and multidimensional liquid-based separation techniques. J. Chr omato gr. B Analyt. T e chnol. Biome d. Life Sci. 877 1019–1039. Schnolzer, M., Jedrzejewski, P. and Lehmann, W. D. ( 1996). Protease-catalyzed incorporation of 18O into p ept id e fragmen ts and its application for p rotein sequenc- ing by electrospra y and matrix-assisted laser desorption/ionization mass sp ectrometry . Ele ctr ophor esis 17 945–953. Searle, B. C., Turner, M. and Nesviz hskii , A. I. (2008). Improving sensitivit y by probabilistically com b ining results from multiple MS/MS searc h metho dologies. J. Pr o- te ome R es. 7 245–253. Shen, C. et al. (2008). A hierarc hical statistical mo del to assess the confidence of p eptides and proteins inferred from tan d em mass sp ectrometry . Bioinformatics 24 202–208. Siuzdak, G. (2003). The Exp anding R ol e of Mass Sp e ctr ometry in Biote chnolo gy . MCC Press, San Diego. Sleno, L. and Volmer, D. A. (2004). Ion activ ation metho ds for tand em mass sp ec- trometry . J. Mass Sp e ctr om. 39 1091–1112. Sobott, F. et al. (2009). Comparison of CID vers us ETD b ased MS/MS fragmenta tion for t h e analysis of protein ubiqu itination. J. Am. So c. Mass Sp e ctr om. 20 1652–1659. St anding, K. G. ( 2003). Peptide and protein de nov o sequencing by mass sp ectrometry . Curr. Opi n. Struct. Biol. 13 595–601. Stoeckli, M. et al. (2001). Imaging mass sp ectrometry: A new technology for th e analysis of protein expression in mammalian tissues. Nat. M e d. 7 493–496. Storey, J. D. and Tibshiran i, R. (2003). S tatistical significance for genomewide studies. Pr o c. Natl. A c ad. Sci. USA 100 9440–9445. MR1994856 Suny aev, S. et al. (2003). MultiT ag: Multiple error-tolerant sequence tag searc h for the sequ ence-similarit y identification of proteins by mass spectrometry . Anal. Chem. 75 1307–13 15. T abb, D. L., Saraf, A. and Y a tes, J. R ., 3rd. (2003). GutenT ag: High-throughput sequence tagging via an empirically derived fragmenta tion mo del. Anal. Chem . 75 6415– 6421. T ang, N., Torna tore, P. and Wei nberger, S. R. (2004). Current developmen ts in SELDI affinity technology . Mass Sp e ctr om. R ev. 23 34–44. T ann er, S. et al. (2005). InsPecT: Identification of p osttranslationall y modified p eptides from t andem mass sp ectra. Anal. Chem. 77 4626–4639. MASS S PECTR OMETR Y-BASED PROTEOMICS 29 Thompson, A. et a l. (2003). T andem mass tags: A nov el quantification strategy for comparativ e analysis of complex protein mixtures by MS/MS. A nal. Chem . 75 1895– 1904. Tolmac hev, A. V. et al. (2008). Characterization of strategies for ob t aining confident identificatio ns in b ottom-up proteomics measurements u sing hybrid FTMS instrum ents. Ana l. Chem. 80 8514–852 5. W ang, P. et al. ( 2006). Normalizatio n regarding n on-random missing va lues in high- throughput mass sp ectrometry data. Pacific Symp osium of Bio c omputing 315–326. W ang, W . et al. (2003). Quantification of proteins and metab olites by mass sp ectrom- etry without isotopic lab eling or spiked standards. Anal. Chem. 75 4818–48 26. W ashburn, M. P., Wol ters, D. and Y a tes, J. R., 3rd. (2001). Large-scale analy- sis of th e yeast proteome by multidimensio nal protein iden tification tec hnology . Nat. Biote chnol. 19 242–247. Weiss, W . and Gorg, A . (2009). High-resolution tw o-dimensional electrophoresis. Meth- o ds Mol. Biol. 564 13–32. Wells, J. M. and McLuckey, S. A. (2005). Collision-induced dissociation (CID) of p eptides and proteins. Metho ds Enzymol. 402 148–185. Wiese, S. et a l. (2007). Protein labeling by iTRAQ: A new to ol for quantitativ e mass sp ectrometry in proteome researc h . Pr ote omics 7 340–350. Wilkins, M. et al. (1996). Progress with proteome pro jects: Why all proteins exp ressed by a genome should b e identified and ho w to do it. Biote chnol. Genet. Eng. R ev. 13 19–50. Wol ters, D. A ., W ashburn, M. P. and Y a tes, J. R ., 3rd. (2001). An automated multidimensi onal protein identificatio n technolo gy for shotgun proteomics. Anal. Chem. 73 5683–5690. Y anofsky, C. M. et al. (2008). A Ba yesian app roach to p eptide identification using accurate mass and t ime tags from LC-FTICR-MS p roteomics exp eriments. Conf . Pr o c. IEEE Eng. Me d. Biol. So c. 2008 3775–3778 . Y a tes, J. R., 3rd. (1998). Database searc hing using mass sp ectrometry data. Ele c- tr ophor esis 19 893–900. Ye, X. et al. (2009). 18O stable isotope lab eling in MS-b ased proteomics. Brief F unct. Genomic Pr ote omic 8 136–144. Zhang, H. et a l. (2005). H igh throughput quantitative analysis of serum proteins using glycopep t ide capture and liquid chromatogra phy mass spectrometry . Mol. Cel l. Pr o- te omics 4 144–155. Zhang, Y. et al. (2009). Effect of dynamic exclusion d u ration on sp ectral count based quantitativ e proteomics. Anal. Chem. Y. V. Karpievitch A. D. Polpitiy a G. A. Anderson R. D. S mith P acific Nor thwest Na tional Labora tor y Richland, W ashing ton 9935 USA A. R. Dabney Dep ar tment of St a tistics Texas A&M Un iversity College St a tion, Texas 7784 3 USA
Original Paper
Loading high-quality paper...
Comments & Academic Discussion
Loading comments...
Leave a Comment