A dedicated tool for a full 3D Cn2 investigation
We present in this study a mapping of the optical turbulence (OT) above different astronomical sites. The mesoscale model Meso-NH was used together with the Astro-Meso-Nh package and a set of diagnostic tools allowing for a full 3D investigation of the Cn2. The diagnostics implemented in the Astro-Meso-Nh, allowing for a full 3D investigation of the OT structure in a volumetric space above different sites, are presented. To illustrate the different diagnostics and their potentialities, we investigated one night and looked at instantaneous fields of meteorologic and astroclimatic parameters. To show the potentialities of this tool for applications in an Observatory we ran the model above sites with very different OT distributions: the antarctic plateau (Dome C, Dome A, South Pole) and a mid-latitude site (Mt. Graham, Arizona). We put particular emphasis on the 2D maps of integrated astroclimatic parameters (seeing, isoplanatic angles) calculated in different slices at different heights in the troposhere. This is an useful tool of prediction and investigation of the turbulence structure. It can support the optimization of the AO, GLAO and MCAO systems running at the focus of the ground-based telescopes.From this studies it emerges that the astronomical sites clearly present different OT behaviors. Besides, our tool allowed us for discriminating these sites.
💡 Research Summary
The paper introduces a dedicated diagnostic framework for a full three‑dimensional (3‑D) investigation of atmospheric optical turbulence, expressed through the refractive‑index structure parameter Cn². By coupling the mesoscale atmospheric model Meso‑NH with the Astro‑Meso‑Nh package, the authors extend the model’s capability to compute Cn² directly from the simulated temperature and wind fields at high spatial resolution (horizontal grid ≤ 1 km, vertical layers of ~10 m). Additional diagnostic tools are implemented: an instantaneous 3‑D field viewer, an integrated‑parameter mapper that converts Cn² into standard astro‑climatic quantities (seeing, isoplanatic angle, atmospheric transmission), and a slice‑based 2‑D map generator that visualizes these quantities at selected altitudes.
The methodology is applied to two contrasting astronomical sites: three locations on the Antarctic plateau (Dome C, Dome A, South Pole) and a mid‑latitude site, Mt. Graham in Arizona. For each site a 12‑hour simulation is performed with identical boundary conditions, and output is stored every five minutes. The diagnostic suite allows the authors to examine a single night in detail, visualizing instantaneous meteorological fields together with the corresponding Cn² distribution.
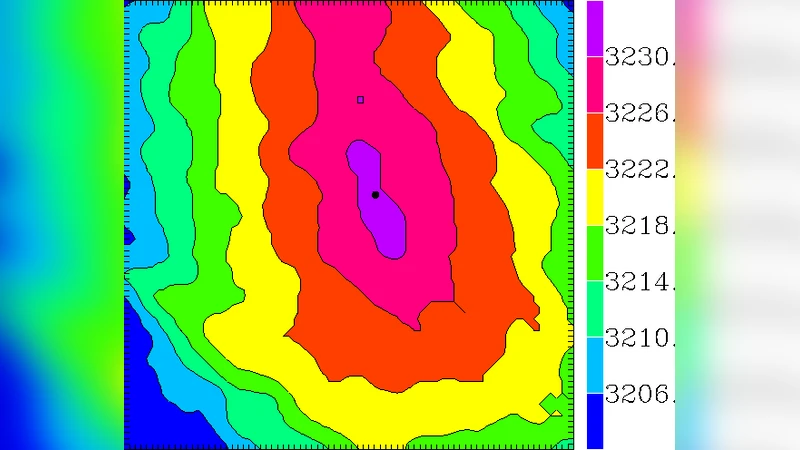
Key findings include: (1) Antarctic sites exhibit an exceptionally low Cn² throughout the troposphere, with values remaining near background levels up to 5 km and only weak, intermittent layers above that height. Integrated seeing values are consistently below 0.3 arcsec and isoplanatic angles stay around 3–4 arcsec, confirming the plateau’s reputation as a premier observing location. (2) Mt. Graham shows a pronounced turbulence layer in the 8–12 km range, associated with the jet stream. In this layer Cn² spikes to ~10⁻¹⁴ m⁻²⁄³, degrading seeing to 1.2–1.5 arcsec and reducing the isoplanatic angle to 1.0–1.5 arcsec. Below 2 km the atmosphere is relatively stable, suggesting that ground‑layer adaptive optics (GLAO) would be effective only for the low‑altitude component, whereas multi‑conjugate adaptive optics (MCAO) must target the high‑altitude jet‑stream layer. (3) By generating 2‑D maps at multiple altitude slices, the tool provides a clear visual guide for where adaptive‑optics correction will be most beneficial, enabling system designers to choose optimal conjugate heights and to assess the potential performance gains for each site.
Beyond scientific insight, the framework offers practical advantages for observatory operations. Its parallel I/O and GPU‑accelerated visualization enable near‑real‑time monitoring of turbulence evolution, which can be integrated into scheduling tools to prioritize observations during periods of favorable atmospheric conditions. The authors also emphasize that the tool can discriminate between sites with markedly different turbulence behaviours, supporting site‑selection studies for future large‑aperture telescopes.
Future work is outlined to improve model fidelity: incorporating microphysical processes such as cloud droplets and radiative transfer, and validating the simulated Cn² against independent measurements (e.g., SCIDAR, radiosonde, lidar). Extending the simulation horizon and coupling with forecast systems could turn the framework into an operational turbulence forecasting service, directly feeding adaptive‑optics control loops and observation planning pipelines.
In summary, this study delivers a robust, high‑resolution 3‑D Cn² investigation capability that surpasses traditional one‑dimensional or averaged approaches. By revealing the vertical structure and temporal variability of optical turbulence across diverse astronomical sites, the tool provides essential quantitative guidance for the design, optimization, and operation of current and next‑generation adaptive‑optics systems.
Comments & Academic Discussion
Loading comments...
Leave a Comment