Optimization of Enzymatic Biochemical Logic for Noise Reduction and Scalability: How Many Biocomputing Gates Can Be Interconnected in a Circuit?
We report an experimental evaluation of the "input-output surface" for a biochemical AND gate. The obtained data are modeled within the rate-equation approach, with the aim to map out the gate function and cast it in the language of logic variables a…
Authors: V. Privman, G. Strack, D. Solenov
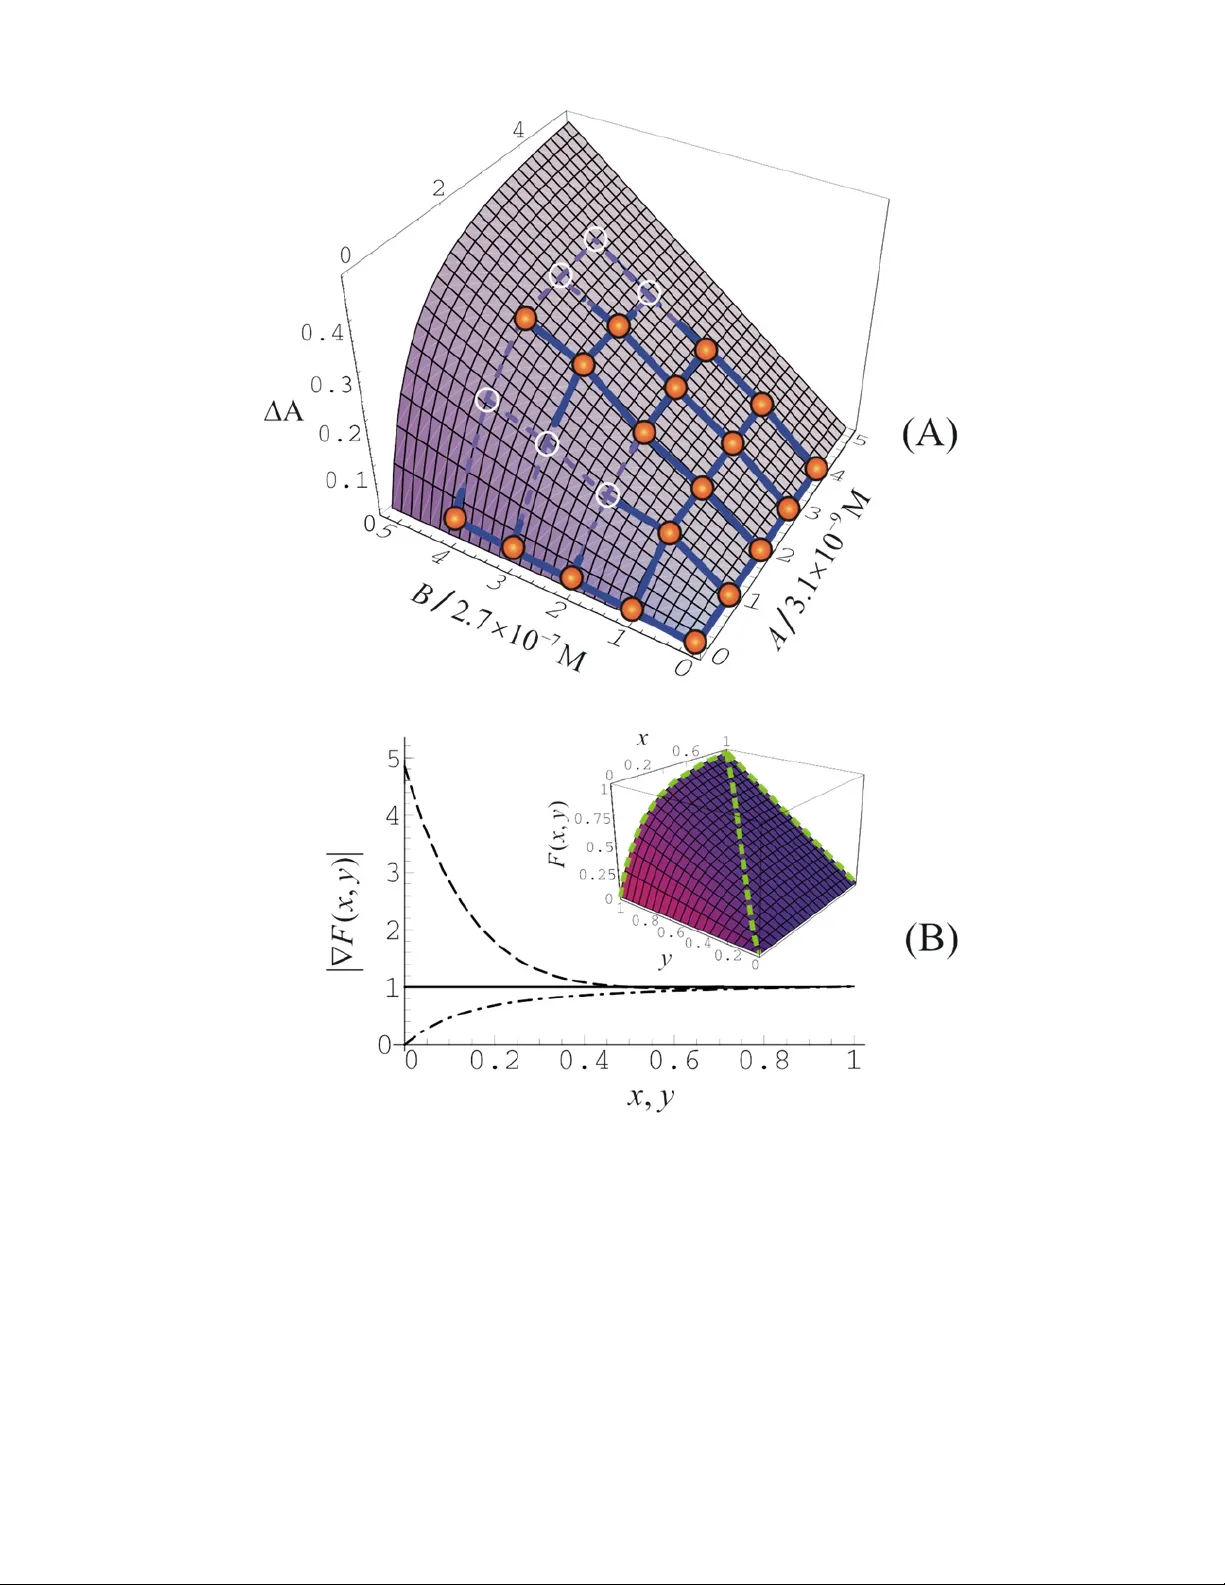
Optimization of Enzymatic Biochemical Logic for Noise Reduction and Scalability: How Many Biocomputing Gates Can Be Interconnected in a Circuit? Vladimir Privman, Guinevere Strack, Dmitry Solenov, Marcos Pita and Evgeny Katz * Department of Chemistry and Biomolecular Science and Department of Physics, Clarkson University, Potsdam NY 13699, USA *Corresponding author: ekatz@clarkson.edu J. Phys. Chem. B 112 , 11777-11784 (2008) E-print arXiv: 0803.4197 Abstract We report an experimental evaluati on of the “input-output surface” for a biochemical AND gate. The obtained data are modeled within the rate-equation approach, with the aim to m ap out the gate function and cast it in the language of logic variables appropriate fo r analysis of Boolean logic for sc alability. In order to minim ize “analog” noise, we consider a theoretical appr oach f or determining an optimal set for the process parameters to minim ize “analog” noise amplification for gate concatenation. We establish that under optim ized conditions, pr esently studied biochemical gates can be concatenated for up to order 10 processi ng steps. Beyond that, new paradigms for avoiding noise build-up will have to be deve loped. We off er a general discussion of the ideas and possible future challenges for both experimental and theo retical res earch for advancing scalable biochemical computing. Experimental and theor etical stud y of an enzyme-logic AND gate suggests the possibility of a s table operation for several concatenated biocomputing gates, when properly optimized. 2 1. Introduction 1.1. Background. There has been a significant recent interest in the emerging field of chemical computing. 1 Many different chemical systems have been developed to mimic operations of various electron ic elem ents such as logic gates, 2 switches, 3 memor y units 4 (e.g., read-write-erase 5 and flip-flop systems 6 ). Chemical computing systems have been realized in solutions 7 or assembled at chemically m odified interfaces. 8 A composition of chemical information proces sing systems varies from simple signal- responsive molecules or polymers 9 to very sophisticated supra-molecular “m achines” performing complex operations upon m ol ecular translocations of their p arts. 10 Many different external physic al signals, including optical, 11 electronic , 12 magnetic 13 and/or chemical inputs (e.g., variation of pH), 14 were applied to activat e chemical processes mim icking computational operations. It should be noted that most chemical computing systems produce chem ical output signals (products of chemical reactions) and these signals s hould be used as inputs for the next chemi cal computing operation when the individual chemical steps are connected in a complex chemical information processing network. Assemb ling of chemical computing units in multifunctional systems resulted in chemical “devices” perf orming simple arithmetic operations: half-adder/half-subtractor, 15 full-adder/full-subtractor, 16 and mimicking electronic units, e.g., digital demultiplexer 17 and keypad lock. 18 Further increase of complexity of chem ical computing systems has resulted in the integration of single-function “devices ” into complex multi-f unctional computing networks composed of many logic elements. 19 Miniaturization of chemical computing systems should lead to logic gates oper ating at a level of a single molecule 20 allowing for information processing at the nano-scale. 21 Great future potential has been envisaged for chemical computing due to rapid progress in the field. 22 Chemical computing based on biomolecular system s (biocomputing, or biochemical computing) offers exciting prospective applications due to the biocompatibility of biological mate rials and their unique properties 23 as chemical reactants, especially, their specific ity. Biocomputing systems can involve DNA, 24 proteins/enzymes, 25 and whole cells, 26 utilizing their biorecognition, biocatalytic and bioregulation properties. Recently deve loped logic gates based on enzymatic 3 reactions 27,28 utilize the specificity of biocat alytic processes allowing several simultaneous steps in one solution without interference and “cross-talk.” Using the advantages of enzyme-based logic gates, biocom puting “devices” such as a biomolecular half-adder, a half-subtractor 28 and keypad lock 29 were assembled to demonstrate systems with computational functionality composed of several concatenated logic gates. 29,30 1.2. Motivation. With the advent of biochemi cal com puting, it has become important to explore scalabilit y of biochemical logic gates. 31 Error-generation and its reduction by noise minimization have to be explored both experimentally and theoretically. The aim of the pr esent work is to in itiate such a study, on an exam ple of an enzyme-involving AND gate. Biocomputing gates frequently mimic Boolean logic gates. The reason for this has been the expectation that biochem ical logic will ultimately be coupled to ordinary electronics in applications. Furthermore, it is hoped that scalability paradigm s for complex information processing can be adapted from ordinary electronics to bio chemical logic. For definiteness, let u s assume that two chemicals, of concentrations A and B , are the input signals for a reaction that mimics a logic gate and yields the third chemical, of concentration C , as the output signal. We will set the Boolean 0 as zero co ncentrations of all the chemicals, whereas the Boolean 1 values can be selected as som e experimentally convenient (or set by gate concatenat ion, as explained later) values A max , B max and C max . Let us now define the “logic” (dimensionless) concentrations, max / x AA = , max / yB B = , max / zC C = . (1) Of primary interest in Boolean logic are the values of ,, x yz near 0 and 1. However, the biochemical reaction should actually be cons idered for all possible values of the concentrations, and described by a function (, ) zF x y = . (2) This function depends not only on the arguments , x y , but also parametrically on A max , B max , as well as on the reaction time max t , and other biochemical-system param eters, such as various reaction rates. In practice, the function max max max max max max max max max ( , ; , , , ...) ( , ; , , , ...) / ( 1 ,1 ; , , , ...) F xyA B t Cx yA B t C A B t = , (3) 4 will usually not be exactly known but only phenomenologically m odeled and fitted from experimental data, as illustr ate d in Section 3. We note that max max max max ( 1 , 1 ; , , , ...) CC x y A B t == = , and therefore it does not constitute an adjustable parameter. Furthermore, in f itting the function C , the dependence on the first four arguments in equation 3 is simply via the products max max , x Ay B (which are the concentrations , AB ). Therefore, max max , AB are also not adjustable parameters when fitting the reaction kinetics data. The parameters max max , AB only enter when we consider the logic function of the gate in the optimization step. Our aim is to develop, see Section 3, approaches for optimizing the set of values { } max max max , , , ... ABt , where the dots here and in equation 3 refer to reaction parameters, to minimize noi se buildup. One can, of course, consider other optimization ideas, such as redefining not only the logic-1, bu t also allowing for a shift of the logic-0 from the physical zero values of the conc entrations, etc. However, we limit ourselves to the above formulation for defini teness. In fact, if the gate is to be used in concatenation with other gates in a logic circuit, th en the values of max max , AB might be set by the connected pro cesses. Thus, optimizat ion can be carried out only with respect to those parameter combinations that can be changed by varying values from the subset { } max , ... t , assuming that they can be controlled in the available experimental setting. This is illustrated in Section 3. We point out that there can be many s ources of noise in the process considered. The input signals may not be exactly at the l ogic values 0 and 1. Th e output can also have additional noise due to the nature of the reaction : technically, the functio n ( , ) Fx y may actually be probabilistic ally distributed due to a random component in it. However, the main source of possible noise amplification during the biochemical gate function, is simply due to the shape of the function ( , ) Fx y in the vicinity of the four logic argument v a l u e s , ( 0 , 0 ) ,( 0 , 1 ) ,( 1 , 0 ) ,( 1 , 1 ) xy = . Indeed, if the function F has large gradient values near these argument values, then any noi se and fluctuations in the inpu ts , AB will be amplified when m anifesting as noise in the outpu t C . 5 Consider “analog” noise in the output resu lting from sm all fluctuatio ns in the input and controlled by the shape of the gate function. In order to prevent noise amplification when several gates are com bined together, small gradient values are needed near the four “logic” input points. In Na ture this is accomplished by the “sigmoid” response shape. However, for really large-scale so-called fault-tolerant device operation with numerous gates involved, another m ode of noise build-up, termed “digital,” will become important: No matter how narrow are th e statistical distributions of the input signals centered at the “logic” values, and how accurately is the function F realized experimentally, there will always be some, perhaps minute probability of a really large fluctuation in the output, that will randomly yield a wrong logi c (digital) value. In very large scale networks of combined gates, su ch a “digital” m echan ism of error build-up becomes dominant, and additional error corr ection techniques, based on redundancy, and not reviewed here, have to be utilized. 32 Presently biochemical computing is at l east a co uple of orders of magnitude away from the number of combined gates that w ould necessitate “digital” error correction. Thus, in the present paper we exemplify analysis of expe rimental data obtained for a biochemical gate, for minimizing “analog” erro r amplification. The specific biochem ical AND gate considered, was carried out by uti lizing two biocatalysts as inputs: glucose oxidase (GOx) and microperoxidase (MP-11). They catalyzed the following reactions, see Figure 1, GOx 22 2 2 glucose O H O gluconic ac id H O ++ →+ , (4) MP-11 ++ 22 2 HO 2 A B T S 2 H 2 HO 2 A B T S ++ →+ . (5) The actual structures of the compounds involv ed are shown in Figur e 1. The output signal was measured as the concen tration of the oxidized dye, + ABT S , by optical means and defined as the change of the absorbance, A, at a specific wav elength. The outline of the rest of the paper is as follows. In Section 2, we summarize the experimental procedure and results for the bi ochemical AND gate considered. In Section 3, we introduce methods to analyze a gate-f unction for error amplification, and suggest possible approaches for gate op timization. In particular, in Section 3 the experimental data are fitted to yield a f unction of the type of equation 2. Section 4 offers conclusions and avenues for future work. 6 2. Experimental 2.1. Chemicals and reagents. The biocatalysts and other chemicals were purchased from Sigma-Aldrich and used as supplied: glucose oxidase (GOx) from Aspergillus niger type X-S (E.C. 1.1.3.4), micrope roxidase-11 (MP-11) prepared by enzymatic degradation of equine heart cytochrom e c, β -D-(+)-glucose (99.5% GC), 2,2'-azino- bis (3-ethylbenzthiazoline-6-sulphonic aci d) (ABTS). Ultrapure water from NANOpure Diamond (Barnstead) source was us ed in all of the experiments. 2.2. The chemical logic gat e and input signals. The AND gate, see equations 4 and 5, was carried out in an aqueous solution consisting of glucose, 0.1 M, oxygen (initially in equilibrium w ith air), and ABTS, 0.1 mM, in 0.01 M phosphate buffer, pH 5.0, total volum e 1 mL. Soluble GOx and/or MP-11 were used as biocatalytic input signals to activate the AND gate. The absenc e and presence of each biocatalyst was considered as input signals 0 and 1, respectively. The concentrations of the biocatalysts operating as input signals were varied: [GOx] = n × 3.1 × 10 –9 M and [MP-11] = n × 2.7 × 10 –7 M, where n = 0, 1, 2, 3 or 4, in order to map the function F , see equation 2. This yielded 25 data points. When one or both of the inpu ts was equal to 0 (9 experi mental poi nts), there was no significant change in absorban ce at 415 nm . This was considered as an output equal to logic-0. However when both biocatalysts were added to the solution (16 experimental points), a change in the ab sorbance was observed and considered as an output equal to logic-1. 2.3. Measurements. The reaction took place in a 1 mL polyacrylam ide cuvette in 0.01 M phosphate buffer, pH = 5.0, upon add ition of biocatalyst inputs in different combinations, and we measured A at λ = 415 nm after time t max = 145 s as the output signal. A reference cuve tte was filled with th e sam e composition as the test cuvette prior to the addition of the enzyme inputs, thus allowing the differential spectra m easurements corresponding to the changes in the output co m position originating from the bio catalyzed reactions. The absorbance measurem ents were performed using a UV-2401PC/2501PC UV-visible spectrophotometer (Shimadz u, Tokyo, Japan) at 25±2 °C. 2.4. Experimental results. The chemical logic gate m imicking Boolean AND was initiated in a solution containing gluc ose, oxygen and ABTS. Biocatalytic oxidation of ABTS resulted in the increased abso rbance of the solution in the range of λ = 7 400-440 nm: A was measured at λ = 415 nm. 33 ABTS is oxidized only in the presence of MP-11 as the biocatalytic input and H 2 O 2 as the oxidizer. The latter was produced in situ by another biocatalytic reaction due to GOx . Figure 1 shows a general scheme of the biocatalytic reactions involved in the operation of this logic gate. In the absence of the biocatalysts (input signal 0,0) or upon addition of any of the two of them, GOx or MP-11, separately (input signals 0,1 or 1,0) the system does not oxid ize ABTS, and the solution does not yield an appreciable absorbance change , see Figure 2(A), curves a,b,c. It should be noted that the addition of MP-11 as an input signal yields an absorbance band at λ max = 397 nm as the result of the abso rbance of the heme group in MP-11, 34 see Figure 2(A), curve b. This introduces a minor interfer ence with the absorb ance generated upon the biocatalytic oxidation of ABTS. Only the addition of both biocatalysts, GOx and MP-11 (input signal 1,1), results in the formation of H 2 O 2 and then in the oxidation of ABTS yielding the large absorb ance change, Figure 2(A), curve d. The observed output signals, A, correspond to the “truth table” of the AND logic gate, s ee Figure 2(B). Note that the data in Figure 2 corresponds to the input “intensity” n = 4 (the logic-1, as defined in Subsection 2.2) for both biocatalysts. The full set of our experimental data is given in Figure 3. These data were used to map out the function defined in equation 2, as detailed in Section 3. 3. Reaction Kinetics and Gate Optimization 3.1. Reaction kinetics. In order to map out the f unction F defined in equation 2, we first model the reaction kine tics of the processes summari zed in equations 4, 5. Our aim is to use a phenomenological rate-equati on description that involves a rela tively small number of (one or two) adjustable para meters. The reason for the latte r is that typical data that map 35 a biochemical “input-output surfac e”, such as shown in Figure 3, are not accurate enough for a multi-p arameter fit. In fact, the strategy in System s Biology has been similarly pragm atic: the use of phenomenological few-variable Hill f unctions. 36 Let us start with the ra te equation for the concentra tion of O 2 , to be denoted by O ( t ), where t is the time variable. The reaction contai ner was sufficiently small to neglect spatial variation of concentra tions of the com ponents due to external factors. However, the supply of oxygen by transport through the su rface is relatively slow and constitutes a 8 rate-limiting process. W ith 4 2.7 10 O − =× M denoting the equilibrium value for room temperature, 37 we obtain () 12 dO R OO R A O dt =− − , with (0 ) Ot O = = . (6) where 1 / R SV =Ω , S and V are the surface area and volum e of the solution, respectively, equal to 61 .1 mm 2 and 1.0 mL for the experim ent described above. The quantity Ω stands for the oxygen mass transfer coefficient in the surface layer, 3 1.3 10 − Ω= × mm/s, where among the published values 38,39 we took the one 39 measured under the conditions of prim arily diffusional, without the added convection-m ediated, transport. Note that, via its geometry dependence, 1 R could be used as one of the tunable parameters for gate function optimization. Recall that A = [GOx], and for the purpose of calculating the time-dependent kinetics, this concentration is a constant. Since the concentr ation of glucose in our case was always in great access for logic-1, we did not use a Michaelis-Menten type description 40 of the biocatalytic action of GOx, equation 4. Furthermore, the concentration of glucose did not change appr eciably during the react ion. Therefore, we use the simple form shown for the second, oxygen-consumption term in equation 6. We point out that 2 R will be a constant to be fitted from the data. Furthermore, in the regime of applicability of the present rate-eq uation desc ription, this param eter is also controlla ble to some degree for gate function optim iza tion. In particu lar, it will depend on the concentration of glucose. Let us now consider the concentrati on of hydrogen peroxide, to be denoted by 22 () [ HO ] Wt = , with ( 0) 0 W = . We also recall that C ( t ) = [ ABTS + ], C (0) = 0, and B = [MP-11]. We will use th e rate equations 23 dW R AO R BW dt =− , (7) 3 2 dC R BW dt = . (8) Here again, in order to keep the number of fit parameters do wn to two, we did not use a Michaelis-Menten type descripti on of the biocatalytic action of MP-11, equation 5. This 9 entails an assumption of acces s of 22 H O (when it is produced by the first reaction of the gate function), which seems to hold in the pr esent range of experim ental conditions, as confirmed a posteriori by the fact that our model fits the data. Furtherm ore, the amount of the dye (ABTS) oxidized in the reaction is only a sm all fraction of the initial concentration. Therefore, we ignore the variation of [ABTS] with tim e. Thus, 3 R will be the second constant to be fitted from the data, and it can also be tuned for gate optimization, sim ilarly to 2 R . Specifically, 3 R will depend on the concentration of ABTS. 3.2. The gate function. It is convenient to work with dimensionless combinations of variables, 21 / aR A R ≡ , 31 / bR B R ≡ , 1 R t ς ≡ , (9) () ( ) / oO t O ς ≡ , () ( ) / wW t O ς ≡ , () ( ) / cC t O ς ≡ . (10) The system of differential equa tions to solve is then () /1 do d o ao ς =− − , with (0 ) 1 o ς = = , (11) / dw d ao bw ς =− , with (0 ) 0 w ς = = , (12) /2 dc d bw ς = , with (0 ) 0 c ς = = . (13) The solution is () () () 2 1 21 2 2 (, , ) 1 1 11 1 1 1 a b aa ba a cab e e ab a b b a a a ς ς ς ς −+ − =− + − + − + +− − − − + + . (14) Note that this expression is sim ply a result for the function 12 3 (, ; , , , , ) CA B O t R R R , written in a dimensionless notatio n. The first pair of argum ents are the actual variables, which were experi m entally varied over a set of 25 pairs of values, as detailed in Secti on 2. The parametric dependenc e involves the known values of t , which will be set to max t , and 1 , OR , which are both known from the literature, as well as the two unknown parameters 23 , R R . The last datum of inform ation needed was the conversion factor from the measur ed deviation in the absorbance, A, and the concentration of the oxidized dye, C . We used C = A×2.7 × 10 –5 M, taking into account 10 the extinction coefficient of ABTS + at 415 nm and the optical path length of 1 cm in our experiment. 33 With all this information collec ted, we then used a least-squares fit to obtain estimates for the two unknown parameters, 6 2 4.7 10 R =× M –1 s –1 , 2 3 1.3 10 R =× M –1 s –1 . The estimated accuracy is app roximately 10% in both rate constants . The resulting “input-output surface” is shown in Figure 4(A), in terms of A, with the experim ental data points included. Locally, espe cially for small A, the quality of the fit for each individual point is not especially high, but for gate optimization we need a sem i- quantitatively valid fit that captures the expected features of the function ( , ; ...) Fx y , ultimately in various limits and over a re levant range of its arguments and tu nable parameter values. Finally, for the gate function, e quation 2, we get the expression (, , ) (, ) (, , ) cx y Fx y c α βτ α βτ = , (15) where the dependence on several parameters was conveniently lumped into three dimensionless variables, 2m a x 1 / R AR α = , 3m a x 1 / R BR β = , 1m a x R t τ = . (16) In fact, our experimental conditions and results of the data fit correspond to 746 α = , 1.79 β = , and 0.0115 τ = . The properties of the gate function with these pa rameter values are shown in Figure 4(B). All three parameters, , , α βτ can be modified if required for gate function optimization wi thout affecting the values of max max , AB . 3.3. Optimization of the logic gate. The fitted g ate function shown in the inset in Figure 4(B) significantly am plifies errors. This is specifically relevant at the logic-input 0 x = ,1 y = . Indeed, plots of the absolute values of the gradients of the function along various lines, in Figure 4(B), suggest that small deviations away from the line 0 x = in the xy -plane will be amplified by a f actor of up to approximately 4.84. Thus, param eter optimization could involve reduction of the grad ient near logic-01, pe rhaps at the expense of allowing for larger gradie nts at other logic-points. The inputs x and y during the gate function fall n ear a logic point. Nevertheless, they are not set precisely: rather, th ere will be some probability distributions, () X x and 11 () Yy near the logic valu es, 0 x = or 1, and 0 y = or 1. As a result, the output density will also be distributed, accordi ng to the dis tribution function ( ) Z z , given by () ( ) ( ) dS Z zd z d x d y X x Y y = ∫ . (17) Here the integration over dS covers the area in the x y plane that corresponds to the values of ( , ) zF x y z d z << + , as illustrated in Figure 5. Technically, the distribution Z ( z ) will depend on which of the four logic-pairs of x , y values was inputted. From equation 17, we get the mom ents expression, [ ( , )] ( ) ( ) mm zd x d y F x y X x Y y 〈〉 = ∫ . (18) Here ... 〈〉 denotes averaging with respect to ( ) Z z . To estimate the noise propagation, we investigate the width of the output distribution, out σ , as compared to the width of the input distributions, in σ , where the latter were, for simplicity, ass umed the same for both x and y inputs. Ordinarily in studie s of noise effects one assume s that all distributions are approximately Gaussian: we took the (h alf-)Gaussian shape of the input, () 22 2 in in () 2 e x p 2 2 Xx x σ πσ =− , at logic-0, and ( ) 22 2 in in () e x p ( 1 ) 2 2 Xx x σ πσ =− − at logic-1, with the same expressions for ( ) Yy . Therefore, for approximately symmetric distributions one can use the standard deviation (dispersion) definition, 22 out zz σ =〈 〉− 〈 〉 (for logic-1), (19) and similarly for in σ . However, for values of x , y , z near the logic-0, the distributions are not centered. They are approximately half -Gaussian because nega tive values are not possible. For these logica l points we use instead 2 out z σ =〈 〉 (for logic-0), (20) and similarly for in σ . Let us define { } m a x 0 0,0 1 , 1 0, 11 o ut max σσ = . (21) Ideally, to optim ize a gate, we should calculate the ra tios out in / σ σ at all four logic points and make the largest of these ratios, max in / σ σ , as small as possible, definitely under 1, by 12 adjusting the tunable parameters. However, this is not always practic al, and for m any gate functions is not actually mathem atically possibl e. In fact, for our present gate function we can at best get the largest ratio signif icantly closer to 1 (but still > 1) than we had for the original experim ental parameter values. This will become apparent f rom the derivation given below. To simplify the calcula tions, we utilized some specific properties of our gate function. In particular, for both α and β large enough, the expression for F can be shown to be approximately symmetric in α β ↔ . Our preliminary numerical studies have indicated that the near-optimal para meters should be close to this symmetric situation. This is indeed suggestive b ecause making α β >> or α β < < would unbalance the gradients of ( , ) Fx y near points 01 and 10, making one very small at the expense of the other becoming very large. In fact, our original experim ental conditions are in the regime α β >> , as can be seen in Figure 4. Thus, we can seek optimal conditions with the assumption that α β = , which reduces the number of tunable parameters from 3 to 2. In Figure 6, we plot () () out out at 01 or 10 at 11 σσ σ ∆= − , (22) as a function of α and τ . The inset shows the variation of max in / σ σ in the α τ -plane. The two quantities attain mini mum along the same curve, ( ) τ α , which corresponds to the condition () () out out at 01 or 10 at 11 σσ = . This curve is not sensitive to the values of in σ , while the value of max in / σ σ along the curve is approximately 2 in 1.18 0.29 σ + (for small in σ ). The fact that max σ and σ ∆ attain minimum along the same line for our specific gate function, equation 15, is not surprising, because the balance of the gradients ne ar the logic points 01 or 10, vs. that of 11, is determined by the ove rall degree of convexity of the gate-function cross-sections at fixed x (for 10 vs. 11) and fixed y (for 01 vs. 11). At the same time, for 1 α β => > , the convexity (curvature) is controlled by the exponents of the type () exp x α τ − , in the numerator of equation 15. Therefore the optim ization determines the combination α τ , rather than α or τ separately, leading to the relation of the form const α τ = . By numerical optimization, we found 13 1.94 / α βτ == , (23) with high numerical accuracy, see Figure 6. This re sult determines the optimal valu es of the biocatalytic reaction rate constants ( 23 , R R ) vs. the reaction time. The oxygen intake rate ( 1 R ) actually cancels out in the product α τ . However, varying it m ay be helpful in keeping the process param eters within the range of validity of simplified rate-equation approximations. Let us now discuss the quality of the re sulting optim ized gate function. It is interesting to compare the probability distri butions of input and output for the optimized and our experimentally realized parameter se ts. The output distribution can be calculated form the input distributions via the relation 2 0 () () ( ) () 1 (, ) yy x Xx Y y FF Zz d x xy Fx y ∞ → ∂∂ =+ ∂∂ ∇ ∫ , (24) with ( ) yy x = defined by the fixed- z cross-section, see Figure 5: ( , ) zF x y = . The distributions corresponding to the experimentally reali zed and optimized gates are illustrated in Figure 7 for inputs 01 and 11. For the “worst-case s cenario” input 01, the original gate has a large amplif ication by the factor up to 4.8 4. For the optim ized gate the noise amplification is significantly reduced, ap proxim ately four-fold as compared to the original gate. However, it is still amplification, at both input s 01, 11, and also at input 10 (not shown in the figure), by about 18% per gate function. 4. Conclusions and Discussion In this work, our experimental data for a biochemical gate was modeled within the rate-equation approach. The resu lting rate equations were solved, and the solution was cast in the language of Boolean logic va riables. Generally, one can use other phenomenological approaches to map out th e “input-outpu t surface. ” Next, the Boolean inputs and output were treated as analog signals in the context of gate-function optimization. W e illustrated a procedure f or determining an optimal set f or the process parameters, to minimize “analog” no ise amplification. We point out that our original experiment al conditions turned out to be quite far from optimal. Our values for the param eter co mbinations that have to be approximately 14 equal under optimal conditions, nam ely , 1.94 / , α τβ , were actually 746, 169, 1.79, respectively. Furthermore, even under the optimal conditions, the present gate function would somewhat amplify “analog” noise. Theref ore, a posteriori we have considered it not very useful or illuminating to try to real ize the optim al conditions for this particular gate experimentally, especially given the la rge changes in the param eters required. Instead, we prefer to address, below , criteria and avenues for future work that could lead to more promising biochem ical grate realizat ions that would allow large-sca le network realizations. Specifically, let us assume that a biochem ical “circuit” operates in an environment with 5% noise levels, and th at we def ine the tolerance level for the f inal output (to unambiguously identify 0 or 1) by excluding the middle 1/3 of the interval [0,1]. Then, just two concatenated processing steps with the noise amplification of our original gate will produce too noisy an output to be useful . However, for the optimized conditions we can concatenate gates for up to p processing steps, with the estim ate 5% ( 1.18) 33% p ×= yielding approximately 11. p = Thus, one can carry out up to order 10 processing steps which is presently safely over the number of concatenated gates in experimentally realized situations. 29,30 Longer-term, however, the problem of “an alog” noise reduction in biochemical logic should be considered within a broader context: Our present study has identified the source of the difficulty as follows. Gate opt imization involves modification of the gate function, z = F ( x , y ), which changes the slope of various cross-sections of this function, some of which were marked in Figure 4(B) . Consider the logical input point 01, for instance. In its vicinity, one of the chemicals, B , is abundant, but another, A , is present in small concentrations (near zero ). Thus, the output intensity is sim ply linear in A , along cross-sections that originate near this point. As sketched in Figure 8(A), for larger concentrations of A in our case the cross-section func tion flattens out (convex function) because the activity of A is decreased due to the require d cooperative effect with the “ B ” part of the gate function. Optim ization decreases the slope at A = 0 but at the expense of having a larger slope at A = 1. If instead A has an “autocatalytic” (self-promoter) prop erty (concave function), illustra ted in Figure 8(B) , then we would be faced with a sim ilar balancing problem. 15 The standard “way out” of the difficulty is to seek gates with the sigmoid shape of all relevant cross-sections. Such a curve, with its curvature (the second derivative) changing sign from positive to nega tive, is shown in Figure 8(C). In fact, in Figure 4(B) the middle cross-section curve marked, is actually sigm oid (which resulted in the input near 00 not being involved the “gradient balanc ing” in our optimization), but the two side cross-sections are convex. In the context of biochem ical logic the simplest way to advance from a convex case to a sigmoid could be to have some additio nal process that, instead of decreasi ng the activity of A , simply consumes (deactivates) som e of the chemical A , but at a rather limited rate or mo stly at low concentrations of A . Similar to mechanisms recently identified in connection wi th protein functions in g enetic circuits, 41 such processes could compete with the “log ic -function” processes an d potentially yield a sigmoid response. A similar “rem oval from the game” should also be designed f or the second input, B . Of course, this approach was not yet tested, and other mechanisms could be more appropriate. Finally, in the future it is desirable to focus on those gates that were already realized as a part of concatenated-gate biochemi cal logic system s. It is best to work with gates that allow for a simple theoretic al model, applicable for a wide r ange of parameters. We expect that candidate gates will function with enzymes and/or enzym e-derived biocatalysts as the “machinery” rather than as in puts. Indeed, simpler chemicals as inputs (and outputs) might offer more flexibility in add ressing the aforementioned criteria. Acknowledgements. We gratefully acknowledge support of our research programs by the National Science F oundation under grants CCF-0726698 and DMR- 0706209. GS acknowledges Wallace H. Coulter scholarship from Clarkson University. VP wishes to thank Center for Theoretical Biol ogical Phys ics at University of California, San Diego, for hospitality during the Summer 2007 Workshop “Biological Dynam ics of Cellular Processes.” 16 References 1. a) Adamatzky, A.; De Lacy Costello, B.; Asai, T. Reaction-Diffusion Computers , Elsevier Science, Amsterdam, 2005 . b) Teuscher, C.; Adamatzky, A. (Eds.), Unconventional Computing 2005: From Cellular Automata to Wetware , C. Luniver Press, Beckington, UK, 2005 . c) Dittrich P. Lect. Notes Computer Sci. 2005 , 3566 , 19-32. d) Hjelmfelt, A.; Ross, J. Physica D 1995 , 84 , 180-193. e) Najmabadi, P.; La Clair, J.J.; Burkart, M.D. Org. Biomol. Chem. 2007 , 5 , 2140- 222. f) Adamatzky, A.; De Lacy Costello, B.; Phys. Lett. A 2003 , 309 , 397-406. 2. a) De Silva, A.P.; Uchiyam a, S. Nature Nanotechnol. 2007 , 2 , 399-410. b) Magri, D.C.; Brown, G.J.; McClean, G.D.; De Silva, A.P. J. Am. Chem. Soc. 2006 , 128 , 4950-4951. c) Straight, S.D.; Andreass on, J.; Kodis, G.; Bandyopadhyay, S.; Mitchell, R.H.; Moore, T.A.; Moore, A.L.; Gust, D. J. Am. Chem. Soc. 2005 , 127 , 9403-9409. 3. a) Feringa, B.L. Molecular Switches , Wiley-VCH, W einheim, 2001 . b) Katz, E.; Shipway, A.N.; Willner, I. In: Photoreactive Organic Thin Films , S. Sekkat, W. Knoll (Eds.), Academic Press, 2002 , Chapter II-7, pp. 219-268. c) Zhao, L.Y.; Hou, Q.F.; Sui, D.; Wang, Y.; Jiang, S.M. Spectrochim. Acta A 2007 , 67 , 1120- 1125. d) Giordani, S.; Cejas, M.A.; Raymo, F.M. Tetrahedron 2004 , 60 , 10973- 10981. e) Raymo, F.M.; Giordani, S.; W hite, A.J.P.; Williams, D.J. J. Org. Chem. 2003 , 68 , 4158-4169. f) Raymo, F.M.; Giordani, S. Proc. Natl. Acad. Sci USA 2002 , 99 , 4941-4944. g) Katz, E.; Willner, I. Angew. Chem. Int. Ed. 2005 , 44 , 4791-4794. h) Gill, R.; Patolsky, F.; Katz, E.; Willner, I. Angew. Chem. Int. Ed. 2005 , 44 , 4554-4557. 4. a) Shipway, A.N.; Katz, E.; Willner, I. In: Structure and Bonding , J.-P. Sauvage (Ed.), Springer-Verlag, Berlin, 2001 , Vol. 99, pp. 237-281. b) Tomizaki, K.Y.; Mihara, H.; J. Am. Chem. Soc. 2007 , 129 , 8345-8352. c) Guo, Z.Q.; Zhu, W.H.; Shen, L.J.; Tian, H. Angew. Chem. Int. Ed. 2007 , 46 , 5549-5553. d) Tsivgoulis, G.M.; Lehn, J.-M. Angew. Chem. Int. Ed. 1995 , 34 , 1119-1122. 5. a) Katz, E.; Willner, I. Chem. Commun. 2005 , 5641-5643. b) Pina, F.; Roque, A.; Melo, M.J.; Maestri, I.; Belladelli, L.; Balzani, V. Chem. Eur. J. 1998 , 4 , 1184- 17 1191. c) Areephong, J.; Browne, W.R.; Katsonis, N.; Feringa, B.L. Chem. Commun. 2006 , 3930-3932. d) Pina, F.; Lima, J.C.; Parola, A.J.; Afonso, C.A.M. Angew. Chem. Int. Ed. 2004 , 43 , 1525-1527. 6. a) Baron, R.; Onopriyenko, A.; Katz, E. ; Lioubashevski, O.; W illner, I.; Wang, S.; Tian, H. Chem. Commun. 2006 , 2147-2149. b) Kim, W.; Hardcastle, K.I.; Conticello, V.P. Angew. Chem. Int. Ed. 2006 , 45 , 8141-8145. 7. a) Pina, F, Melo, M.J.; Maestr i, M.; Passaniti, P.; Balzani, V. J. Am. Chem. Soc. 2000 , 122 , 4496-4498. b) Credi, A.; Balzani, V. ; Langford, S.J.; Stoddart, J.F. J. Am. Chem. Soc. 1997 , 119 , 2679-2681. c) Zong, G.Q.; Xian, L.; Lu, G.X. Tetrahedron Lett. 2007 , 48 , 3891-3894. d) Straight, S.D.; Liddell, P.A.; Terazono, Y.; Moore, T.A.; Moore, A.L.; Gust, D. Adv. Funct. Mater. 2007 , 17 , 777-785. 8. a) Li, L.; Yu, M.X.; Li, F.Y.; Yi, T.; Huang, C.H. Colloids Surf. A 2007 , 304 , 49- 53. b) Wen, G.Y.; Yan, J.; Zhou, Y.C.; Zhang, D.Q.; Mao, L.Q.; Zhu, D.B. Chem. Commun. 2006 , 3016-3018. c) Li, F.Y.; Shi, M.; Huang, C.H.; Jin, L.P. J. Mater. Chem. 2005 , 15 , 3015-3020. 9. a) Raitman, O.A.; Katz, E.; W illner, I.; Chegel, V.I.; Popova, G.V. Angew. Chem. Int. Ed. 2001 , 40 , 3649-3652. b) Gunnlaugsson, T.; Mac Donail, D.A.; Parker, D. Chem. Commun. 2000 , 93-94. 10. a) Zhou, W .D.; Li, J.B.; He, X.R.; Li, C.H.; Lv, J.; Li, Y.L.; Wang, S.; Liu, H.B.; Zhu, D.B. Chem. Eur. J. 2008 , 14 , 754-763. b) De Silva, A.P.; Uchiyama, S.; Vance, T.P.; Wannalerse, B. Coord. Chem. Rev. 2007, 251, 1623-1632. c) Flood, A.H.; Ramirez, R.J.A.; Deng, W.Q.; Mulle r, R.P.; Goddard, W.A.; Stoddart, J.F. Austr. J. Chem. 2004 , 57 , 301-322. d) Katz, E.; Lioubashevsky, O.; Willner, I. J. Am. Chem. Soc. 2004 , 126 , 15520-15532. e) Willner, I.; Pardo-Yissar, V.; Katz, E.; Ranjit, K.T. J. Electroanal. Chem. 2001 , 497 , 172-177. 11. a) Perez-Inestrosa, E.; Montenegro, J.M.; Collado, D.; Suau, R.; Casado, J.; J. Phys. Chem. C 2007 , 111 , 6904-6909. b) Fang, C.J.; Zhu, Z.; Sun, W .; Xu, C.H.; Yan, C.H. New J. Chem. 2007 , 31 , 580-586. c) Sadhu, K.K.; Bag, B.; Bharadwaj, P.K. J. Photochem. Photobiol. A 2007 , 185 , 231-238. d) Szacilowski, K.; Macyk, W.; Stochel, G. J. Am. Chem. Soc. 2006 , 128 , 4550-4551. e) Biancardo, M.; 18 Bignozzi, C.; Hugh, D.C.; Redmond, G. Chem. Commun. 2005 , 3918-3920. f) Kume, S.; Nishihara, H. Structure and Bonding 2007 , 123 , 79-112. 12. a) Zhou, Y.C.; Wu, H.; Qu, L.; Zhang, D.Q.; Zhu, D.B. J. Phys. Chem. B 2006 , 110 , 15676-15679. b) Mendes, P.M.; Flood, A.H.; Stoddart, J.F. Appl. Phys. A 2005 , 80 , 1197-1209. c) Hiratsuka, M.; Iked a, S.; Aoki, T.; Higuchi, T. IEICE Trans. Electron. 2004 , E87C , 1804-1808. d) Pease, A.R.; Jeppesen, J.O.; Stoddart, J.F.; Luo, Y.; Collier, C.P.; Heath, J.R. Acc. Chem. Res. 2001 , 34 , 433- 444. 13. Vasilyev, S.; Pita, M.; Katz, E. Electroanalysis 2008 , 20 , 22-29. 14. a) Credi, A.; Balzani, V.; Langford, S.J.; Stoddart, J.F. J. Am. Chem. Soc. 1997 , 119 , 2679-2681. b) Wang, Z.X.; Zheng, G.R.; Lu, P. Org. Lett. 2005 , 7 , 3669- 3672. c) Nishimura, G.; Maehara, H.; Shiraishi, Y.; Hirai, T. Chem. Eur. J. 2008 , 14 , 259-271. 15. a) Pischel, U. Angew. Chem. Int. Ed. 2007 , 46 , 4026-4040. b) Andreasson, J.; Straight, S.D.; Kodis, G.; Park, C.-D.; Hambourger, M.; Gervaldo, M.; Albinsson, B.; Moore, T.A.; Moore, A.L.; Gust, D. J. Amer. Chem. Soc. 2006 , 128 , 16259- 16265. c) Liu, Y.; Jiang, W.; Zhang, H.-Y.; Li, C.-J. J. Phys. Chem. B 2006 , 110 , 14231-14235. c) Sun, W.; Zheng, Y.-R.; Xu , C.-H.; Fang, C.-J.; Yan, C.-H. J. Phys. Chem. C 2007 , 111 , 11706-11711. d) Suresh, M.; Ghosh, A.; Das, A. Tetrahedron Lett. 2007 , 48 , 8205-8208. e) Qu, D.H.; Wang, Q.C.; Tian, H. Angew. Chem. Int. Ed. 2005 , 44 , 5296-5299. 16. a) Kuznetz, O.; Salman, H.; Shakkour, N.; Eichen, Y.; Speiser, S. Chem. Phys. Lett. 2008 , 451 , 63-67. b) Margulies, D.; Melman, G.; Shanzer, A. J. A m. Chem. Soc. 2006 , 128 , 4865-4871. 17. Andreasson, J.; Straight, S.D.; Bandyopadhyay, S.; Mitchell, R.H.; Moore, T.A.; Moore, A.L.; Gust, D. J. Phys. Chem. C 2007 , 111 , 14274-14278. 18. Margulies, D.; Felder, C.E.; Melman, G.; Shanzer, A. J. Am. Chem. Soc. 2007 , 129 , 347-354. 19. a) Ashkenasy, G.; Ghadiri, M.R. J. Am. Chem. Soc. 2004 , 126 , 11140-11141. b) Szacilowski, K. Chem. Eur. J. 2004 , 10 , 2520-2528. 19 20. a) Stad ler, R.; Ami, S.; Joachim , C.; Forshaw, M. Nanotechnology 2004 , 15 , S115-S121. b) Raymo, F.M.; Giordani, S. J. Am. Chem. Soc. 2001 , 123 , 4651- 4652. c) Liu, Y.; Jiang, W.; Zhang, H.Y.; Li, C.J. J. Phys. Chem. B 2006 , 110 , 14231-14235. 21. De Silva, A.P.; Leydet, Y.; Li ncheneau, C.; McClenaghan, N.D. J. Physics 2006 , 18 , S1847-S1872. 22. Bell, G.; Gray, J.N. In: Beyond calculation: the next fifty years of computing , P.J. Denning, R.M. Metcalfe, (Eds.), Chap. 1, p. 30, Copernicus/Springer, NY, 1997 . 23. Shao, X.G.; Jiang, H.Y.; Cai, W.S. Prog. Chem. 2002 , 14 , 37-46. 24. a) M.N. Stojanovic, D. Stefanovic, T. LaBean, H. Yan, In: Bioelectronics: From Theory to Applications , I. Willner, E. Katz (Eds.) , W iley-VCH, Weinheim , pp. 427-455, 2005 . b) Frezza, B.M.; Cockroft, S.L.; Ghadiri, M.R. J. Am. Chem. Soc. 2007 , 129 , 14875-14879. c) Ogasawara, S.; Kyoi, Y.; Fujimoto, K. ChemBioChem 2007 , 8 , 1520-1525. d) Yoshida, W.; Yokobayashi, Y. Chem. Commun. 2007 , 195-197. e) Seelig, G.; Soloveichi k, D.; Zhang, D.Y.; Winfree, E. Science 2006 , 314 , 1585-1588. f) Stojanovic, M.N.; M itchell, T.E.; Stefanovic, D. J. Am. Chem. Soc. 2002 , 124 , 3555-3561. g) Ezziane, Z. Nanotechnology 2006 , 17 , R27-R39. h) Macdonald, J,; Li, Y.; Su tovic, M.; Lederm an, H.; Pendri, K.; Lu, W.; Andrews, B.L.; Stef anovic, D.; Stojanovic M.N. Nano Lett. 2006 , 6 , 2598-2603. 25. a) R. Unger, J. Moult, Proteins 2006 , 63 , 53-64. b) Tomizaki, K.Y.; Mihara, H. J. Am. Chem. Soc. 2007 , 129 , 8345-8352. c) Gianneschi, N.C.; Gha diri, M.R. Angew. Chem. Int. Ed. 2007 , 46 , 3955-3958. d) Muramatsu, S.; Kinbara, K.; Taguchi, H.; Ishii, N.; Aida, T. J. Am. Chem. Soc. 2006 , 128 , 3764-3769. 26. a) M.L. Simpson, G.S. Sayler , J.T. Fleming, B. Applegate, Trends Biotechnol. 2001 , 19 , 317-323. b) Rinaudo, K.; Bleris, L.; Maddamsetti, R.; Subramanian, S.; Weiss, R.; Benenson, Y. Nature Biotechnol. 2007 , 25 , 795-801. 27. a) Baron, R.; Lioubashevski, O.; Katz, E.; Niazov, T.; Willner, I. Org. Biomol. Chem. 2006 , 4 , 989-991. b) Baron, R.; Lioubashevski, O.; Katz, E.; Niazov, T.; Willner, I. Angew. Chem. Int. Ed. 2006 , 45 , 1572-1576. c) Pita, M.; Katz, E. J. Am. Chem. Soc. 2008 , 130 , 36-37. 20 28. Baron, R.; Lioubashevski, O.; Katz, E.; Niazov, T.; Willner, I. J. Phys. Chem. A 2006 , 110 , 8548-8553. 29. Niazov, T.; Baron, R.; Katz, E.; Lioubashevski, O.; Willner, I. Proc. Natl. Acad. USA. 2006 , 103 , 17160-17163. 30 Strack, G.; Ornatska, M.; Pita, M.; Katz, E. J. Am. Chem. Soc. 2008 , in press (10.1021/ja7114713). 31. Fedichkin, L.; Katz, E.; Privman, V. J. Comp. Theor. Nanosci. 2008 , 5, 36-43. 32. a) Pretzel, O. Error-Correcting Codes and Finite Fields , Oxford University Press, Oxford, 1992 . b) Wakerly, J.F. Digital Design. Principles and Practices , 4 th edition. Pearson Prentice Hall, London, 2005 . 33. a) Bergmeyer, H.U. (Ed.), Methods of Enzymatic Analysis , 3 rd ed., Vol. 3, Verlug Chemie, Deerfield Beach, FL, pp. 286-293, 1983 . b) Solís-Oba, M.; Ugalde- Saldívar, V.M.; González, I.; Vinieg ra-González, G. J. Electroanal. Chem. 2005 , 579 , 59-66. c) Childs, R.E.; Bardsley, W.G. Biochem. J. 1975 , 145 , 93-103. 34. Adams, P.A. In: Peroxidases in Chemistry and Biology , Everse, J.; Everse, K.E.; Grisham, M.B. (Eds.), CRC Press, Boca Raton, Vol. 2, Ch. 7, pp. 171-200. 35. Setty, Y.; Mayo, A.E.; Surette, M.G.; Alon, U. Proc. Natl. Acad. USA. 2003 , 100, 7702-7707. 36. Alon, U. An Introduction to Systems Biology. Design Principles of Biological Circuits , Chapman & Hall/CRC Press, Boca Raton, Florida, 2007 . 37. Truesdale, G.A.; Down ing, A.L. Nature 1954 , 173 , 1236-1237. 38. a) Lee M. Water Research 2002 , 36, 2140-2146. b) Schladow S.G.; Lee M.; Hiirzeler B.E.; Kelly P. B. Limnol. Oceanogr. 2002 , 47, 1394-1404. 39. Mölder E.; Mashirin A.; Tenno T. ESPR–Environ Sci. & Pollut. Res. 2005 , 12, 66-70. 40. Schulz, A.R. Enzyme Kinetics. From Diasta se to Multi-Enzyme Systems , Cambridge University Press, Cambridge, 1994 . 41. Buchler, N.E.; Gerland, U.; Hwa, T. PNAS 2005 , 102, 9559-9564. 21 Figure 1 . Schematic representation of the AND logic gate operating with the two soluble biocatalysts, GOx and MP-11, as the input signals. 22 Figure 2. (A) Spectral features of the AND gate 145 seconds after the input signals: a) “0,0” – without additions of GOx and MP-11; b) “0,1” – after the addition of MP-11, 1.08 × 10 –6 M; c) “1,0” – after th e addition of GOx, 1.24 × 10 –8 M, d) “1,1” – after the addition of GOx, 1.24 × 10 -8 M and MP-11, 1.08 × 10 –6 M. (B) Bar chart of the ab sorbance-deviation outputs at λ = 415 nm. The inset shows the “t ruth table” for the AND gate. 23 Figure 3. Experimental data points shown fo r various input va lues studied: Th e biocatalysts, MP-11 and GOx, when not present in the system corresponded to logic-0 concentrations. Inputs e qual to logic-1 were studied for concentrations n = 1, 2, 3 or 4 times 3.1 × 10 –9 M for GOx, and 2.7 × 10 –7 M for MP-11. The input axes are labeled by the respective n- values. The different concentrations we re combined and then measured for absorbance-deviation output at = 415 nm. 24 Figure 4 . (A) The output signal as a function of input concen trations: our theoretical fit to the experimental d ata points. The experimental points are shown by empty circles when below the function surface. The RMS deviation for the fit is 0.017. (B) Absolute value of th e gradient along thre e cross-sections: 01-11 (dashed curve), 00-11 (dash-doted curve), 01-11 (solid line). The inset shows the gate function in te rms of the lo gic variables, with the three cross-sections shown schematica lly by the green dashed lines. 25 Figure 5 . Schematic of the conservation of probability for a ga te function: the constant- z levels are shown in the xy -plane as a contour plot. 26 Figure 6 . Contour plot of the value of σ ∆ as a function of ( ) α β = and τ . The dashed red line shows the optim um param eters, corresponding to 0 σ ∆= , which also corresponds to the minimum of max σ , see the inset. Here in 0.1 σ = , however the optimization line ( 0 σ ∆ = ) is not sensitive to the value of the input dispersion and has the form 1.94 / α βτ = = . 27 Figure 7 . Input and output probab ility distributions for the AND-gate logic action 01 0 (solid curves) and 11 1 (dashed curves). The half-Gaussian probability distribution near the input value 0 and the Gaussian distribution near the input value 1, are shown — black curves; both have in 0.1 σ = . For the experimentally reali zed gate — red curves — the resulting one-sided distributi on near the output 0 (for 01 0) is very broad. Even for the optimized gate — blue curves — both output distributions are also somewhat broadened as compared to the input distributions. 28 Figure 8. Illustration of the (A) convex; (B) concave; and (C) sigmoid shapes of cross-section curves on th e “input-output surface,” of the type encountered in Figure 4(B).
Original Paper
Loading high-quality paper...
Comments & Academic Discussion
Loading comments...
Leave a Comment