Phase diagram of the hardcore Bose-Hubbard model on a checkerboard superlattice
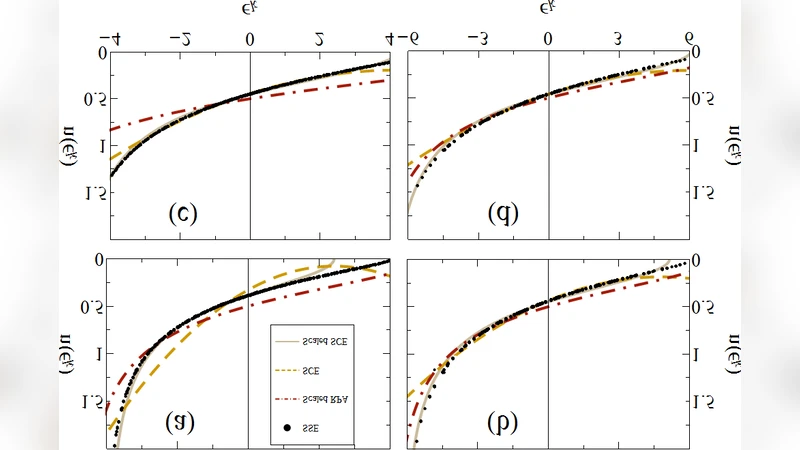
We obtain the complete phase diagram of the hardcore Bose-Hubbard model in the presence of a period-two superlattice in two and three dimensions. First we acquire the phase boundaries between the superfluid phase and the `trivial’ insulating phases of the model (the completely-empty and completely-filled lattices) analytically. Next, the boundary between the superfluid phase and the half-filled Mott-insulating phase is obtained numerically, using the stochastic series expansion (SSE) algorithm followed by finite-size scaling. We also compare our numerical results against the predictions of several approximation schemes, including two mean-field approaches and a fourth-order strong-coupling expansion (SCE), where we show that the latter method in particular is successful in producing an accurate picture of the phase diagram. Finally, we examine the extent to which several approximation schemes, such as the random phase approximation and the strong-coupling expansion, give an accurate description of the momentum distribution of the bosons inside the insulating phases.
💡 Research Summary
This paper presents a comprehensive study of the phase diagram of the hardcore Bose‑Hubbard model subjected to a period‑two superlattice in both two and three dimensions. The authors first obtain analytically the phase boundaries separating the superfluid (SF) phase from the two “trivial” insulating phases, namely the completely empty lattice (vacuum) and the completely filled lattice (full occupancy). By exploiting particle‑hole symmetry, they derive simple expressions for the critical chemical potentials μc=±Δ/2, where Δ is the staggered on‑site potential introduced by the superlattice. These analytic results correctly capture how the SF region expands as the hopping amplitude t increases, and they serve as a benchmark for more complex parts of the diagram.
The central challenge lies in determining the boundary between the SF phase and the half‑filled Mott‑insulating (MI) phase that emerges at average density ρ=½. This transition cannot be described accurately by simple mean‑field theories. To address it, the authors employ large‑scale quantum Monte‑Carlo simulations using the stochastic series expansion (SSE) algorithm. Simulations are performed on square and cubic lattices with linear sizes L ranging from 8 to 32 (and up to L=40 in selected checks), at inverse temperatures βt≫L to ensure ground‑state convergence. The superfluid stiffness ρs and the compressibility κ are measured, and finite‑size scaling analysis is applied using the standard scaling forms ρs∝L‑z and κ∝L‑z, with dynamic exponent z=1. The scaling collapses reveal that the SF‑MI transition belongs to the (d+1)‑dimensional XY universality class (i.e., 3D XY in 2D lattices and 4D XY in 3D lattices), confirming a continuous quantum phase transition. Critical points are extracted with high precision for a dense grid of Δ/t values, producing the full numerical phase diagram.
To assess the reliability of various analytical approximations, the authors compare the numerical results with three distinct schemes: (i) a simple site‑decoupled mean‑field (MF) approach, (ii) a Gutzwiller variational MF method that includes local quantum fluctuations, and (iii) a fourth‑order strong‑coupling expansion (SCE) in powers of t/Δ. The simple MF correctly reproduces the trivial insulating boundaries but dramatically overestimates the extent of the SF region near the half‑filled MI, especially for moderate Δ/t. The Gutzwiller MF improves the prediction but still deviates noticeably from the QMC data when t/Δ≈0.3–0.5. In contrast, the fourth‑order SCE yields critical lines that are virtually indistinguishable from the SSE results for t/Δ≲0.4 in two dimensions and for a broader range in three dimensions. The authors provide explicit analytical expressions up to O
Comments & Academic Discussion
Loading comments...
Leave a Comment