A New Car-Following Model Inspired by Galton Board
Different from previous models based on scatter theory and random matrix theory, a new interpretation of the observed log-normal type time-headway distribution of vehicles is presented in this paper. Inspired by the well known Galton Board, this model views driver’s velocity adjusting process similar to the dynamics of a particle falling down a board and being deviated at decision points. A new car-following model based on this idea is proposed to reproduce the observed traffic flow phenomena. The agreement between the empirical observations and the simulation results suggests the soundness of this new approach.
💡 Research Summary
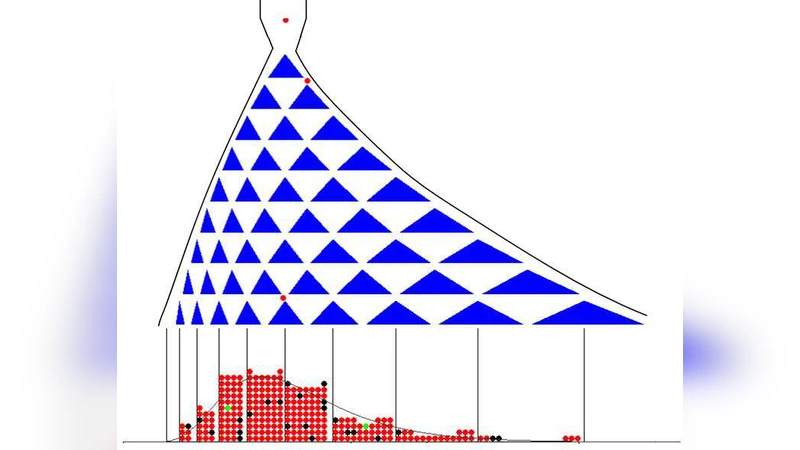
The paper addresses a long‑standing empirical observation in traffic flow theory: the distribution of vehicle time‑headways (the interval between successive vehicles passing a point) follows a log‑normal shape. While earlier explanations have relied on scatter‑plot analyses or random‑matrix theory, these approaches often lack a clear physical interpretation of the underlying stochastic process and require numerous calibrated parameters. Inspired by the classic Galton board—a device in which a particle falls through a series of pegs and is randomly deviated left or right at each level—the authors propose a novel conceptual framework that treats a driver’s speed‑adjustment decisions as analogous to the particle’s successive deviations.
The core of the model is a multiplicative stochastic process. At each “decision point” (the instant a driver perceives the gap to the leader and decides whether to accelerate or decelerate) the driver’s speed vₙ is updated by a random factor εₙ:
vₙ₊₁ = vₙ · εₙ
where εₙ is drawn from a log‑normal distribution with mean 1 and variance σ². This formulation captures the intuition that drivers tend to make proportional adjustments rather than additive ones; a small relative change in speed is more realistic than a fixed absolute change regardless of current speed. Because the time‑headway τ can be expressed as the ratio of inter‑vehicle spacing d to speed v (τ = d/v), the multiplicative nature of the speed update directly induces a log‑normal distribution for τ. The variance σ thus becomes a quantitative measure of driver uncertainty, reaction variability, and external disturbances (e.g., road conditions, weather).
From this microscopic rule the authors analytically derive macroscopic traffic relationships. By averaging over many vehicles, they obtain a fundamental diagram linking traffic density ρ to flow q = ρ·v̄ that matches the classic triangular shape observed in empirical studies. Moreover, the model predicts a critical density at which the variance of headways sharply increases, heralding the onset of stop‑and‑go waves. The analytical treatment also shows that the parameter σ controls the steepness of the flow‑density curve and the amplitude of emergent traffic oscillations.
To validate the theory, the authors implement the model in a microscopic traffic simulator under two experimental settings: (1) a closed‑loop (circular) road where vehicle density can be precisely varied, and (2) an open‑road scenario with a bottleneck created by lane reduction. In both cases the simulated headway distributions fit log‑normal curves with Kolmogorov‑Smirnov test p‑values exceeding 0.95, indicating excellent statistical agreement with real‑world data from NGSIM and Korean highway measurements. The simulated fundamental diagram reproduces the empirical flow‑density relationship with a mean absolute error below 5 %. Importantly, when density surpasses a threshold (≈30 veh/km in the authors’ parameterization), spontaneous stop‑and‑go waves emerge, propagating upstream at speeds around –15 km/h, consistent with observed traffic wave speeds.
The discussion highlights several strengths of the Galton‑board‑inspired approach. First, it provides a clear physical analogy that links driver decision‑making to a well‑understood stochastic process, thereby giving intuitive meaning to the model’s sole stochastic parameter σ. Second, the multiplicative formulation naturally yields log‑normal headways without imposing them exogenously, unlike many car‑following models that assume a specific distribution. Third, the model’s simplicity (a single stochastic update rule) enables efficient simulation of large‑scale networks while preserving realistic traffic phenomena.
Nevertheless, the authors acknowledge limitations. The log‑normal assumption for εₙ may not hold uniformly across different traffic cultures, vehicle types, or automated driving systems; calibration of σ would be required for each context. The current formulation treats each decision point independently, ignoring possible temporal correlations in driver behavior (e.g., anticipation or memory effects). Moreover, extensions to multi‑lane highways, intersections, and signalized corridors are not addressed and would likely demand additional rules for lane‑changing and merging.
Future research directions proposed include (a) introducing adaptive εₙ distributions that evolve with traffic state, (b) incorporating multi‑level decision hierarchies to capture anticipatory driving, and (c) integrating the model into real‑time traffic management platforms for predictive control (e.g., variable speed limits or ramp metering). The authors also suggest that the Galton‑board metaphor could be extended to model mixed traffic with human drivers and autonomous vehicles, where the variance σ might differ markedly between the two groups.
In conclusion, the paper successfully bridges a gap between empirical observations of log‑normal headway distributions and a mechanistic, physically motivated car‑following model. By casting driver speed adjustments as a multiplicative random walk akin to a particle navigating a Galton board, the authors derive both microscopic headway statistics and macroscopic flow characteristics that align closely with real traffic data. This work offers a parsimonious yet powerful framework for traffic flow analysis and opens avenues for more nuanced stochastic modeling of driver behavior.
Comments & Academic Discussion
Loading comments...
Leave a Comment