Embedding Spatial Software Visualization in the IDE: an Exploratory Study
Software visualization can be of great use for understanding and exploring a software system in an intuitive manner. Spatial representation of software is a promising approach of increasing interest. However, little is known about how developers interact with spatial visualizations that are embedded in the IDE. In this paper, we present a pilot study that explores the use of Software Cartography for program comprehension of an unknown system. We investigated whether developers establish a spatial memory of the system, whether clustering by topic offers a sound base layout, and how developers interact with maps. We report our results in the form of observations, hypotheses, and implications. Key findings are a) that developers made good use of the map to inspect search results and call graphs, and b) that developers found the base layout surprising and often confusing. We conclude with concrete advice for the design of embedded software maps.
💡 Research Summary
The paper investigates the potential of embedding a spatial software visualization—referred to as “Software Cartography”—directly inside an Integrated Development Environment (IDE) and evaluates how developers interact with such a map during program comprehension tasks. The authors motivate their work by pointing out that most existing code‑visualization tools are stand‑alone, requiring developers to switch contexts between the editor and a separate visualizer. By contrast, a spatial map that lives inside the IDE could leverage humans’ natural ability to form geographic mental models, thereby reducing cognitive load and improving navigation efficiency.
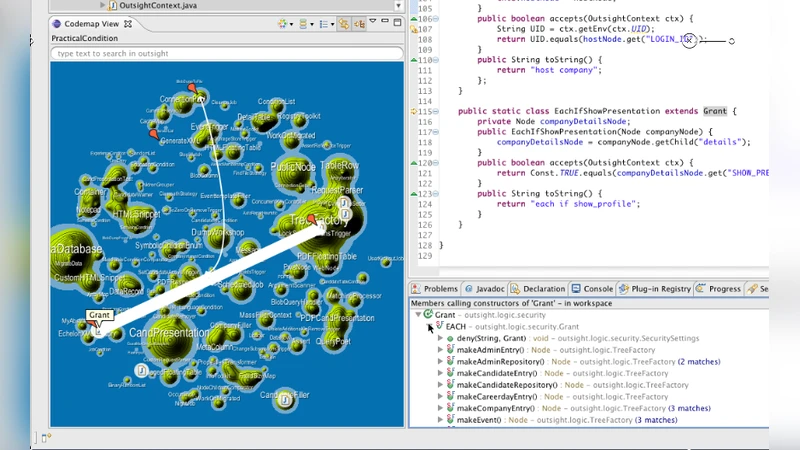
To explore this hypothesis, the authors built a prototype Eclipse plug‑in that renders the source code of a target system as a two‑dimensional map. Each file, class, and method is represented by a glyph whose position, size, and color are derived from a topic‑based clustering algorithm (e.g., package name, lexical keywords). The map supports interactive operations such as zoom, pan, click‑to‑reveal details, heat‑map overlays for search results, and visual call‑graph edges that connect related glyphs. The prototype also allows developers to issue textual searches; matching elements are highlighted on the map, and the intensity of the highlight encodes relevance.
A pilot user study was conducted with twelve developers of intermediate to advanced skill levels. Participants were asked to work on an unfamiliar open‑source project of roughly 30 K lines of code. The study comprised four tasks: (1) locate the implementation of a specified feature, (2) perform a keyword search and interpret the resulting heat‑map, (3) trace the dynamic call graph of a particular method, and (4) identify candidates for refactoring. Each session lasted about ninety minutes, during which screen recordings, interaction logs, and think‑aloud comments were collected. After each task, participants completed a short questionnaire and took part in a semi‑structured interview.
The findings fall into two main categories. First, developers consistently leveraged the map for dynamic exploration. When a search returned many hits, the heat‑map allowed participants to instantly spot the most relevant files without scrolling through a textual list. Similarly, call‑graph edges drawn on the map made it easy to follow execution paths across modules, and participants reported that the visual cues reduced the time needed to understand inter‑module dependencies. Second, the static layout generated by the topic‑based clustering proved problematic. Many participants noted that files belonging to the same package were often scattered across the map, while unrelated files sometimes appeared adjacent. This “surprising” layout forced users to spend extra effort learning the map’s geography before they could rely on it for structural reasoning. Consequently, the authors refined their initial hypotheses: (a) spatial maps are highly beneficial for search‑driven and call‑graph‑driven tasks, (b) the effectiveness of a map for understanding static architecture depends critically on the quality of the base layout, (c) topic‑only clustering does not capture the logical proximity developers expect, and (d) giving users control over clustering criteria and layout adjustments is essential.
Based on these observations, the paper proposes concrete design recommendations for future IDE‑integrated visualizations:
- Dependency‑aware layout – generate positions using call‑graph or package hierarchy information so that logically related entities are placed near each other.
- Multi‑modal clustering – allow users to switch between topic‑based, change‑frequency, test‑coverage, or custom clustering modes on the fly.
- Focus‑and‑highlight mechanisms – automatically pin the file currently being edited, emphasize recent changes, and provide visual anchors for “hot spots.”
- Navigation history & bookmarks – record map navigation paths and let users bookmark regions for quick return, supporting long‑term spatial memory formation.
- Editable map – enable drag‑and‑drop repositioning of glyphs and dynamic scaling of detail levels (e.g., showing code snippets at high zoom).
The authors acknowledge several limitations. The study involved a relatively small sample size and only a medium‑scale code base; results may not generalize to very large systems. Performance overhead of rendering large maps inside the IDE was not quantitatively measured. Moreover, the study focused on short‑term task performance rather than long‑term retention of spatial knowledge. Future work is planned to address scalability, to conduct longitudinal studies on spatial memory formation, and to integrate performance profiling to assess the impact on IDE responsiveness.
In conclusion, the exploratory study demonstrates that embedding a spatial software map inside the IDE can substantially aid developers during dynamic exploration tasks such as search result inspection and call‑graph analysis. However, the utility of the map for static architectural comprehension hinges on a well‑designed base layout that reflects logical code relationships. By combining dependency‑aware positioning, flexible clustering, and richer interaction primitives, future IDE‑integrated visualizations can better support developers’ mental models, reduce context‑switching costs, and ultimately improve software comprehension and maintenance productivity.
Comments & Academic Discussion
Loading comments...
Leave a Comment