Movie Recommendation Systems Using An Artificial Immune System
We apply the Artificial Immune System (AIS) technology to the Collaborative Filtering (CF) technology when we build the movie recommendation system. Two different affinity measure algorithms of AIS, Kendall tau and Weighted Kappa, are used to calcula…
Authors: Qi Chen, Uwe Aickelin
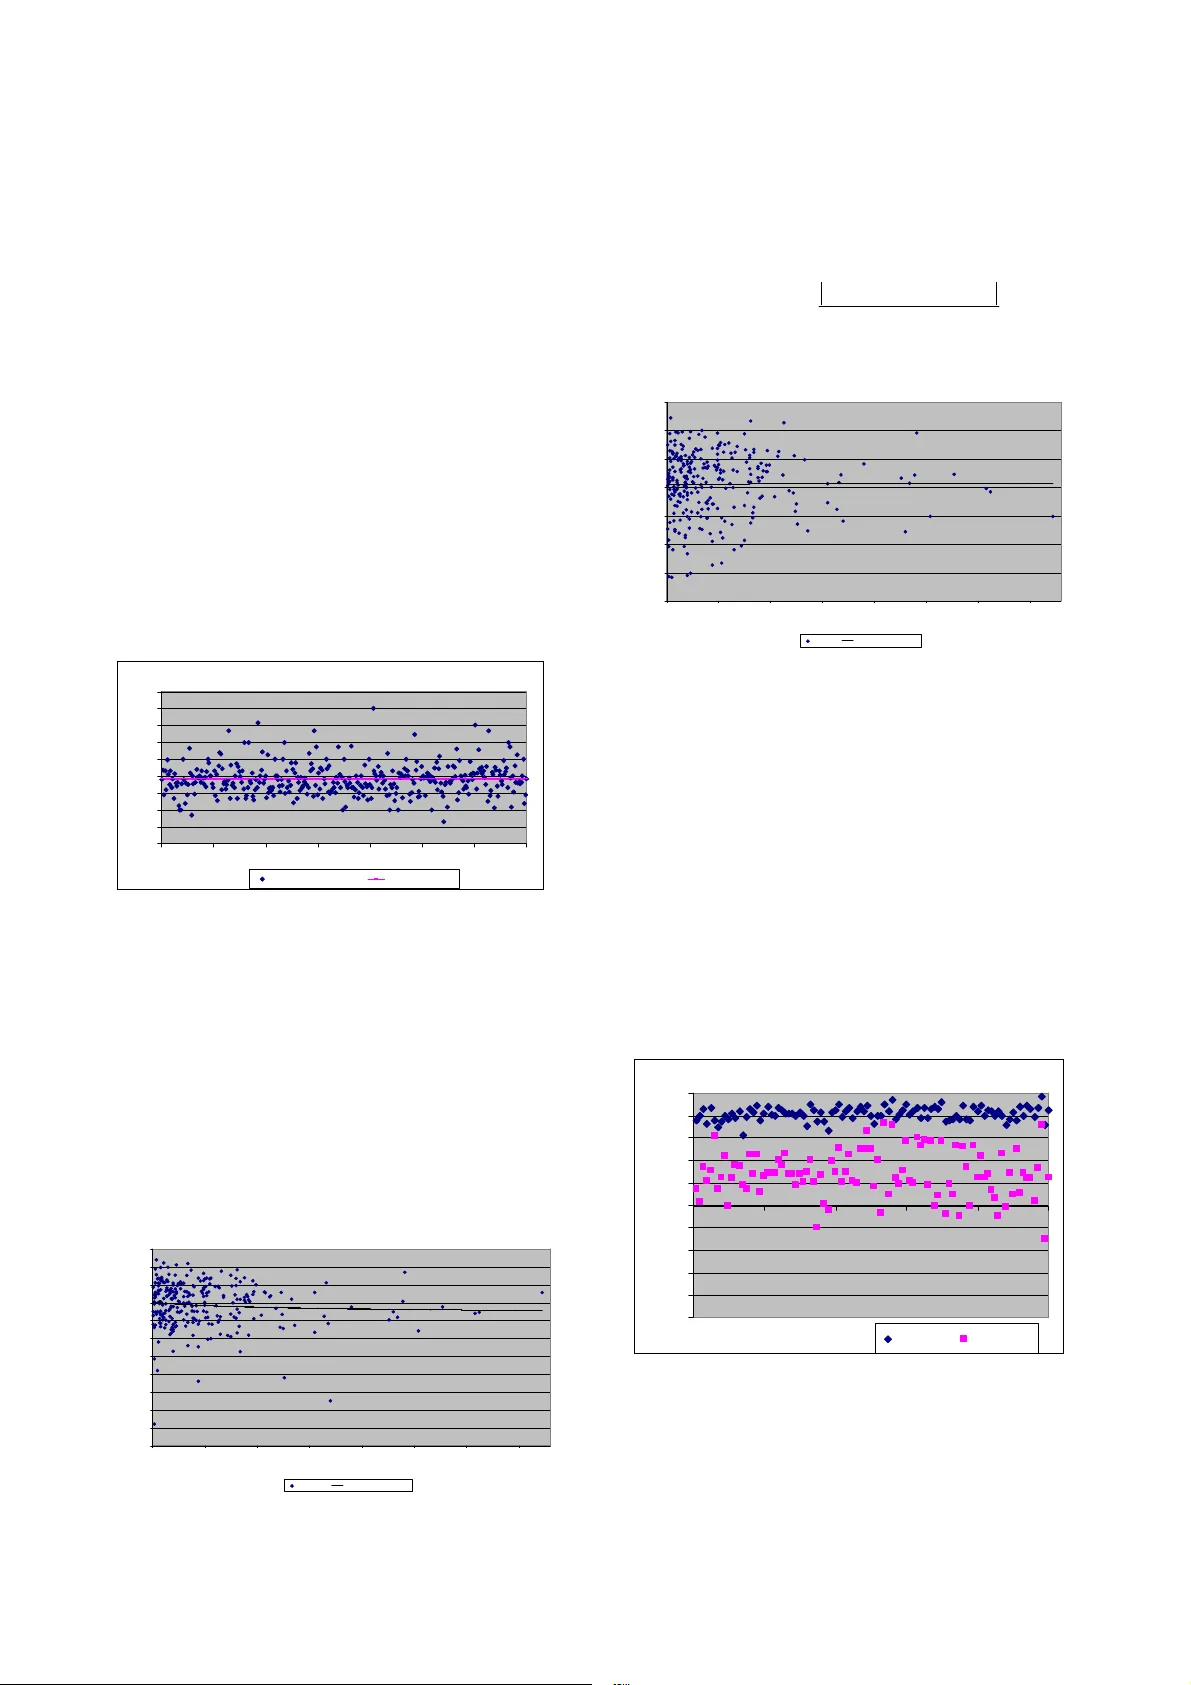
MOVIE RECOMENDATION SYSTEMS US ING AN ARTIFIC IAL IMMUNE SYSTEM Q Chen, U Aickelin, qxc@cs.nott.ac.uk , uwe.aickelin @nottingham .ac.uk , School of Computer Science and IT , University of Nottingham, UK ABSTRACT We apply the Artificial Imm une System (AIS) technology to the Collaborative Filtering (CF) technology wh en we b uild the movie recommendation system . Two different affinity m easure algorithms of AIS, Kendall tau and Weight ed Kappa, ar e us ed to calculate the correlation coefficients for this m ovie recommendation sy stem . From the testing we think that Weighted Kapp a is more suitable than Kenda ll tau for movie problems. 1. INTRODUCTION In e veryday life, w e often face a situation in w hich w e need to make ch oices with out su fficient personal experience. These arising needs call for effective recommendation system s to assist us in makin g these choices. To day’s tec hniques used in recomm endation system s are mainly collab orative filtering technology and content-based technology [1]. Collaborative filtering technology implied w ith AIS is used in our proj ect. Two correlatio n m ethods, Weight ed Kappa and Kendall tau, ar e used to c alculate the corre lation coefficients, and their results are compared . Collabora tive Filter ing Technology (CF) CF is the technology offering users recomm endations by getting recommendations from the peo ple who have similar preferences with the users [2]. T he collabor ative filtering technology can offer you recommendations to items even though you d o not know the c ontent of these items. That is a big advantage. The group of pe ople with similar preferences with the user entirely determine the predictio ns o f the user w ho r equest re comm endation, so it is very im portant to choose the group of p eople. Human Im m une System (HIS) HIS is the d efence system of o ur bod y w hich can protect o ur body against infections [4 ]. T he antigens (Ag) a ttacking our body can stimu late the imm une system to produce antibo dies. Artificial Imm une Systems (AIS) AIS are distrib uted and a daptive systems using the models and p rinciples d erived from the H uman Imm une Sy stem , AIS are used for p roblem solving. [3] 2. IM PLEMENTATION Two movie recommendation system s are implemen ted using the c ollabora tive filtering technology and AIS, one uses the Weighted Kappa method to calculate correlatio n co efficients, and the other uses the Kendall tau meth od. The AIS is built to select the group of people with similar m ovie preferences as the target. The people in the database are vi ewed a s candidate antibodies, and the user who uses the movie recommendation system is view ed as an antigen. T he two co rrelation m ethods ar e used to calculate the correlatio ns betw een the antigen and antibod ies, and the correlatio ns between antibodies and antibodies. System Process The figure below describe s how o ur recommendation system w orks: Figure 1 ( System process diagram) 1: There are some people’s preferences store d in the database; 2: User inputs his preferences for the movies, and requires recommendations o n some movies that he has not seen 3: AIS selects a gro up of peo ple who have sim ilar preferences with the user User-w ho require recomme ndati o n s Database AI S Gene rate Recommendatio Input prefere nces for some mo vies A group of people’s pre ferences people’s pref erences fo r movies(V otes) Recommendations Poster Proc eeding s of AC DM 2004 Engin eers’ House, Bri stol, UK 4: The w eighted average of the preferences for that group of peo ple is calculated by the CF to generate recommendations w hich th e user requires Im m une Netwo rk Model The AIS model used in this project is the Imm une Network Mod el built by Far mer et al [5] and modified by Cay zer et al [6]. This model is controlled b y the Equation (1) w hich describes how the antibody’s concentration c hanges. It incre ases for the antibody’s matchin g to the antigen, and decreases for the antibody’s matching to the other antibodies. And there exist the death rate, so if the antibod y is neither bad nor good, its concentration also will decre ase. W hen an antibody’s co ncentration is b elow a value, we will delete it from the AIS, and choose another new antibody randomly from the database. When all antibodies in the AIS satisf y our requirement or there are no more antibodies can be chosen from the database, upd ating the AIS process will stop. i j i N j j i i i i x k x x m n k y x m k dt dx 3 1 , 2 1 − − = ∑ = ( Equation 1 ) y represents the concentratio n of antigen x i represents the concentration of antibo dy i, x j represent the concentratio n of antibody j. m i,j represents the affinity betw een the antibody i and j, m i represents the affin ity between the antibody i and the antigen Affinity M easure Algorithms We w ill use two different a lgorithms to calculate the affinity (co rrelation coefficient) - Kapp a a nd Kendall tau. We will use this example belo w to explain how Weighted Kapp a and Kendall tau work. Example 1: (two pe rson from the database, one’s person I d is 50, the other’s person Id is 70, {(movie- id 1 , movie-vote 1 ); ……; (m ovie-id n , movie-vote n )} is used to encode a person who has voted n movies. the vote scores is 0, 0.2, 0 .4, 0 .6, 0. 8, 1.) Person1 (id =50): { (2 ,1) ; (4, 1); (19,0. 6); (21,0 .2); (24,0 .8); (2 7,1); (3 1,1); ( 32,0. 8); (62 ,1); ( 65,0.8 ); (76,1 ); (93, 0.6); ( 94,0. 8)} Person2( id=70): {(1,0.8 ); (2,0 .6); ( 5,0.6 ); (8,0 .4); (13,0 .2); (15,0) ; (19,0.2 ); (24,0 .6); (25 ,0.4) ; (32,0.8 ); (34,0 .8); (52, 0.6); ( 62,0. 8); ( 65,0) ; (70 ,0.6); (86,0.4) ; (87,0 .2); (9 5,0.8 ); (107 ,0.6) } The votes in bold indicate they are the votes for the movies w hich th e two persons have seen in comm on. Weighted K appa Algorithm [8]: W eighted kapp a is a method of ca lculating affinity (correlation co efficient), wh ich i s calculated using the Equation ( 2) f rom the observed and expected freq uencies. ) ( ) ( ) ( 1 w e w e w o w p p p k − − = Equation 2 P o(w) repre sents the observed agreements P e(w) represents the expected agreements by chan ce. In the movie r ecommen dation systems, all the persons in the p erson database chose the movies they had seen from the movie database, and ranked them. No agreements by chance exist, so P e(w) =0 and k w = P o(w) . The P e(w) is calculated by the Equation (3 ). ∑ ∑ = = = g i g j ij ij w o f w p n 1 1 ) ( 1 Equation 3 g represents ca tegory. n represents the num ber of the ob servations in g categories. f ij represent the num ber of agreemen ts for the cell in row i and column j . wij represents the weight value for the cell in ro w i and column j . In o ur project, th e category g =6 (for the user has 6 optional movie vote to choose fro m—0, 0.2 , 0.4, 0.6, 0.8, 1); the observatio ns num ber n is the num ber of movies two per sons have seen in comm on, w ij ca n be got by the Equation (4). 1 1 − − − = g j i w ij Equation 4 The d ifference between i and j is bigger, the w eight is smaller; and the difference between i and j is smaller, the w eight is bigger. When i = j , the weight w ill reach the biggest value 1. Using the equation (4) we get the Table 1 below, wh ich show s the weig ht values w ij for our pr oject. j =1 j =2 j =3 j =4 j =5 j =6 i = 1 1 0.8 0.6 0.4 0.2 0 i = 2 0.8 1 0.8 0.6 0.4 0.2 i = 3 0.6 0.8 1 0.8 0.6 0.4 i = 4 0.4 0.6 0.8 1 0.8 0.6 i = 5 0.2 0.4 0.6 0.8 1 0.8 i= 6 0 0.2 0.4 0.6 0.8 1 Table 1 (weigh t values table) In example 1, the per son 1 and p erson 2 have seen 6 movies in common, so the observatio ns num ber is 6; they ar e movie 2, movie 19, movie 24, movie 3 2, movie 62, and movie 65. For movie 2 p erson 1 vote it as “1”( row 6), person 2 Vote as “0.6”( column 4); for movie 19 p erson 1 vote it as “0.6”(ro w 4), p erson 2 Vote as “0.2”( column 2); for movie 24 p erson 1 vote it as “0.8”(ro w 5), p erson 2 Vote as “0.6” (column 4); for movie 3 2 person 1 vote it as “0.8” (row 5), person 2 Vote as “0.8 ” (column 5); for m ovie 6 2 person 1 vote it as “1” (row 6) , person 2 Vote as “0.8” (column5); for movie 6 5 person 1 vote it as “0.8” (row 5), person 2 Vote as “0”( column 1); so we got the f ij ( the number of agreements for the c ell in row i and column j ) Table 2 (Agreement ( f ij ) Ta ble for example 1) Weighted kappa c orrelation b etween person 2 and 1 is: k (w) =1/6*(0.2*1+0.6*1+0. 8*1+0.6*1+0.8*1+1) = 0.667 We know that the agreement between these two persons is good for the Tab le3 belo w. Value of kappa Value of Kendall tau Strength of agreement <0.20 -1~ -0.2 Poor 0.21-0.4 0 -0.6 ~ -0.2 Fair 0.41-0.6 0 -0.2 ~ 0. 2 Moderate 0.61-0.8 0 0.2 ~ 0 .6 Good 0.81-1.0 0. 6 ~ 1 Very good Table 3 (T he table o f kappa meaning) [6] Kendall ta u [9 ]: Kendall tau is another method of calculating affin ity (correlation coefficient). For a pair o f observations ( X i , Y i ) and ( X j , Y j ), w e view it as a concordant pair if X j -X i and Y j -Y i have the same sign; we view it as a disco rdant pair if X j -X i and Y j -Y i have opp osite signs. C rep resents the num ber of concordant pairs; D r epresents the num ber of discordant pairs. Then w e get the Equation (5) , wh ich is used to calculate the affinity (correlation coefficient). ) 1 ( 2 ˆ − = n n S τ , 1 ˆ 1 + ≤ ≤ − τ . ( Equation 5 ) τ ˆ represents Kendall tau aff inity (correlation coefficient) n represents obser vations num ber S repr esents Kendall S, defined as: S = C-D For n observations, there are ½ n ( n -1) p airs, either concordant or discor dant. If they are all concor dant, τ ˆ is 1 , if they are all d iscordant τ ˆ is -1. C is the number of co ncordant pairs within ½n(n-1) pairs, 2 C / n ( n -1) can represent prob ability π c of ( X i , Y i ) and ( X j , Y j ) are concordant, 2 D / n ( n -1) can represents the pro bability π d of a pair is d iscordant. Because π c - π d = τ ˆ , and π c + π d = 1, we ca n get another useful equation π c / π d = (1+ τ )/(1- τ ). ( Equat ion 6 ) In Example1: Movie-Id: (P erson1’s vote, Per son2’s vote); Movie 2: ( 1, 0.6 ); Movie 1 9: (0.6 , 0.2) ; Movie: 24 ( 0.8, 0 .6); Mo vie: 32 (0 .8, 0. 8); Movie 62: ( 1, 0.8 ); Movie 6 5: (0.8 , 0) We view 0 and 0 a concor dant p air, a nd view 0 and the other non-zero num bers as neither discordant nor concordant, we just ignored them. movieId p erson 1 person 2 (2, 19 ) 1-0.6 =0.4 0.6-0.2= 0.4 Co n (2, 24 ) 1-0.8 =0.2 0.6-0.6= 0 (2, 32 ) 1-0.8 =0.2 0.6-0.8= -0.2 Dis (2, 62 ) 1-1=0 0.6-0.8= -0.2 (2, 65 ) 1-0.8 =0.2 0.6-0=0. 6 Co nt (19, 2 4) 0.6-0.8= -0.2 0.2 -0.6=-0.4 Con (19, 3 2) 0.6-0.8= -0.2 0.2 -0.8=-0.6 Con (19, 6 2) 0.6-1=-0.4 0.2-0.8= -0.6 Con (19, 6 5) 0.6-0.8= -0.2 0.2 -0=0.2 Dis (24, 3 2) 0.8-0.8= 0 0.6-0.8=-0.2 (24, 6 2) 0.8-1=-0.2 0.6-0.8= -0.2 Con (24, 6 5) 0.8-0.8= 0 0.6-0=0. 6 (32, 6 2) 0.8-1=-0.2 0.8-0.8= 0 (32, 6 5) 0.8-0.8= 0 0.8-0=0.8 (62, 6 5) 1-0.8=0. 2 0.8-0=0.8 Con Table 4 From table 4 we get C = 7, D = 2 ; S =7 -2=5; τ ˆ = (2*5)/6*(6-1)=0.3 3333 33 π C / π D = (1+ τ )/(1- τ )=2 That re presents (the pr obability of concordant/the proba bility of discor dant)=2, w hich means if they have seen n movies in common, 2n/3 movies w ill be concordant, n/3 of them w ill be discordant. Generate Reco mm end ation Alg orithm After the AIS has chosen 1 00 peop le (antibodies) w ho have similar preferences with the user ( antigen) req uire recommendations, the CF will use the ( Equation 6 to calculate the pred ictions. ( ) ( ) ∑ ∑ = = × × = 100 1 100 1 1 i i i i i weight VoteScore weight prediction ( Equation 6 ) weight i reprents the weight of th e ith an tibody, weight i = conc entration i , ( the ith a ntibody voted this movie), weight i =0, ( the ith antibody did not vote this movie ) concen tration i represents the concentratio n of 2 1 1 (0) 2 (0.2) 3 (0.4) 4 (0.6) 5 (0.8) 6 (1) Tota l 1(0) 0 0 0 0 0 0 0 2(0.2) 0 0 0 0 0 0 0 3(0.4) 0 0 0 0 0 0 0 4(0.6) 0 1 0 0 0 0 1 5(0.8) 1 0 0 1 1 0 3 6 (1) 0 0 0 1 1 0 2 Total 1 1 0 2 2 0 6 VoteSco re i repre sents the sco re w hich the ith antibody voted this movie as. We use the concentration as the w eight to calculate the predictio n, b ecause it contains both the correlation of the antibody to the antigen and the corre lation of the antibody to the other antibo dies. The Data The d ata we use in this pro ject is publicly available data, wh ich is offered by the Compaq Research (formerly DEC Researc h) [7 ]. It contains 281 1983 ratings entered by 72 916 users for 16 28 different movies, and it has been used in numerous CF publications. RESULTS We calculated the ignored percent of zero ones in 350 pairs of perso ns which are randomly chosen from the database when we used Kendall tau to calculate their affinities. Pe rc e nt of igno r ed zer o pair s 0 0.1 0.2 0.3 0.4 0.5 0.6 0.7 0.8 0.9 0 50 1 00 15 0 200 250 30 0 350 igno red zero p ercen t Om it z ero percen t Aver age Line Figure 2 ( percent of Ke ndall tau ignored zero ) Figure 2 show s per cent o f ignored zer o ones. In average, 38.27% information was ignored . In some occasions, more than 50% information was ign ored. In ord er to ca lculate the pred iction accuracy we choose 300 p ersons (who voted more than 20 movies) randomly from the database, hide one of their votes for each person, o ffer the person predictio n for the hidd en movie using the information left. W e do this 20 times for each per son chosen by hiding different vote and compare these 2 0 pr edictions w ith their hidden actual votes. Kendall Prediction A ccuracy 0.4 0.45 0.5 0.55 0.6 0.65 0.7 0.75 0.8 0.85 0.9 0.95 20 70 120 170 220 270 320 370 Vote Total Affinity Kendall Trendline(power) Figure 3 ( Pred iction accuracy for Kendall ) Figure 3 show s the pred iction acc uracy for 3 00 users using the movie recom mendation system which uses the Kendall tau correlatio n meth od. The mean predictio n accura cy is 0.7964 19. T he pred iction accuracy is calculated using Equation 6. 20 1 actualVote prediction Accuracy Prediction − − = Equation 7 Kappa Prediction A ccuracy 0.6 0.65 0.7 0.75 0.8 0.85 0.9 0.95 20 70 120 170 220 270 320 370 Vote Total Affinity kappa Trendline(powe r) Figure 4 ( Pred iction accuracy for Kappa ) Figure 4 Figure 4 show s the prediction accuracy for 300 users using the movie r ecommen dation system wh ich uses the Weighted Kappa correlatio n m ethod The Mean pr ediction ac curacy is 0.8 0762 . T he accuracy 0.8 represents that there is o ne rank difference between the pr ediction and the user’s actual rating for a movie. So if the system pred icts a movie as ‘Very Good’, the user may think that it is ‘Good’. We use the Weighted Kap pa method to get the 10 0 antibodies for o ne user (the Antigen) and use the Kendall tau method to calculate the cor relations between the 100 antibodies a nd the antigens. We compare the corr elations got by Kappa and K endall. The results are shown in Figure 5. Ka p p a A I S -1 -0 .8 -0 .6 -0 .4 -0 .2 0 0.2 0.4 0.6 0.8 1 0 20 40 60 80 100 antibody I D Affi ni ty kappa ke n dal l Figure 5 (Kappa AIS) From Figure 5 we can see that all the Kappa values are very hig h (So we use kappa to implement the A IS) and some of the Kendall values are below zero. We use the system w hich uses the Kendall tau m ethod, to get the 100 antibodies for one user (the Antigen) and use the Weighted Kappa to method to calculate the correlatio ns between th e 100 antibodies and the antigens. We compare the corr elations got by Kappa and Kendall. T he results are shown in Figu re 6. Ke n d a ll A IS 0 0. 2 0. 4 0. 6 0. 8 1 0 20 40 60 8 0 10 0 A n ti b od y I d A f fi n it y kappa ke n dall Figure 6 (Kendall AIS) From Figure 6, we can see that som etimes Kendall is high (m ore than 0.2) but Kappa is not very high (less than o.6). DISCUSSION AND CONCLUSION We found when w e use the Kendall tau method in the movie recomm endation systems , if we do not ignore these pairs, w e treat the zero as opposite number or negative number, the Kendall tau value will be different we calculate it in different o rders. Ob viously it is wrong. If we ignore the p airs with z ero, too much information we ignore. W e think the prob lem is that there are only 6 categories, but more observations (for n obser vations there will be ½* n ( n -1) c omparisons) for the m ovie problems. When w e use Ke ndall tau to calculate correlatio ns, there will be many tires. In our opinions, the Kendall tau is not s uitable for movies proble ms; Kapp a is a goo d method for movies proble ms. For this reason, if we use Kendall tau, the recommendation system should get w orse results. But the prediction accuracy using these tw o methods has a slight difference. We have not known w hy this happen yet. REFERENCE 1. Billsus D and Pazz ani M.J ., 1998, ‘Learning collabor ative information filters’, Irvine, CA 92697- 3425 . 2. http://ww w.sims.berkeley .edu/resources/collab / co nferences/berkeley96/collabannounce.html 3. Leandro N. d e Castro and Jonathan T imm is, 20 02, ‘Artificial I mm une Systems: A New Computational Intelligence Approach’, PP 15. 4. Goldsby R.A., Lindt T .J., Osborne B .A., Kuby J, 2003 , ‘Imm unology’, Fifth Edition, PP1 -21. 5. Farmer JD, Packard NH and Perelson A S, 1986, ‘The immu ne system , adaptatio n, and machine learning, Physics, vol. 22, pp. 187-20 4. 6. Cay zer S and Aickelin U, ‘On the Effects of Idiotypic Interactions for Recomm endatio n Comm unities in Artificial Imm une Sy stems ’, ICARIS 2002 , pp 1 54-160, Canterbury, UK 7. Compaq Syst ems Research Centre, EachMovie d ata set, http://research.compaq.co m/SRC/eachm ovie/ 8. Altman, Douglas G, 199 1, ‘Some c omm o n p roblems in m edical research’, P ractical Statistics for Medical Research, New York, PP3 06-435 . 9. No ether G.E., 198 6, ‘Why Kenda ll T au’, T he Best of Tea ching Statistics, PP41-43 .
Original Paper
Loading high-quality paper...
Comments & Academic Discussion
Loading comments...
Leave a Comment