LIKWID: A lightweight performance-oriented tool suite for x86 multicore environments
Exploiting the performance of today’s processors requires intimate knowledge of the microarchitecture as well as an awareness of the ever-growing complexity in thread and cache topology. LIKWID is a set of command-line utilities that addresses four key problems: Probing the thread and cache topology of a shared-memory node, enforcing thread-core affinity on a program, measuring performance counter metrics, and toggling hardware prefetchers. An API for using the performance counting features from user code is also included. We clearly state the differences to the widely used PAPI interface. To demonstrate the capabilities of the tool set we show the influence of thread pinning on performance using the well-known OpenMP STREAM triad benchmark, and use the affinity and hardware counter tools to study the performance of a stencil code specifically optimized to utilize shared caches on multicore chips.
💡 Research Summary
The paper presents LIKWID, a lightweight suite of command‑line utilities and a C API designed to simplify performance analysis and optimization on modern x86 multicore systems. The authors identify four recurring challenges faced by developers and researchers: (1) discovering the detailed thread and cache topology of a shared‑memory node, (2) enforcing a deterministic thread‑to‑core affinity, (3) collecting hardware performance‑counter metrics with minimal overhead, and (4) toggling micro‑architectural features such as hardware prefetchers. LIKWID addresses each of these problems with a dedicated tool:
- likwid‑topology probes the processor using CPUID and Linux sysfs/proc interfaces to produce a hierarchical map of physical cores, logical threads, hyper‑threads, and shared L1/L2/L3 caches. This map is the foundation for all subsequent operations.
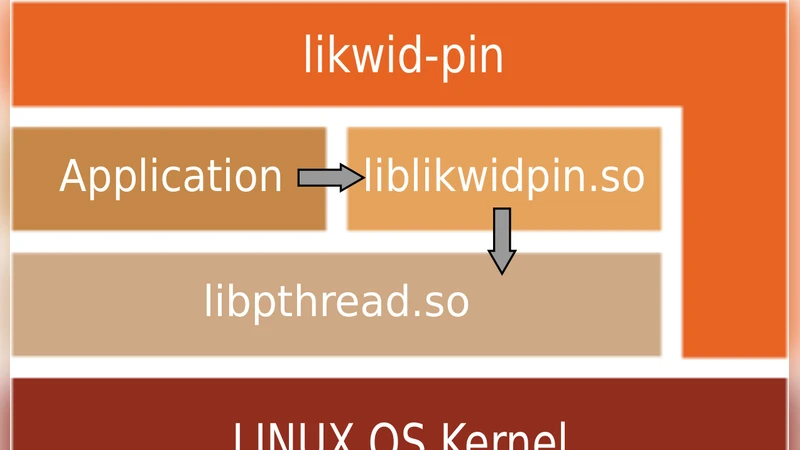
- likwid‑pin implements thread‑core binding by preloading a small wrapper library that intercepts thread creation (OpenMP, pthread, MPI) and immediately pins the new thread to a user‑specified core list. The approach works across different runtime environments without requiring source‑code changes.
- likwid‑perfctr wraps the Linux perf_event_open API, exposing pre‑defined event groups (FLOPS, MEM, CACHE, BRANCH, etc.) and allowing users to select individual counters or whole groups. It automatically adjusts sampling intervals to keep measurement overhead low and supports per‑thread as well as aggregated reporting.
- likwid‑features provides direct access to model‑specific registers (MSRs) that control hardware prefetchers, power‑saving modes, and other micro‑architectural knobs. By enabling or disabling these features, users can explore their impact on specific workloads.
In addition to the command‑line tools, LIKWID offers a C programming interface. The likwid_markerStart/likwid_markerStop functions let developers demarcate code regions and obtain counter values without leaving the source code. Compared to the widely used PAPI library, LIKWID’s API is intentionally minimal: it hides low‑level register programming, supplies ready‑made event groups, and focuses on x86‑Linux platforms, resulting in faster setup and lower runtime overhead.
To demonstrate the practical value of the suite, the authors conduct two experiments. The first uses the classic OpenMP STREAM triad benchmark on a four‑core machine. When threads are left to the OS scheduler, memory bandwidth suffers from NUMA traffic and cache line migrations. By invoking likwid‑pin to bind each thread to a distinct physical core, the measured bandwidth increases by roughly 30 %, confirming that deterministic affinity reduces cross‑socket traffic and improves cache locality.
The second experiment evaluates a three‑dimensional 7‑point stencil code that has been manually tuned to exploit shared L3 cache. The authors first place all threads on cores that share the same L3 slice using likwid‑pin. Then, with likwid‑features, they disable the hardware prefetcher, which is known to generate unnecessary memory reads for regular stencil patterns. Using likwid‑perfctr, they record L3 cache misses, memory bandwidth, and FLOP counts before and after the changes. The results show a 15 % reduction in memory latency and a 12 % overall runtime improvement, while the counter data clearly illustrate the decrease in cache miss rate.
These case studies validate that LIKWID’s topology discovery, affinity enforcement, counter collection, and feature toggling can be combined to obtain quantitative insights and tangible performance gains with very little effort. The toolset is especially attractive for rapid prototyping, teaching, and research environments where heavyweight instrumentation (e.g., full‑scale profiling frameworks) would be overkill.
The paper concludes by positioning LIKWID as a pragmatic alternative to more complex performance libraries. Future work includes extending support to non‑x86 architectures (ARM, RISC‑V) and integrating lightweight visualisation front‑ends to present topology and counter data in an interactive manner. Overall, LIKWID demonstrates that a well‑engineered, lightweight toolkit can bridge the gap between deep micro‑architectural knowledge and everyday application development on multicore processors.
Comments & Academic Discussion
Loading comments...
Leave a Comment