Zipfs law and log-normal distributions in measures of scientific output across fields and institutions: 40 years of Slovenias research as an example
Slovenia's Current Research Information System (SICRIS) currently hosts 86,443 publications with citation data from 8,359 researchers working on the whole plethora of social and natural sciences from 1970 till present. Using these data, we show that …
Authors: ** Matjaž Perc (Department of Physics, Faculty of Natural Sciences, Mathematics
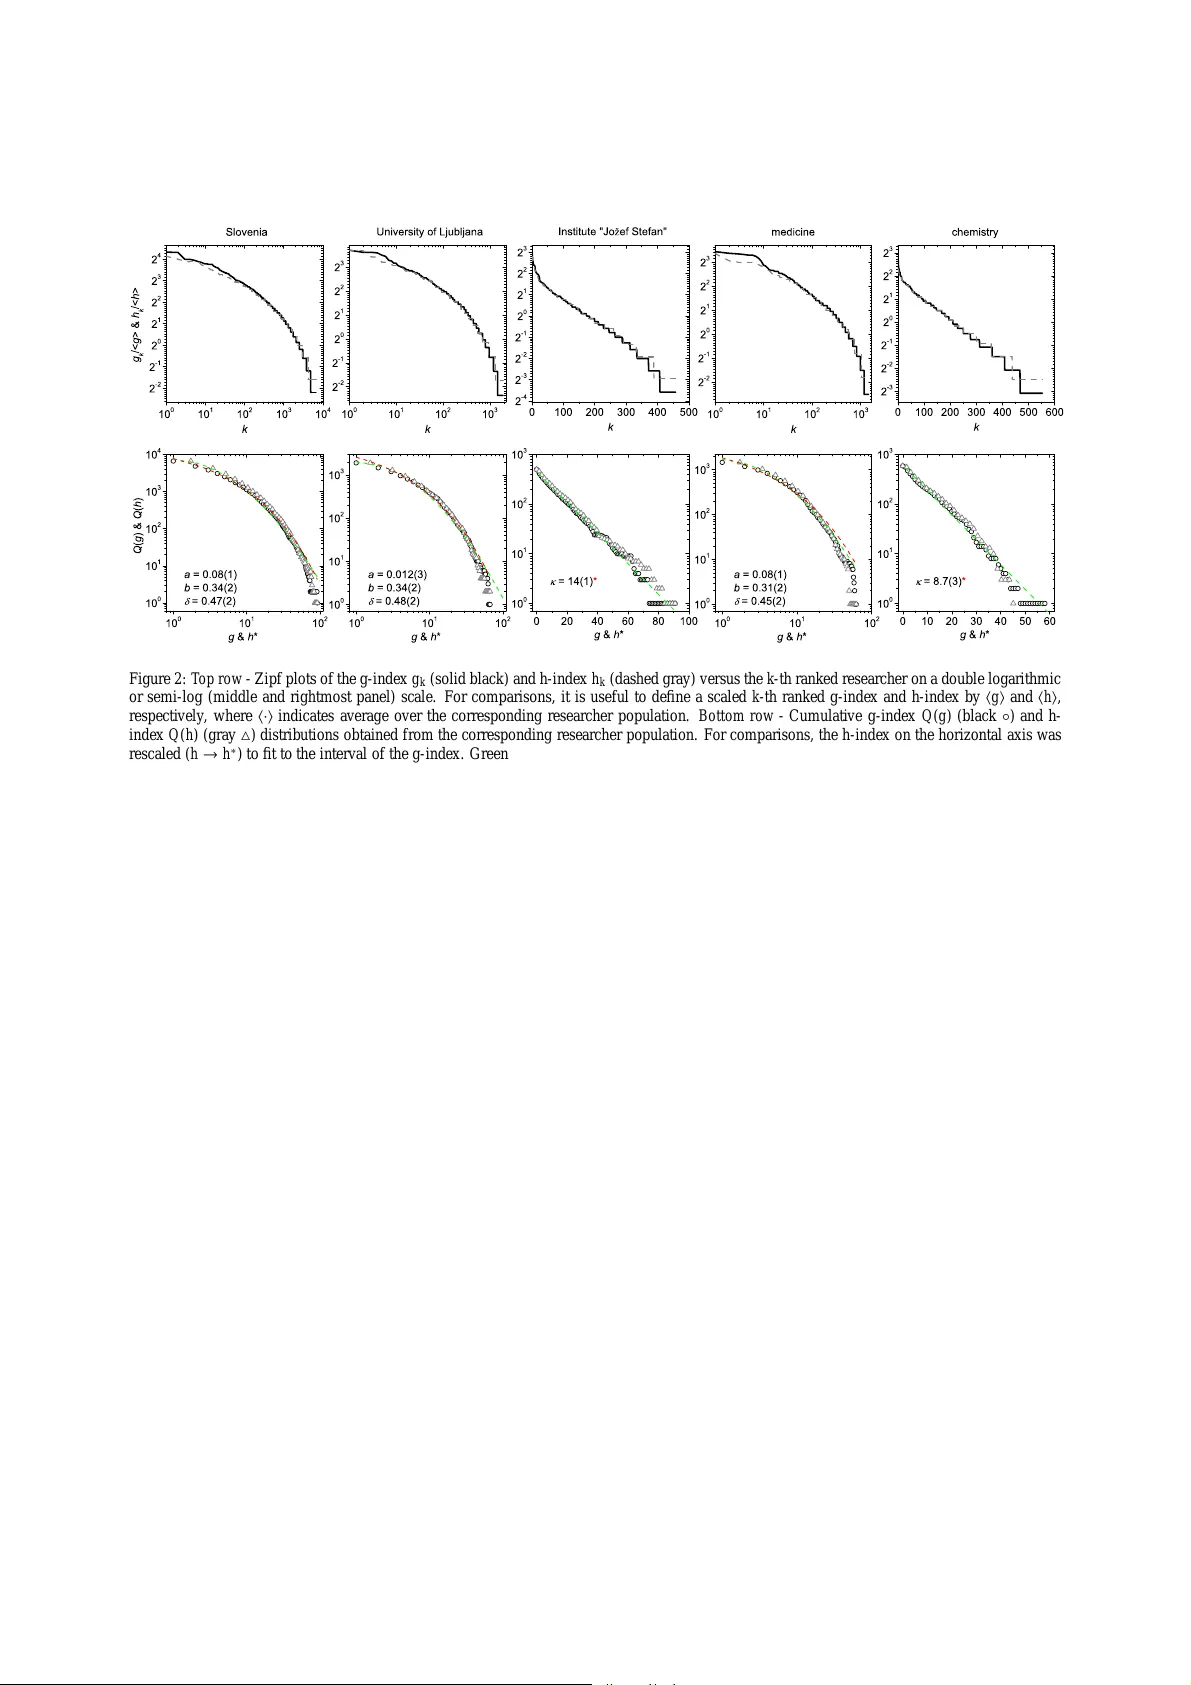
Zipf ’ s la w and log-normal distributions in measures of scientific output across fields and institutions: 40 years of Slo venia’ s research as an e xample Matja ˇ z Perc ∗∗ Department of Physics, F aculty of Natural Science s and Mathema tics, Uni versit y of Maribor , K or oˇ ska cesta 160, SI-2000 Maribor , Slove nia Abstract Slovenia’ s Current Research Info rmation System (SICRIS) currently hosts 86,443 publications with citation data fro m 8,359 researchers working on the whole ple thora of social and natur al sciences from 1970 till present. Using these data, we show that the citation distributions d eriv ed from individual publications h av e Z ipfian pro perties in that they can be fitted by a po wer law P ( x ) ∼ x − α , with α between 2 . 4 and 3 . 1 dep ending on the institution and field of research. Distributions of index es that qu antify the success of researchers rather than individual publicatio ns, on the other hand, cannot b e associated with a power law . W e find that for Egghe ’ s g-ind ex and Hirsch’ s h-ind ex the log- norma l for m P ( x ) ∼ exp[ − a ln x − b (ln x ) 2 ] ap plies best, with a and b d epending m oderately on the u nderly ing set of research ers. In special cases, particularly for institution s with a stro ngly hierar chical co nstitution and resear ch fields with hig h self-citation rates, expon ential distrib utions can be observed as well. Both in dexes yield distributions with equivalent statistical pr operties, which is a strong in dicator for their consistency and logical conn ectedness. At the same time, di ff erences in the assessment o f citation histories of individual researchers strengthe n the ir importan ce for pr operly ev aluating the qu ality and impact of scientific output. K e ywor ds: Zipf ’ s la w, citation distribution, g-index, h-ind ex, rank ing 1. Introduction Raking o f resear chers is b oth impo rtant as well as intere sting. While importan ce is largely d ue to the d etermi- nation of advancement and selection criteria that und erly faculty recruitmen ts or the awarding of research g rants and funds to ind ividuals with best ind icators (Garfield, 1 983; Adam, 20 02; V entura and Mom br ´ u, 2006), the fact th at it is interesting has many mor e aspects worth consider ing. For on e, research ers seem to have a keen interest for de- termining who is th e most cited or the m ost con nected or th e most influential o f them all. Certain ly this in part to gratify the p ersonal sen se of ach iev ement, but mo re intricately , there is a lot we don’t yet u nderstand in term s of how and why certain resear chers g et more attention than oth ers, and wh y some cannot rise above a g iv en level of recogn ition. Scientific excellen ce is definitely a cr ucial facto r to con sider , yet that alone cannot exp lain all the fasci- nating prop erties tha t h ave been revealed in recen t years with regar ds to citatio n distributions (E gghe and Rousseau, 1990; Lah errere and Sornette, 199 8; Redner, 1 998, 2 005; Radicchi et al., 200 8; V ieira and Gomes, 20 10), ind exes that quantify ind ividual scientific outp ut (Hir sch, 2005; Egg he, 2 006, 2008 a; Bornm ann et al., 2008; Zhan g, 2 009; Guns and Rousseau, 200 9; Cabrerizo a et al. , 2010), the importance of first-movers (Newman , 2009) and self-citations (Fo wler and Aksnes, 2007; Schreib er, 2 007, 2008 a), or the structure o f scientific collab oration n etworks (Newman , 2001), to name but a fe w . Empirical studies are impor tant since they p rovide fue l for po tential attempts at mo deling a nd related theoretical approa ches aimed towards deepen ing our u nderstan ding of c itation pr actices, as we ll as for sharpe ning criteria and indexes that quantif y individual scientific output. Notably , on e fact stands quite solid an d ha s bee n po inted out on ∗ Electroni c addre ss: m atjaz .perc@uni-mb .si ; Homepage: http: // www .matjazperc.co m / ∗∗ Supplement ary tab les for this paper are accessible via: http: // www . matjazp erc.com / sicris / st ats.html Prep rint submitted to J ournal of Informetrics Nove mber 1, 2018 se veral occa sions [see e.g. Redner (2005)]. Nam ely that the more one pap er is cited, the more likely it is it will attract further c itations in the futur e. This phen omenon is by no w known un der di ff er ent n ames. Th e Matthew e ff ect (Merton, 1968) is likely the o ldest to d escribe it, but one can come across also cumu lati ve adv antage (de Solla Price, 19 65, 1976) or prefer ential attach ment (Barab ´ asi and Albert, 1999), d ependin g on the field of research and motivation of the stud y . Especially linear preferen tial attachm ent models e njoy exceptional popular ity in d escribing the growth and setup of complex n etworks (Alb ert and Barab ´ asi, 20 02; Dor ogovtsev and Mendes, 2003; Pastor-Satorras and V espignani, 2004) an d h ave b ecome synonym ous fo r power -law distributions of co nnection s that ca n be observed in many of them (Faloutsos et al., 19 99; Sor nette, 200 3; Newman, 2005; Clau set et al., 200 9). Th ere is evidence sugg esting that citation statistics may obey to similar rules, yet deviations f rom th e power -law distribution main tain the reasoning open to amendme nts ( Redner, 20 05), es pecially in the sense of su blinear or near-linear prefer ential attachment, which is k now to yield stretched exponential or log-no rmal forms (Krapivsky et al., 2000; Dorog ovtse v and Mend es, 2 000; Dorogovtsev e t al., 2000; Krapivsky et al., 2001; Krapivsky and Redner, 2001). Here we present the a nalysis o f 4 0 y ears o f Slovenia’ s research o utput ac ross the whole of social and natura l sciences in search for signs of self-organizatio n and l aws that underly many aspects of our existence. Zip f ’ s law (Zipf , 1949) in particula r is related to the frequ ent o ccurren ce o f power-la w distributions, with examp les ranging fr om the frequen cy of words in a gi ven lan guage, incom e ranking s, pop ulation counts of cities to a valanche and forest-fire sizes (Newman , 2005). 1 W e sho w that the citation distrib utions deriv ed from individual pub lications, i.e . dete rmined as the number of pub lications with a certain nu mber of citations, are o f power-la w type, which indeed seems to confirm the assumption of linear pr eferential attachmen t underly ing th eir accu mulation. Howe ver , by taking in to con sideration not individual pub lications but rath er individual research ers, we find that the power-la w distributions g iv e way to log-no rmal, and in spec ial cases a lso exponential (Lahe rrere and S ornette, 1998), distributions. Notably , both the g- index (Eggh e, 2006) and the h-index (H irsch, 2005), as well as the t otal citation cou nt per researcher, show e quiv alent statistical pr operties in term s of their distributions. This su ggests that th ese m easures share a relatively high degree of log ical conn ectedness that cann ot be d istinguished on large scales. However , di ff erences between them can be crucial fo r the ranking of ind ividual researchers within specific g roup s or field s of r esearch. Sinc e log -norm al forms are typically associated with ran dom multiplicative processes, the assumption o f liner pr eferential attach ment as the main driving force b ehind the citation reco rd of an ind i vidual research er seem s no lo nger valid. Certainly it plays a role, but the “persona lity” o f a resear cher brings with it ad ditional factors that re quire a di ff e rent interp retation. An importan t r ole seems to play the fact that all researchers more or less frequently publish papers that don ’t receive a lot of atten tion. At the same time, a research er can gath er a con siderable numb er of citations ev en if s / he do esn’t publish a single hig hly-cited p aper . Altog ether, these co nsideration s, which are absent when consider ing individual pu blications as reference poin ts, amou nt to an ov erride of the power -law distribution. W e also point out that, as discovered alread y by Redner (199 8), not a s ingle fun ction can describe the e xamined distributions over th e whole rang e of v alues. Power laws emerge due to c ollectiv e e ff ects, synonymo us to preferential attachm ent, which apply to well-cited p ublications only . Papers that are n ot cited frequ ently do not benefit f rom such o r similar e ff ects an d are forgotten soon after th eir publication . Presen ted results thus fit well to known facts, as well as provide a cohesive overview of factors that a ff ect the distributions of citation s and other measures of scientific output. The paper is structured as follows. In the next s ection we provide basic facts abo ut Slovenia and the analy zed data set. W e also revie w basic properties of Zipf plots, power -law and log-normal distrib utions, which will be called up on when presenting th e main results in section 3. In the last section we summarize ou r finding s and briefly d iscuss their implications for the national selection criteria currently employed by the Slovenian Research Agency . 2. Preliminaries Slovenia is a small country locate d at the h eart o f Euro pe with a pop ulation of two million. 2 It has a very well- docume nted research history , wh ich is ma de po ssible by SICRIS – Slov enia’ s Cur rent R esearch Information System. 3 At p resent, Slovenia h as 30, 630 registered researchers ( including yo ung and non- activ e r esearchers as w ell as labo- ratory person nel), of which 8,3 59 have at lea st o ne bibliog raphic u nit that is ind exed by th e W eb of Science (W oS). 1 A comprehensi v e list of public ations devo ted to the Z ipf ’ s law is ac cessible via: http: // www .nsli j-genet ics.org / wli / zipf / (by W en tian Li) 2 The o ffi cial W eb pag e of Sloveni a is accessible via: http: // www .slo veni a.si / 3 The SICRIS W eb page is accessible via: http: // sicris.iz um.si / 2 Currently th ere ar e 86 ,443 pub lications linked to W oS with a total of 835,9 70 citations th at have accumu lated from 1970 till presen t. Bibliograp hies of r esearchers are up dated continu ously by a g roup of specialized libraries that cat- alogue new publica tions as soo n as they a re collated, while the citation d ata of all bib liograph ic un its are updated monthly via a direct link to W oS. Since the SICRIS datab ase is p ublicly av ailable, we have retrieved full publica tion reco rds by m eans o f an auto- mated inform ation retrieval algorithm, allowing u s to keep th e statistics as up -to-date a s possible. S ubsequ ently , the bibliogra phic records were parsed for citation co unts a nd oth er measures that are relev ant for assessing the scien tific output of individual researchers. Besides analyzin g the d ata a s a whole, we con sider separa tely the Un iv ersity of Ljubljana (Slovenia’ s oldest and largest University) and the “Jo ˇ zef Stefan” Institute (Slovenia’ s lead ing research In - stitute), as well as researchers that designated medicine or chemistry as their primary research fields. Since the tables are to o big to fit here, we made them av ailable on line at http: // www .matjazperc.co m / sicris / stats.html . T he W eb pag e features tables made also fo r a few o ther institutions and fields of research, but h ere we fo cus on the representativ e and most inter esting examples listed above. Note that th e tables can be or dered accor ding to di ff eren t categories. Some trivia: 4 Slovenia’ s most cited researcher to date is Robert Blinc, having 10 ,891 citations to his name. Slovenia’ s mo st cited p aper, cu rrently h aving 1,37 4 citations, is due to Latif et al. , en titled “I dentification o f the von Hippel-Lin dau disease tu mor supp ressor g ene”, which app eared in Science 260, 13 17-13 20 (1 993). The largest g -index has Uro ˇ s Seljak (92) , while the largest h-in dex ha s V ito T urk (53) . Fr om the 8 6,443 publicatio ns ind exed by W oS 22 ,730 are uncited, 23,20 6 are cited at least 10 times, 72 9 are cited at least 100 times, while 8 ha ve more than 1,000 citations. In wh at f ollows, we first examine the distributions o f citations to individual papers, where by we first constru ct Zipf plots of the nu mber o f citation s x k versus the k -th r anked p aper . On a do uble loga rithmic scale a usable linear fit of the Zipf plot with slope γ ind icates a power-la w d istribution of citations P ( x ) ∼ x − α , where α = 1 + 1 /γ . Like wise, the cu mulative distribution of citation s Q ( x ), defined as the prob ability that a pap er has at least x citations, is pro portion al to x − β , where β = α − 1 = 1 /γ . Note that the join t consider ation o f distributions and cu mulative distributions, besides the fact that the later alleviates statistical fluctuations, is usefu l sinc e it help s to pinpoin t the presence of a po wer law . Namely if P ( x ) ∼ x − α (is a power -law with slope α ), then also Q ( x ) will be a power-law , but with the slope α − 1 rath er th an α . On the o ther h and, if P ( x ) ∼ exp − x /κ (is exponential with slope κ ) then Q ( x ) will also be exponential, but with the same exponen t (Newman, 2 003). Thus, plotting P ( x ) and Q ( x ) on logar ithmic o r semi-logarith mic scales ma kes it easy to distingu ish power-law from exponential d istributions. In a similar fashion, we subseq uently constru ct Zipf plo ts of the g -index g k and the h-ind ex h k versus the k -th ranked researc her, as well as plot the p ertaining cumu lati ve distribution function s Q ( g ) an d Q ( h ). Unlike for ind ividual publicatio ns, the Zipf plots have a negative curvature on a double logarithmic scale o r can be fitted b y a straig ht line o n a semi-lo g scale, which indicates Q ( g ) ∼ exp[ − a ln g − b (ln g ) 2 ] or Q ( g ) ∼ exp( − g /κ ), respecti vely . For individual resear chers we don’t consider th e classical distributions of the g- index P ( g ) and the h-in dex P ( h ) since the statistical flu ctuations are too strong, especially f or the co nsidered su bsets of th e whole po pulation. All n onlinear fits p resented in this p aper have been made with the Levenberg-Marqua rdt m ethod (Press et al., 1 995), and th e goo dness-of-fits has been tested by means o f the coe ffi cien t of d eterminatio n R 2 . Since, however , this p rocedu re can yield substantially in accurate fits, we have als o per formed maximum-likeliho od fittin g and the p -value test, as advocated in the revie w by Clauset et al. (2009). 5 Giv en that Q ( g ) and Q ( h ) have equivalent statistical pr operties, we finally plot the relative rank s (we first rank the researchers acco rding to one ind icator and s ubsequ ently th e ord ered set of num bers is ranked again acco rding to a seco nd ind icator) of researche rs as determine d by th e g- index, the h-ind ex, and th e total citation coun t, showing that maxima l deviations of ind i vidual ran kings increase with the rank nu mber, b ut remain u niformly distributed with respect to the diago nal throughou t the set. Absolute values of the indicators are depicted in sup port of this as well, in turn implyin g their statistical equ iv alence, b ut at th e same time strength ening their importanc e for individual ranking within specific groups of researchers. 3. Results W e start by presentin g Zipf plo ts of the number of citations x k versus the k -th ranked paper o n a doub le logar ithmic scale in the top row of Fig. 1. Results are presented separa tely for Slovenia (all 86,443 pub lications; 835,9 70 citations; 4 Based on publica tion record s retrie ved in January 2010. 5 A comprehensi v e set of metho ds for fitting power laws ac company ing the re vie w is ava ilable via: http: // www .santa fe.edu / aaronc / po werla ws / 3 1 0 0 1 0 1 1 0 2 1 0 3 1 0 4 1 0 5 1 0 0 1 0 1 1 0 2 1 0 3 1 0 0 1 0 1 1 0 2 1 0 3 1 0 0 1 0 1 1 0 2 1 0 3 1 0 4 1 0 5 1 0 0 1 0 1 1 0 2 1 0 3 1 0 4 1 0 0 1 0 1 1 0 2 1 0 3 1 0 0 1 0 1 1 0 2 1 0 3 1 0 0 1 0 1 1 0 2 1 0 3 1 0 4 1 0 0 1 0 1 1 0 2 1 0 3 1 0 4 1 0 0 1 0 1 1 0 2 1 0 3 1 0 0 1 0 1 1 0 2 1 0 3 1 0 0 1 0 1 1 0 2 1 0 3 1 0 4 1 0 0 1 0 1 1 0 2 1 0 3 1 0 4 1 0 0 1 0 1 1 0 2 1 0 3 1 0 0 1 0 1 1 0 2 1 0 3 1 0 0 1 0 1 1 0 2 1 0 3 1 0 4 1 0 0 1 0 1 1 0 2 1 0 3 1 0 4 1 0 0 1 0 1 1 0 2 1 0 3 1 0 0 1 0 1 1 0 2 1 0 3 1 0 0 1 0 1 1 0 2 1 0 3 1 0 4 S l o ve n i a = 0 . 5 8 ( 1 ) x k k P ( x ) & Q ( x ) x U n i ve r si t y o f L j u b l j a n a = 0 . 5 1 ( 2 ) k x I n st i t u t e " Jo e f S t e f a n " = 0 . 5 5 ( 4 ) * k x m e d i ci n e = 0 . 7 1 ( 3 ) k x ch e m i st r y = 0 . 4 7 ( 2 ) k x Figure 1: T op row - Zipf plots of the number of citati ons x k versus the k -th rank ed paper on a double logarithmi c scale. Dashed lines with slope γ in ea ch panel are da ta fits depi cted for visual refere nce. T he red star by t he γ va lue in the middle pa nel indicat es that for the Insti tute “Jo ˇ ze f Stefan” the fit applies to a considerably narrower region than in the other panels. Bottom row - Citati on distri bution s P ( x ) (gray ◦ ) and cumulat iv e cita tion distrib utions Q ( x ) (black △ ) obtained from the number of citations x to indivi dual public ations. Dashed gray and dotte d black lines with slopes α = 1 + 1 /γ and β = 1 /γ , respecti v ely , where γ is take n from the corresponding top panel s, are depicted for visual referenc e. Fittin g the depicted cumulati v e citat ion distributi ons direct ly yields (from left to right): β = 1 . 70(1) , x min = 22 , R 2 = 0 . 999; β = 1 . 92(1) , x min = 25 , R 2 = 0 . 999; β = 1 . 75(2) , x min = 26 , R 2 = 0 . 996; β = 1 . 36(1) , x min = 13 , R 2 = 0 . 997; β = 2 . 06(2) , x min = 18 , R 2 = 0 . 997, where x min is the lower bound of the po wer-la w behavi or (Clauset et al., 2007) and R 2 is the coe ffi c ient of determinat ion. In the middle panel the p -v alue is lowe r than 0 . 1, thus making Q ( x ) ∼ x − β a questionabl e model for the dat a. Numbers in parentheses giv e the error on the last figure. 9.67 per paper), for the Uni versity of Ljubljana (subset of 30,767 publications; 26 3,958 citations; 8.58 per paper), for the “Jo ˇ zef Stefan” Institute (sub set o f 17,42 5 p ublications; 23 0,700 citations; 13.24 p er paper ), as well as for medicine (subset of 19 ,220 publication s; 195 ,119 citation s; 10.15 per paper ) an d chemistry (sub set of 11,37 0 pu blications; 126,0 55 citations; 1 1.09 per p aper) as two representative fields of re search. Apar t f rom deviations at low an d high values of k , it is p ossible to fit a straight line reasonably well to the p lots with th e least-squares fit y ielding the exponents γ as dep icted in the c orrespon ding pa nels. Notably , for the “Jo ˇ zef Stefan” Institute the Z ipf plo t has a slight negative radius acr oss the wh ole span of k , thus mak ing the ap propr iateness of the linea r fit de batable (marked with the red star). In any case, the “Jo ˇ zef Stefan” In stitute is special in that its pub lications have a com paratively high average of citatio ns per p aper (13 .24 c ompared to th e nationa l average of 8.58 ), and that in the past it had a rather strict hierarc hical co nstitution. Depending on the co nsidered set of pu blications, γ ranges fr om 0 . 47 − 0 . 71 , which theoretically corresponds to power-la w distributions P ( x ) ∼ x − α with α between 2 . 41 − 3 . 1 3, or equi valently to cumulative p ower -law distributions Q ( x ) ∼ x − β with β between 1 . 41 − 2 . 13. The bottom row o f Fig . 1 fe atures P ( x ) (g ray ◦ ) and Q ( x ) (black △ ) of th e co rrespon ding Zipf plots f rom th e top row . It can be o bserved that the Z ipf plots tr anslate fairly accurately to their expected power-la w cumu lativ e distributions Q ( x ) ∼ x − β , with Levenberg-Marqu ardt fits of the large- x values, i.e. x ≥ x min , d eliv ering expon ents in agreemen t with β ≈ 1 /γ (see the ca ption of Fig. 1 f or details). Moreover , the correspo nding distributions P ( x ) also show power-la w prop erties in that P ( x ) ∼ x − α on a do uble logarith mic scale, with α ≈ β + 1. Altogether, these r esults are in goo d agre ement with those p resented earlier by Redn er ( 1998), wh ere also the d istribution of citations to individual publication s that were catalogu ed by the Institute fo r Scientific I nform ation an d 2 0 years of publication s in the Ph ysical Revie w D wer e fo und to h ave a large- x power law deca y P ( x ) ∼ x − α with α ≈ 3. Her e we show that these ob servations ar e fairly robust to variations in resear ch field s and institutions, and can indeed be observed for a natio n as a wh ole. Moreover , the prevalence of the Zip f law in citations to individual pu blications across di ff eren t research fields and in stitutions directly implies that the mech anisms underlyin g this pheno menon are 4 1 0 0 1 0 1 1 0 2 1 0 3 1 0 4 2 - 2 2 - 1 2 0 2 1 2 2 2 3 2 4 1 0 0 1 0 1 1 0 2 1 0 0 1 0 1 1 0 2 1 0 3 1 0 4 1 0 0 1 0 1 1 0 2 1 0 3 2 - 2 2 - 1 2 0 2 1 2 2 2 3 1 0 0 1 0 1 1 0 2 1 0 0 1 0 1 1 0 2 1 0 3 0 1 0 0 2 0 0 3 0 0 4 0 0 5 0 0 2 - 4 2 - 3 2 - 2 2 - 1 2 0 2 1 2 2 2 3 0 2 0 4 0 6 0 8 0 1 0 0 1 0 0 1 0 1 1 0 2 1 0 3 1 0 0 1 0 1 1 0 2 1 0 3 2 - 2 2 - 1 2 0 2 1 2 2 2 3 1 0 0 1 0 1 1 0 2 1 0 0 1 0 1 1 0 2 1 0 3 0 1 0 0 2 0 0 3 0 0 4 0 0 5 0 0 6 0 0 2 - 3 2 - 2 2 - 1 2 0 2 1 2 2 2 3 0 1 0 2 0 3 0 4 0 5 0 6 0 1 0 0 1 0 1 1 0 2 1 0 3 S l o ve n i a g k / < g > & h k / < h > k a = 0 . 0 8 ( 1 ) b = 0 . 3 4 ( 2 ) = 0 . 4 7 ( 2 ) Q ( g ) & Q ( h ) g & h * U n i ve r si t y o f L j u b l j a n a k a = 0 . 0 1 2 ( 3 ) b = 0 . 3 4 ( 2 ) = 0 . 4 8 ( 2 ) g & h * I n st i t u t e " Jo e f S t e f a n " k = 1 4 ( 1 ) * g & h * m e d i ci n e k a = 0 . 0 8 ( 1 ) b = 0 . 3 1 ( 2 ) = 0 . 4 5 ( 2 ) g & h * ch e m i st r y k = 8 . 7 ( 3 ) * g & h * Figure 2 : T op r ow - Zipf plots of the g-index g k (solid b lack) and h-inde x h k (dashed gray) versus the k -th ranked resear cher on a double l ogarithmic or semi-log (middle and rightmost panel ) scale. For comparisons, it is useful to define a scaled k -th ranke d g-index and h-index by h g i and h h i , respect iv ely , where h·i indica tes avera ge ov er the corresponding researcher populati on. Bottom row - Cumulati ve g-inde x Q ( g ) (black ◦ ) and h- inde x Q ( h ) (gray △ ) distribut ions obta ined from the correspo nding researcher population. For comparisons, the h-index on the horizontal axis was rescale d ( h → h ∗ ) to fit to the interv al of the g-index . Green dashed lines indi cate log-normal fits of the form Q ( g ) ∼ exp[ − a ln g − b (ln g ) 2 ], where the v al ues of a and b are de picted in e ach pa nel. Where appli cable, red dashe d line s indicate stret ched ex ponentia l fits of t he form Q ( g ) ∼ ex p( − g δ ), where the valu es of δ are d epicted i n ea ch p anel. In the mi ddle and righ tmost pa nel, ho we ve r , the distribut ion is not log-normal b ut exponenti al, such that Q ( g ) ∼ e xp( − g /κ ), where κ ≈ 14(1) and κ ≈ 8 . 7(3), respec ti vely . Numbers in parentheses give the error on the last figure. The goodness-of-fit as determine d via R 2 is beyon d 0 . 99 in all cases, except for the stretche d expo nential fits where it equals 0 . 97. robust as well. The cumulative advantage ( de Solla Price, 1 965, 197 6) of h ighly cited paper s th us works irrespective of particularities that can be associated with ind ividual pu blications. On the other hand, it is also kno wn that considering individual researchers as po ints o f referenc e rather th an individual publication s can lead to rather di ff eren t r esults. In particular, Laher rere and Sornette (1998) reported the occur rence of stretched exponentials rather than power la ws when examin ing the distributions of citatio ns o f most cited phy sicists. W e therefo re perfor m a similar statistical analysis as presented in Fig. 1 also for individual research ers. Zipf p lots of th e g- index g k (solid b lack) and h-in dex h k (dashed gray ) versus the k -th ranked research er on a do uble logarithm ic or semi-log scale (dependin g o n the considered set of researchers) a re pre sented in the top panel of Fig. 2. As above, results are presented separately for Slovenia (all 8,3 59 researchers), for the Uni versity of Ljubljana (subset of 2,3 77 re searchers), for the “Jo ˇ zef Stefan” Institute ( subset o f 501 r esearchers), as w ell as fo r m edicine ( subset of 1,684 research ers) an d chemistry (subset of 58 8 resear chers). By comparin g these results to th ose presented in the top row of Fig. 1, it bec omes clear tha t in case o f individual research ers power laws ar e n o longer possible to advocate. The cu rves either have a negative rad ius across the wh ole set of g k and h k values, or can b e fitted by a straight line on a semi-log scale (m iddle a nd rightm ost pan el). Fu rthermo re, it is remark able to observe th at th e g- index and the h-index (as well as the total citation coun t; not shown) ha ve equiv alent statis tical p roperties in terms of their Z ipf plots as well as th e cor respond ing cumulative distrib utions Q ( g ) and Q ( h ), wh ich a re shown in the bottom row of Fig. 2. W e find that the best fits to the cu mulative distrib utions are ob tained either by means of a log-no rmal Q ( g ) ∼ exp[ − a ln g − b (ln g ) 2 ] or an exponen tial Q ( g ) ∼ exp( − g /κ ) fu nction, wh ere the values of a , b and κ (w here applicable) are depicted in the correspo nding pan els. Notab ly , the dep arture from the lo g-nor mal to the expo nential distribution can be observed for th e “Jo ˇ ze f Stefan” Institute (midd le pane l) a nd for the research field o f chemistry (rightmo st panel). Althou gh it is di ffi c ult to pinp oint exactly why th is happen s, some clues can be gath ered from the self-citation rates. Th e nation al average is 0.1 9, meanin g that 16 0,725 fro m the total of 8 35,97 0 citatio ns are self- citations. Th e University of L jubljana has 0.22 (5 9,988 out of 263, 958), the “Jo ˇ zef Stefan” Institute has 0.20 (4 6,940 5 0 1 0 0 2 0 0 3 0 0 4 0 0 5 0 0 0 1 0 0 2 0 0 3 0 0 4 0 0 5 0 0 k R ( h - i n d e x) k R ( h - i n d e x) k R ( g - i n d e x) k ( t o t a l ci t a t i o n s) 0 1 0 0 2 0 0 3 0 0 4 0 0 5 0 0 0 1 0 0 2 0 0 3 0 0 4 0 0 5 0 0 k ( t o t a l ci t a t i o n s) 0 1 0 0 2 0 0 3 0 0 4 0 0 5 0 0 0 1 0 0 2 0 0 3 0 0 4 0 0 5 0 0 k ( g - i n d e x) 5 1 2 1 0 2 4 2 0 4 8 4 0 9 6 8 1 9 2 1 6 3 2 6 4 1 2 8 g - i n d e x t o t a l ci t a t i o n s 5 1 2 1 0 2 4 2 0 4 8 4 0 9 6 8 1 9 2 1 6 3 2 6 4 h - i n d e x t o t a l ci t a t i o n s 1 6 3 2 6 4 1 2 8 1 6 3 2 6 4 h - i n d e x g - i n d e x Figure 3 : T op r ow - Comparison of r esearcher ranki ngs based on di ff erent indicato rs of their scient ific output. Researc her are first rank ed acc ording to one indic ator . Subsequently , the obtaine d ordered set k is reordered accord ing to the ranking of researc hers based on a second indicat or , thus yieldi ng the relati ve rank k R . Plotti ng k v ersus k R sho ws to what ext end the ranking via the two c onsidered indicato rs di ff er s. If all point would fall on the d iagonal (de picted da shed gree n for visual re ference ), this w ould imply that the tw o i ndicators yi eld an identic al ranking of the con sidered set of re searchers. Compared pai rs of ind icator are (f rom left to right): total nu mber of ci tation s versus the g-index, tota l number of citations versus the h-inde x, and g-index versus the h-inde x. Bottom row - Comparisons of absolute v alues of the indicators, correspondi ng to the pairs considered in the top panel s. A double logarithmic scale is used because of the substantially di ff erent m aximal v alues of the compared indicators. Note also that the top-se eded researche rs in thi s representat ion are po sitioned top right rath er than bottom left. In all the panel s top 500 researche rs are displayed. out of 2 30,70 0), medicin e has 0.13 (2 6,284 o ut o f 19 9,947 ) while ch emistry has 0.31 (38,6 59 out of 12 4705) . Fro m these values it can be conclu ded that fields of resear ch with a relatively high s elf-citation rate, such as chemistry in our case, are more likely to yield e xpon ential d istributions of scientific ou tput related t o indi vidual research ers. Regarding the “Jo ˇ zef Stefan” Institute, which also featur es an expon ential Q ( g ), we have already noted its past rather strict hierarchica l constitution, which may have adversely a ff ected the rank ing of subo rdinate individuals (or promoted the ranking of superior individuals). It i s worth n oting that the log- normal f orm applied in the bottom row o f Fig. 2 (green dashed line) can in our case be replaced f airly well also by a stretched exponential Q ( g ) ∼ exp( − g δ ) (red dashed line), which was r eported by L aherrere and Sornette ( 1998), thu s makin g o ur r esults essentially in agreeme nt with earlier works and extending their validity beyon d spec ific field s o f researc h as well as institutions. Lastly regard ing the re sults presented in Fig. 2, it is inter esting to note that log-no rmal distributions were reported recently also by Redner (2005) for the citation data of 110 years of the Physical Revie w . Although ther e ind i vidual paper s were taken as poin ts o f referenc e, and one cou ld therefore expect the p rev alence of power -law distrib utions in accorda nce with earlier works (Redner, 1998) and our Fig. 1, the fact that only internal citations ( i.e . citatio ns from Physical Revie w articles to other Physical Re vie w articles) were consider ed might ha ve been a factor contr ibuting to the deviation. W ith respect to the statistical equality of d istributions of the g-ind ex and the h-in dex (as well as the total citation count; not shown) it is instructive to examin e relative ranking s of pairs of d i ff erent indicator s. First o rdering the researchers by rank accord ing to th eir to tal citation count, i.e. their total numb er of citatio ns, an d then ranking again the ordered set of nu mbers according to the g-in dex, yield s how (and in wh ich direction) the ran king of an individual di ff ers wh en evaluated via the total citation co unt o r via the g-index. This c an be made for d i ff erent combinatio ns of scientific outpu t in dicators, as presented in the top row of Fig. 3 for the top 500 researchers of Slovenia. It can be o bserved that di ff eren ces in ranking are indeed p resent, but they seem equally p robable in b oth dire ctions f or any giv en k – it is not as if a giv en indic ator would systematically d owngrade o nly those with low k , for example. It is also interesting to note tha t the deviations from the dia gonal become larger with in creasing k , wh ich indicates that lower -ranking resear chers ar e mor e likely to be rated di ff erently by di ff erent measure s, wh ile high -rankin g r esearchers will r emain top-seed ed irrespective of which indicato r is used . Impor tantly , howe ver , this ob servation is n ot en tirely 6 surprising becau se, as we m ove tow ards the lower rankings, more an d more researcher s will h av e the same indicator so that small absolu te ch anges o f the in dicator are more likely to lead to large c hanges in the rank. W e theref ore show in the bottom row of Fig . 3 the pertainin g comparison s of absolute values of the di ff erent indic ators for the top 500 re searchers, wh ich h owe ver , confirm to a large extend that th e rankin g via di ff eren t indicators is mo re likely to deviate f or lower-ranking than for the to p-seeded r esearchers. Given the d efinitions of the g-ind ex (Eg ghe, 20 06) and the h-in dex (Hirsch, 200 5), as well as their relatedness to the to tal citation count, these results a re n ot sur prising and con firm the consistency and lo gical connected ness of these m easures. At the same time, they pr ovide so me justification as to why th e distributions of th e g- index and the h-in dex are practically e quiv alent (see Fig. 2), but also point out the fact that the p roperties of citation re cords of each individual are cr ucial for its r anking within a giv en group . Di ff erent indexes an d m easures o f scientific outp ut (Hirsch, 200 7; I glesias and Pecharrom an , 2007; Jin et al., 2007; Sidiropo ulos et al. , 200 7; Rousseau and Y e, 2008; Bar-Ilan, 2008) are therefo re extreme ly usefu l an d indeed much needed to properly e valuate the quality and impact of individual researc hers. 4. Summary In sum, we h ave shown that th e distributions of citations per p ublication for di ff eren t institutions and research fields, as w ell as Slovenia as a whole, have Zipfian p roperties in that they can be fitted fairly accurately by a power law . On the oth er hand, taking into account in dividual r esearchers rathe r than publications, we have shown th at the cu- mulative d istributions of Eggh e’ s g-index and Hirsch’ s h-index are consistent with a log-norm al, or in ca se of research fields with high self-citation rates or organization s with a special con stitution, an expon ential form. In terestingly , the distributions o f the tw o index es are s tatistically equi valent, thus implying their consistency and logical connected ness, but at the same time also streng thening their importanc e for p roperly assessing the scientific outpu t of individual re - searchers. As a cautiona ry n ote with respect to th e nation al selection cr iteria cur rently emp loyed by the Slovenian Research Agency (ARRS 6 ), we no te that a fa vorable bias in ranking emerges due to not tak ing into account the num- ber of co-autho rs when ev aluating th e citation data o f ind i vidua l r esearchers (W an et al., 2007; Sch reiber, 20 08b,c; Egghe, 200 8b). Consequ ently , researchers that ar e memb ers of collabo ration ne tworks inv olved in Particle Phy sics research ( e.g. DELPHI, Belle or HERA-B) do minate the rankings. W e hop e the study will be useful for deriving the- oretical mod els (Eggh e , 2009) explain ing th e emergen ce of empirically observed distributions and fo r drawing furth er attention to this interesting topic. Acknowledgments Matja ˇ z Perc thanks Matej Horvat fro m Hermes SofL ab for illuminatin g lessons on socket programm ing an d auto- mated in formatio n retriev al fr om th e Internet. Financia l sup port fr om th e Slovenian Researc h Agency ( grant Z1 -2032 ) is gratefully acknowledged as well. References References Adam, D., 2002. The counti ng house. Nature 415, 726–729. Albert, R., Barab ´ asi, A. L., 2002. Statistica l mechani cs of complex networks. Re v . Mod. Phys. 74, 47–97. Bar-I lan, J., 2008. Informetrics at the beginnin g of the 21st century - A revie w . J. Informet rics 2, 1–52. Barab ´ asi, A. L., Albert, R., 1999. Em erge nce of scaling in random netwo rks. Science 286, 509–512. Bornmann, L., Mutz, R., Daniel, H.-D., 2008. Are there bett er indic es for ev al uation purposes than the h inde x? A compari son of nine di ff erent v ariants of the h index using data from biomedi cine. J . Amer . Soc . Inform. Sci. 59, 830–837. Cabreri zoa, F . J., Alonso, S., Herrera-V ie dma, E., H errera, F ., 2010. q 2 -inde x: Quantitati v e and qualit ati ve ev alua tion based on the number and impact of papers in the hirsch core. J. Informet rics 4, 23–28. Clauset , A., Y oung, M., Gleditsch, K. S., 2007. On the Frequency of Sev ere T e rrorist Attacks. Journal of Conflict Resolutio n 51, 58–87. Clauset , A., Shalizi, C. R., Newman, M. E. J., 2009. Po wer-la w distributio ns in empi rical data. S IAM Re vie w 51, 661–703. de Solla Price, D. J., 1965. Netwo rks of s cient ific papers. Science 149, 510–515. 6 The ARRS W e b page is accessibl e via: http: // www .arrs.go v .si / 7 de Solla Price, D. J., 1976. A gener al theory of bibliometric and other cumulati ve advan tage processes. J. Amer . Soc. Inform. Sci. 27, 292–306. Dorogov tse v , S. N., Mendes, J. F . F ., 2000. Scaling beha viour of dev elopi ng and decayi ng networks. Europhys. Lett. 52, 33–39. Dorogov tse v , S. N. , Mendes, J. F . F ., Samukhin, A. N., 2000. Structure of Growing Networks Wit h Preferential Linking. Phys. Rev . Lett. 85, 4633–4636. Dorogov tse v , S. N., Mendes, J. F . F . , 2003. Evoluti on of Networ ks: From Biological Nets to the Interne t and WWW . Oxford Univ ersity Press, Oxford. Egghe, L., 2006. Theory and practi se of the g-index. Scientomet rics 69, 131–152. Egghe, L., 2008a. The influen ce of transformations on the h-index and the g-inde x. J. Amer . Soc. Inform. Sci. 59, 1304–1312. Egghe, L., 2008b. Mathematica l theory of the h- and the g-index in case of fractiona l countin g of authorship. J. Am er . Soc. Inform. Sci. 59, 1608–1616. Egghe, L., 2009. Mathema tical deriv ati on of the impact fa ctor distributi on. J. Informetri cs 4, 290–295. Egghe, L. , Rousseau, R., 1990. Introduct ion to Informetrics: Quantitat iv e Methods in Library , Documentation and Information Science. Else vier , Amsterdam. Falo utsos, M., Falou tsos, P ., Falou tsos, C., 1999. On power -la w relationship s of the internet topology . In: SIGCOMM ’99: Proceedings of the confere nce on Applications, technologi es, archit ectures, and protocols for computer communica tion. ACM, Ne w Y ork, NY , USA, pp. 251–26 2. Fo wler , J. H., Aksnes, D. W ., 2007. Does self-cita tion pay? Scient ometrics 72, 427–437. Garfield, E., 1983. Ho w to use citat ion anal ysis for faculty ev al uations, and when is it rel ev an t? Current Contents 45, 5–146. Guns, R., Rousseau , R., 2009. Real and rational vari ants of the h-i ndex and the g-inde x. J . Informetri cs 3, 64–71. Hirsch, J. E., 2005. An inde x to quantify an indiv idual’ s scient ific research output. Proc. Natl. Acad. Sci. USA 104, 16569–16572. Hirsch, J. E., 2007. Does the h inde x have predi cti ve power? Proc. Natl. Acad. Sci. USA 102, 19193–19198 . Iglesias, J. E., Pecha rroman, C., 2007. Scaling the h-index for di ff erent scientific ISI fields. Scientome trics 73, 303–32 0. Jin, B. H., Liang, L. M., Roussea u, R., Egghe, L. , 2007. The R- and AR-indi ces: Complementi ng the h-index. Chin. Sci. Bull. 52, 855–863. Krapi vsky , P . L., Redner , S., Leyvraz, F ., 2000. Connecti vit y of Growing Rando m Networks. Phys. Rev . Lett. 85, 4629–4632. Krapi vsky , P . L., Rodgers, G. J., Redner , S., 2001. Degree Distrib utions of Growing Random Netw orks. Phys. Rev . L ett. 86, 5401–5 404. Krapi vsky , P . L., Redner , S., 2001. Organiza tion of growing random netw orks. Phys. Rev . E 63, 066123. Laherrere , J., Sornette, D., 1998. Stret ched exponenti al distr ibuti ons in nature and economy: “f at tails” with char acterist ic scales. Eur . Phys. J. B 2, 525–539. Merton, R. K., 1968. The Matthe w e ff ect in science . Scienc e 159, 56–63. Ne wman, M. E. J., 2001. The structure of scienti fic colla boration networks. Proc. Natl. Acad. Sci. USA 98, 404–409. Ne wman, M. E. J., 2003. The structure and function of complex netw orks. SIAM Revie w 45, 167–256. Ne wman, M. E. J., 2005. Power la ws, Pareto distrib utions and Zipf ’ s law . Cont emporary Physics 46, 323–351. Ne wman, M. E. J., 2009. The first-mover a dva ntage in scie ntific publicati on. EPL 86, 68001. Pastor -Satorra s, R., V espignani , A., 2004. Evoluti on and Structure of the Interne t: A Statistical P hysics Approac h. Cambridge Uni versit y Press, Cambridge . Press, W . H., T euk olsky , S. A., V etterli ng, W . T . , Flannery , B. P ., 1995. Numerical Recipes in C. Cambridge Univ ersity Press, Cambridge. Radicc hi, F ., Fortuna to, S., Ca stellano, C., 2008 . Uni ve rsality of citation distrib utions: T o wa rd a n obje cti ve measure of scienti fic impact. Proc . Natl . Acad. Sci. USA 105, 17268–1 7272. Redner , S., 1998. How pop ular is your paper? An empirical study of the citation distrib ution. E ur . Phys. J. B 4 , 131–134. Redner , S., 2005. Citati on Statistics from 110 Y ears of Physical Revi e w . Physics T oday 58, 49 –54. Rousseau, R., Y e, F . Y ., 2008. A proposa l for a dynamic h-type index. J. Amer . Soc. Inform. Sci. 59, 1853–18 55. Schreibe r , M. , 2007. Self-ci tation corrections for the hirsch index. EPL 78, 30002. Schreibe r , M. , 2008a. The influenc e of self-citati on correcti ons on eg ghes g index . Scientometric s 76, 187–200. Schreibe r , M. , 2008b. A modifica tion of the h-index: The h m -inde x accounts for multi-authored manuscripts. J. Informetrics 2, 211–216. Schreibe r , M. , 2008c. T o share the fame in a fair way , h m modifies h for multi-autho red manuscri pts. New J. Phys. 10, 040201. Sidiropoul os, A., Katsaro s, D. , Manolopo ulos, Y ., 2007. General ized hirsch h-inde x for disclosing latent facts in citation networks. Scientomet rics 72, 253–280 . Sornette , D., 2003. Critical Phenomena in Natural Sciences, chapter 14. Springer , Heidelber g. V entura , O., Mombr ´ u, A. W ., 2006. Use of bibliome tric informati on to assist research polic y making. A comparison of publicat ion and citat ion profiles of full and associat e professors at a school of chemistry in uruguay . Scientome trics 69, 287–313. V ie ira, E. S., Gomes, J. A. N. F ., 2010. Citations to scientific articles: Its distrib ution and dependence on the article featur es. J. Informetric s 4, 1–13. W a n, J., Hua, P ., Rousseau, R., 2007. The pure h-inde x: calcul ating an authors h-index by taking co-authors into accoun t. Collnet Journal of Sciento metrics and Information Managemen 1, 1–5. Zhang, C.-T ., 2009. The e-index, complement ing the h-inde x for excess cit ations. P LoS ONE 4, e5429. Zipf, G. K., 1949. Human Beha vior and the Principle of Least-E ff ort. Addison-W esley , Readi ng MA. 8
Original Paper
Loading high-quality paper...
Comments & Academic Discussion
Loading comments...
Leave a Comment