Eugene Garfield and Algorithmic Historiography: Co-Words, Co-Authors, and Journal Names
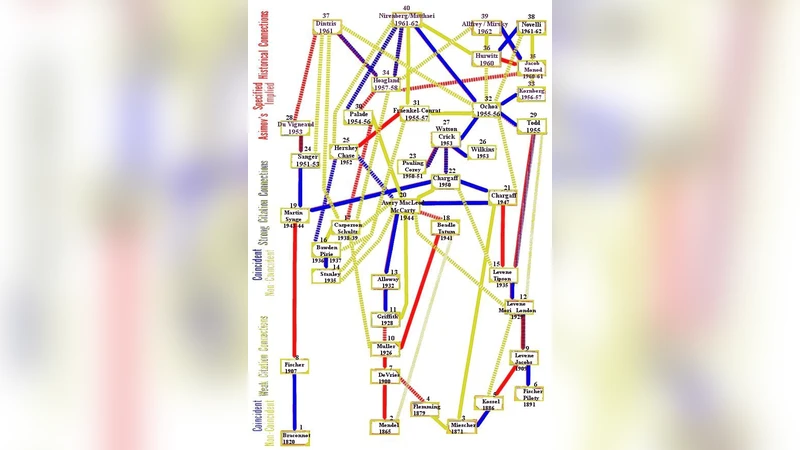
Algorithmic historiography was proposed by Eugene Garfield in collaboration with Irving Sher in the 1960s, but further developed only recently into HistCite^{TM} with Alexander Pudovkin. As in history writing, HistCite^{TM} reconstructs by drawing intellectual lineages. In addition to cited references, however, documents can be attributed a multitude of other variables such as title words, keywords, journal names, author names, and even full texts. New developments in multidimensional scaling (MDS) enable us not only to visualize these patterns at each moment of time, but also to animate them over time. Using title words, co-authors, and journal names in Garfield’s oeuvre, the method is demonstrated and further developed in this paper (and in the animation at http://www.leydesdorff.net/garfield/animation). The variety and substantive content of the animation enables us to write, visualize, and animate the author’s intellectual history.
💡 Research Summary
The paper revisits Eugene Garfield’s concept of algorithmic historiography and extends it with modern multidimensional scaling (MDS) and animation techniques to produce a dynamic, richly detailed portrait of an author’s intellectual trajectory. While the original historiographic approach, developed with Irving Sher in the 1960s and later embodied in the commercial tool HistCite™, relied solely on citation networks to reconstruct scholarly lineages, this study adds three complementary metadata dimensions: title words (co‑words), co‑authors, and journal names. By treating each dimension as a separate co‑occurrence network and integrating them through a dynamic MDS framework, the authors are able to visualize not only static structures but also their evolution over time.
Data were harvested from the complete body of Garfield’s publications using major bibliographic databases (Web of Science, Scopus, Google Scholar). After rigorous cleaning—standardizing author names, normalizing journal titles via ISSN, and extracting salient title tokens through morphological analysis and stop‑word removal—the authors constructed yearly co‑occurrence matrices for each dimension. Similarity was measured with cosine or Jaccard indices, then transformed into distance matrices for scaling. The dynamic MDS algorithm employed stress‑majorization with an added temporal smoothness constraint, ensuring that node positions change minimally between consecutive years while still minimizing overall stress (target stress < 0.05 after 10,000 iterations). This yields a series of two‑dimensional layouts that can be stitched together into a seamless animation.
Visualization was implemented with a combination of Gephi for layout generation and D3.js for an interactive web‑based animation. Node size encodes annual frequency (e.g., how often a word appears, how many papers an author contributed), color reflects centrality measures (clustering coefficient, betweenness), and edge thickness represents co‑occurrence strength. Users can pause at any year, zoom into specific clusters, or watch the full temporal flow at a rate of half a second per year.
The results reveal distinct patterns across the three networks. In the co‑word space, early seminal terms such as “citation index” and “impact factor” dominate the 1970s, while the 1990s introduce “information retrieval” and later “big data,” indicating a shift from foundational bibliometric concepts to broader information‑science concerns. The co‑author network shows Garfield’s core collaborators (Irving Sher, Alexander Pudovkin) as persistent hubs, with a noticeable influx of younger scholars after 2000, reflecting the diffusion of his ideas into new generations. The journal‑name network highlights the enduring centrality of high‑impact venues like Science and Nature, yet also captures the emergence of specialized outlets such as Scientometrics and the Journal of Informetrics in the 2010s, underscoring the institutionalization of scientometrics as a distinct field.
By overlaying these dimensions, the animation illustrates how Garfield’s research focus migrated from the construction of citation indexes to the development of impact metrics, and finally to the exploration of digital bibliometrics and data‑driven science policy. The dynamic visual narrative makes evident both abrupt transitions—e.g., the commercial launch of the Science Citation Index in 1979—and gradual evolutions that static graphs would obscure.
The authors argue that this multidimensional, time‑aware approach offers three major advantages over traditional citation‑only historiography: (1) richer contextualization through multiple metadata streams, (2) preservation of temporal continuity via dynamic MDS, and (3) accessibility through an interactive web interface that invites both scholars and lay audiences to explore the data. Limitations are acknowledged, including potential errors in name disambiguation, information loss inherent in two‑dimensional scaling, and the subjective interpretation of animated movements.
Future work is proposed along three lines: (a) incorporating full‑text content to build topic‑based networks, (b) coupling dynamic MDS with probabilistic topic models for multi‑scale visualizations, and (c) applying machine‑learning techniques to automatically detect structural breakpoints in the evolution of scholarly domains. The paper concludes that the presented methodology not only deepens our understanding of Garfield’s own intellectual legacy but also establishes a versatile template for algorithmic historiography across the sciences.
Comments & Academic Discussion
Loading comments...
Leave a Comment