Spatio-Temporal Graphical Model Selection
We consider the problem of estimating the topology of spatial interactions in a discrete state, discrete time spatio-temporal graphical model where the interactions affect the temporal evolution of each agent in a network. Among other models, the sus…
Authors: ** Patrick Harrington, Alfred Hero (University of Michigan) **
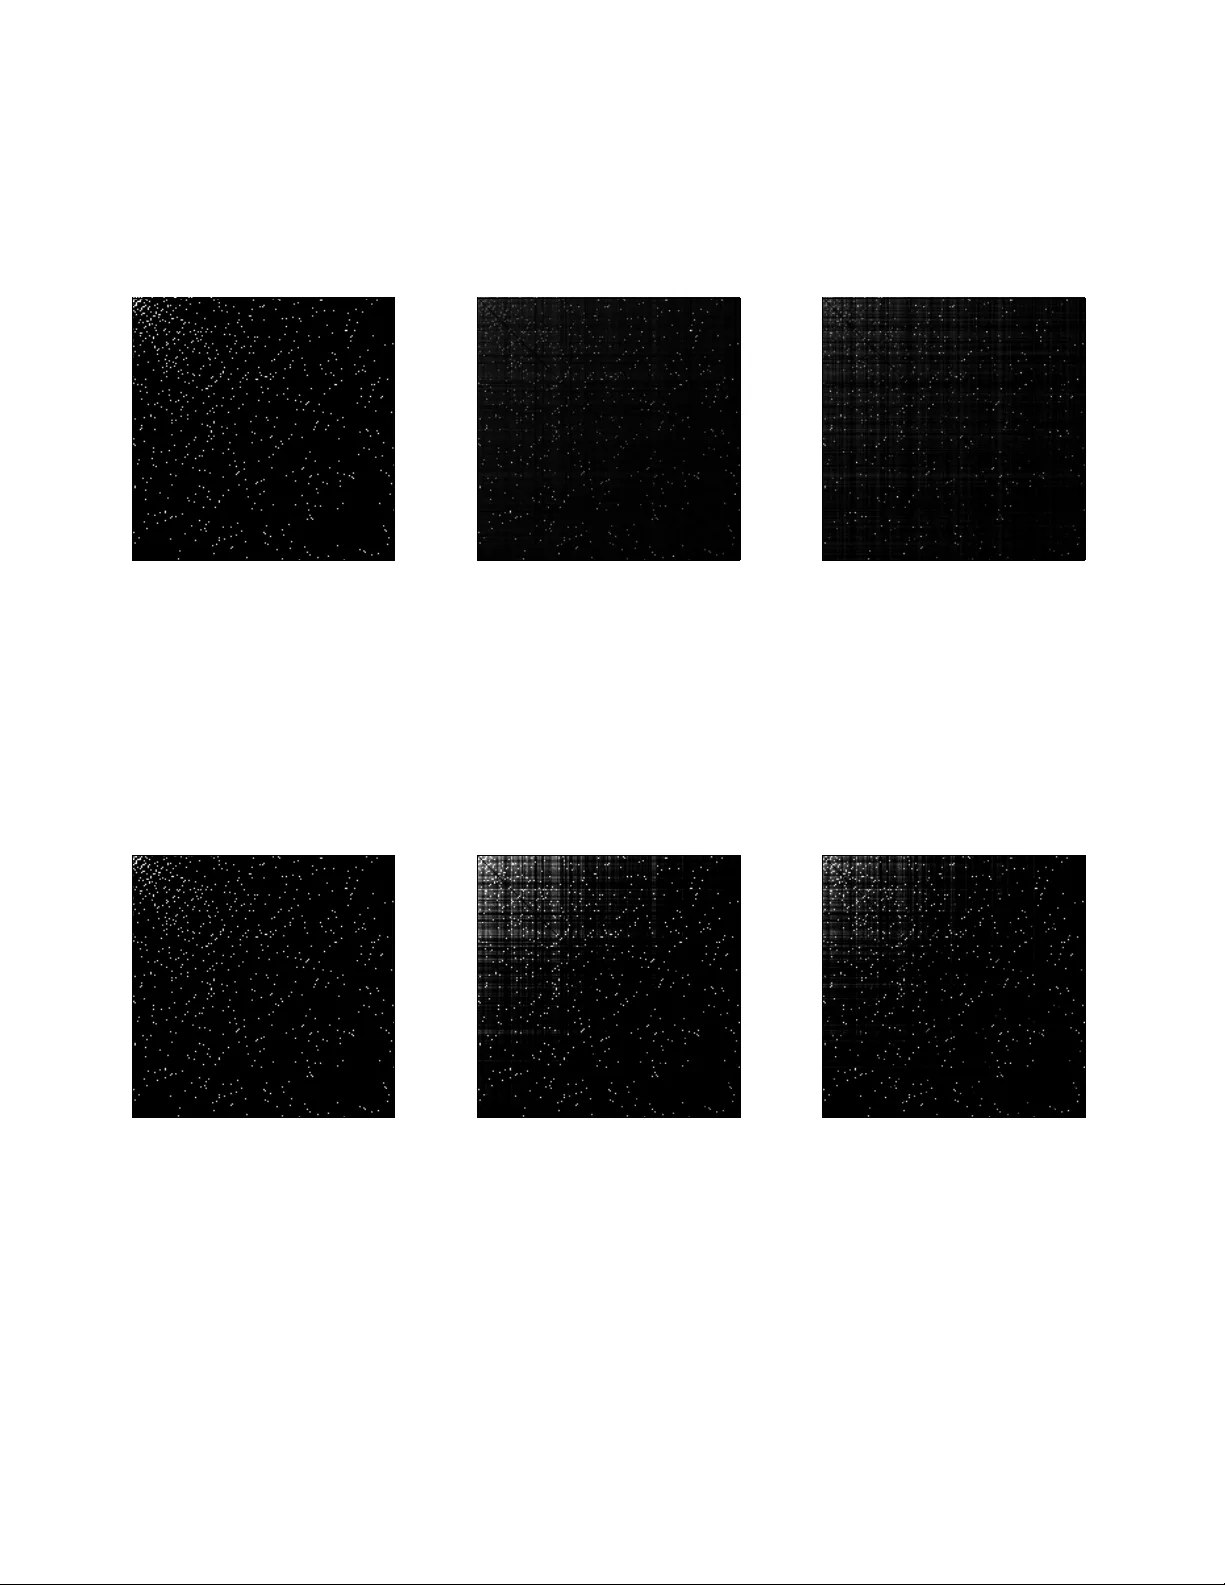
Submitte d to the Annals of Applie d Statistics SP A TIO-TEMPORAL GRAPHICAL MODEL SELECTION ∗ By P a trick Harrington † , Alfred Her o † University of Michigan † W e consider the problem of estimating the top ology of spatial in- teractions in a discrete state, discrete time spatio-temp oral graphical mo del where the interactions affect the temporal ev olution of each agen t in a netw ork. Among other mo dels, the susceptible, infected, reco vered ( S I R ) model for in teraction ev ents fall in to this framework. W e pose the problem as a structure learning problem and solv e it us- ing an ` 1 -p enalized likelihoo d conv ex program. W e ev aluate the solu- tion on a simulated spread of infectious ov er a complex netw ork. Our top ology estimates outp erform those of a standard spatial Marko v random field graphical model selection using ` 1 -regularized logistic regression. 1. In tro duction. This pap er treats the problem of learning the inter- action structure of a spatio-temporal graphical model for a discrete state an d discrete time stochastic pro cess known as the susceptible, infected, recov ered ( S I R ) model. The presence of spatial in teractions cause adjacent no des in the graph to affect eac h others states o ver time. Learning the topology of this graph is known as mo del selection. W e cast this graphical mo del selection problem as a p enalized likelihoo d problem, resulting in a conv ex program for whic h con v ex optimization solv ers can b e applied. S I R spatio-temp oral graphical models are commonly used in mo deling the random propagation of information b et w een no des in large netw orks in bioinformatics, signal pro cessing, public health, and national security ( 4 ; 9 ; 21 ). Kno wing the net- w ork link structure allows accurate prediction of individual no de states and can aid the developmen t of control and in terven tion strategies for such net- w orks. This pap er develops a tractable metho d to estimate the topology of the net work for the S I R spatio-temp oral graphical mo del from empirical data. Exact solutions of the graphical mo del selection problem is NP hard due to the combinatorial nature of en umeration through the discrete space of p ossible graph top ologies. Researchers studying Ba yesian net w orks, b oth ∗ This researc h was partially supported b y the AFRL A TR Center through a Signal Inno v ations Group sub contract, gran t num b er SIG F A8650-07-D-1221-TO1 AMS 2000 subje ct classific ations: Primary 60K35, 60K35; secondary 60K35 Keywor ds and phr ases: SIR Mo dels, Dynamic Bay esian Netw orks, Mo del Selection, ` 1 - Regularization, Structure Learning, Conv ex Risk Minimization 1 2 HARRINGTON AND HER O static and dynamic, hav e developed exact and appro ximate metho ds for se- lecting a go o d candidate top ology ( 5 ; 8 ; 20 ). Suc h metho ds are appropriate for netw orks of small size and of unknown generativ e mo dels for the obser- v ations. How ever, they are difficult to scale to larger graphs. S I R pro cesses are used to mo del transmission ev ents on complex net works whic h tend to b e sparse in their interactions ( 22 ; 3 ; 21 ; 7 ; 4 ), so that there are relativ ely few edges in the graph. Over the past decade sparse regularization metho ds ha v e b een developed for graphical mo del selection using ` 1 -regularization and other approaches. Examples include Gaussian graphical mo dels (GMMs) ( 18 ; 10 ; 33 ; 26 ; 24 ) and Marko v random fields (MRFs) ( 16 ; 31 ; 26 ). The S I R mo del used throughout this paper is both discrete state and dis- crete time and th us any ` 1 -p enalized GMM metho d that is designed for real v alued Gaussian random v ectors would not b e appropriate for this mo del. The structure learning algorithms for MRFs discussed in ( 16 ; 31 ; 26 ) are designed for discrete samples drawn from a MRF and most are limited to binary states (the S I R mo del has three states and is a different genera- tiv e mo del than the MRF). Researc h in MRFs and GMMs ha ve successfully used the ` 1 -p enalt y to control the sparseness of the estimated graphical mo del top ologies and we will adopt this approac h for the S I R mo del. The metho d presented in this pap er also scales to large net works more easily than traditional Bay esian net w ork structure learning algorithms ( 5 ; 8 ; 20 ). The prop osed sparse structure learning metho d is designed for graphs that incorp orate random causal transmission even ts affecting the ev olution of the no de states, suc h o ccurs in the propagation of infectious disease. Iden tifying the structure of so cial net works in trac king epidemics has received increased atten tion due to the global resp onse to pandemic influenza A (H1N1) 2009. W e illustrate the accuracy of the prop osed netw ork structure learning on t w o mo derate sized complex netw orks using real-w orld epidemiological pa- rameters that appro ximate an H1N1 flu inspired outbreak ( 32 ). W e compare p erformance of the prop osed estimation metho d against a MRF graphical mo del selection using ` 1 -regularized logistic regression ( 31 ). The prop osed metho d is more accurate than generic approaches such as ( 31 ) for detection of anomalous netw ork structure given sampled data from a spatio-temporal S I R process. 2. SIR Spatio-T emp oral Graphical Mo dels. The S I R graphical mo del has b een used to approximate the general problem of mo deling the ev olution of no de states in a net w ork in whic h there is random transmission of disease or information b etw een adjacen t no des on a graph ( 3 ; 21 ; 7 ; 4 ). In the limit of large p opulations with equal mixing rates, S I R mo dels hav e b een SP A TIO-TEMPORAL GRAPHICAL MODEL SELECTION 3 used to mo del population prop ortions of particular states using differen tial equations ( 1 ; 25 ; 19 ; 13 ). Unlike these studies, this pap er addresses the problem of estimation of the top ology of interactions b et w een individual no des in the netw ork. The S I R graphical mo del is a discrete time, discrete state mo del for the states of nodes in the netw ork. No des can only affect the states of adjacent no des in the netw ork when they are in the “infected” state. The state of a no de is giv en by X i,k , where i refers to the individual (no de) and k denotes time, and X i,k tak es on v alues x ∈ { 0 , 1 , 2 } (corresp onding to “susceptible”, “infected”, and “reco vered”, resp ectively). The mo del is sp ecified by the state transition probabilities given in the 3x3 sto chastic matrix (2.1) P i,k | k − 1 = 1 − q i,k | k − 1 0 γ q i,k | k − 1 1 − α 0 0 α 1 − γ where q i,k | k − 1 is the probabilit y of transmission from “infected” neigh b ors of no de i at time k , γ is the probabilit y that no de i transitions from “reco vered” to “susceptible”, and α is the probability that no de i transitions from “in- fected” to “reco vered”. Since ( 2.1 ) allows a transition from reco v ered bac k to susceptible, this is actually a S I RS mo del ( S I R and S I RS will b e used in terc hangeably to refer to the three state sto c hastic pro cess). F or p no des, the spatial top ology of the netw ork is defined b y the in terconnectivity , or adjacency , matrix (2.2) E = E 1 , 1 · · · E 1 ,p . . . . . . . . . E p, 1 · · · E p,p where the l , m th en try E l,m ∈ { 0 , 1 } is the indicator ev ent that no des l and m are connected. The pattern of non-zero en tries in ( 2.2 ) sp ecifies the in terconnection top ology of the net work. The fundamen tal assumptions for an S I R net w ork mo del is that the transition probabilities do not dep end on no de i while the in terconnectivity matrix ( 2.2 ) is indep enden t of time k . Under these assumptions, the joint distribution of an observed tra jectory of length T , represented by the p -dimensional discrete state v ector X k = [ X 1 ,k , . . . , X p,k ] T , factorizes (2.3) P ( X 1 , . . . , X T ) = T Y k =2 P ( X k | X k − 1 ) = T Y k =2 p Y i =1 P X i,k |{ X j,k − 1 } j ∈{ η ( i ) ,i } , 4 HARRINGTON AND HER O where the neigh b orho o d of no de i is denoted (2.4) η i = { j : E i,j 6 = 0 } . The core comp onent of most v ariations of the S I R mo del is the assumption that node i is conditionally indep endent of all non-neigh b oring no des given the states of no de i and its neigh b ors at time k − 1. Each neighbor can trans- mit the “infection” to no de i indep enden t of the others neighbors. Under these assumptions, the probability of at least one transmission to no de i at time k is given by (2.5) q i,k | k − 1 = 1 − Y j ∈ η i (1 − ω z (1) j,k − 1 ) , where z (1) k − 1 ∈ { 0 , 1 } is the indicator random v ariable of the j th v ariable b e- ing in state “infected” at previous time k − 1 and ω is the prior Bernoulli probabilit y of transmission b etw een j and i (also referred to as the attack rate). The conditional transition distribution in ( 2.3 ) is giv en b y the follow- ing m ultinomial distribution (2.6) P X i,k = x |{ X j,k − 1 = x j,k − 1 } j ∈{ η i ,i } = Y x ∈{ 0 , 1 , 2 } p i,k | k − 1 ( x ) z ( x ) i,k with indicator v ariable z ( x ) i,k = I { x i,k = x } and lab el probability p i,k | k − 1 ( x ) given b y p i,k | k − 1 ( x ) = γ z (2) i,k − 1 + z (0) i,k − 1 Q j ∈ η i 1 − ω z (1) j,k − 1 , x = 0 z (0) i,k − 1 1 − Q j ∈ η i 1 − ω z (1) j,k − 1 + (1 − α ) z (1) i,k − 1 , x = 1 αz (1) i,k − 1 + (1 − γ ) z (2) i,k − 1 , x = 2 , where the mo del parameters are defined in ( 2.1 ). While the prop osed graph- ical model selection method in this pap er is motiv ated using the canonical three state S I R mo del, the metho d can b e extended to any discrete state, discrete time sto chastic mo del with state interactions of the form of the probabilit y of transmission giv en in ( 2.5 ). 3. Spatio-T emp oral T opology Estimation. Here we develop an es- timate of the top ology E ( 2.2 ) given training sequences D of observ ed states (3.1) D = { x i,k } p,T i =1 ,k =1 , SP A TIO-TEMPORAL GRAPHICAL MODEL SELECTION 5 where T is the horizon of the measurement p erio d. It will be con venien t to rewrite the term in volving the probability of trans- mission in ( 2.5 ) as Y j ∈ η ( i ) 1 − ω z (1) j,k − 1 = exp log Y j ∈ η i 1 − ω z (1) j,k − 1 = exp X j ∈ η i log 1 − ω z (1) j,k − 1 = exp X j ∈ η i log (1 − ω ) z (1) j,k − 1 , (3.2) where w e ha v e exploited the fact that log(1 − ω z (1) j,k − 1 ) = log(1 − ω ) z (1) j,k − 1 ≤ 0 in ( 3.2 ). Define θ i,j θ i,j = log(1 − ω ) , E i,j = 1 0 , E i,j = 0 and re-writing the sum term in ( 3.2 ) to run o ver the other p − 1 nodes w e arriv e at the follo wing (3.3) 1 − q i,k | k − 1 = exp X j 6 = i θ i,j z (1) j,k − 1 , θ i,j ∈ { log(1 − ω ) , 0 } ∀ j 6 = i. Inserting ( 3.3 ) in to the state lab el probabilities, we hav e p i,k | k − 1 ( x ) = γ z (2) i,k − 1 + z (0) i,k − 1 e P j 6 = i θ i,j z (1) j,k − 1 , x = 0 z (0) i,k − 1 1 − e P j 6 = i θ i,j z (1) j,k − 1 + (1 − α ) z (1) i,k − 1 , x = 1 αz (1) i,k − 1 + (1 − γ ) z (2) i,k − 1 , x = 2 . Define the p − 1 dimensional column v ector θ i b y θ i = { θ i,j } j 6 = i . Given the spatial and temporal conditional indep endence assumptions represented in ( 2.3 ), the join t lik eliho o d can b e written as the multinomial distribution (3.4) L ( φ ; D ) = T Y k =2 p Y i =1 Y x ∈{ 0 , 1 , 2 } p i,k | k − 1 ( x ) z ( x ) i,k 6 HARRINGTON AND HER O with φ = { θ, α , γ , ω } and θ = { θ i } p i =1 . The join t log-lik eliho o d can b e written as (3.5) ` ( φ ; D ) = p X i =1 ` ( φ i ; D ) , with φ i = { θ i , α, γ , ω } . The ob jectiv e is to estimate the top ology parameter θ while the α , γ , and ω are nuisance parameters. The i th log-lik eliho o d function is ` ( θ i ; D ) = T X k =2 n z (0) i,k log p i,k | k − 1 (0) + z (1) i,k log( p i,k | k − 1 (1)) o = T X k =2 z (0 , 0) i,k | k − 1 X j 6 = i θ i,j z (1) j,k − 1 + z (1 , 0) i,k | k − 1 log 1 − e P j 6 = i θ i,j z (1) j,k − 1 , (3.6) with z (0 , 0) i,k | k − 1 = z (0) i,k z (0) i,k − 1 and z (1 , 0) i,k | k − 1 = z (1) i,k z (0) i,k − 1 . Note that ( 3.6 ) only in- cludes the state transition probabilities that in volv e θ i,j since θ i,j is obtained b y optimizing ov er ` ( θ i ; D ). In particular, the transition from any state to reco v ered do es not dep end on θ i,j . Note that the only parameter appear- ing in ( 3.6 ) necessary for estimation of θ is the transmission attac k rate ω , app earing implicitly through the definition of θ i,j , θ i,j ∈ { log(1 − ω ) , 0 } . Maximization of the lik eliho o d ov er all possible θ ∈ { log(1 − ω ) , 0 } p ( p − 1) is intractable ev en for small net w orks. The k ey to our maxim um likelihoo d estimation approach is to relax θ i,j to a contin uous v alued v ariable lying b et w een its discrete v alues log(1 − ω ) and 0, i.e., log(1 − ω ) ≤ θ i,j ≤ 0. W e use an ` 1 -p enalt y on the likelihoo d to enforce sparsity , i.e., only a few θ i,j are non-zero. Suc h ` 1 -p enalization is common in high dimensional statistical problems ( 28 ; 31 ; 14 ; 18 ; 10 ; 33 ; 26 ). This yields the following con v ex program min θ − ` ( θ ; D ) + λ k θ k ` 1 s.t. log(1 − ω ) θ 0 (3.7) with λ > 0 and denotes element wise inequality b etw een v ectors. The estimated neigh b orho o d set of no de i is then (3.8) ˆ η i ( λ ) = { j : ˆ θ i,j ( λ ) < 0 } . The set of all suc h neighborho o ds will sp ecify a (directed) graph that can b e used to estimate the netw ork top ology E in ( 2.2 ). Specifically , the estimate of the l th m th en try of E by ˆ E l,m ( λ ) = I { ˆ θ l,m ( λ ) < 0 } . The global estimate of the top ology is then defined as ˆ E ( λ ) = { ˆ E l,m ( λ ) } l,m . SP A TIO-TEMPORAL GRAPHICAL MODEL SELECTION 7 3.1. Inc orp or ating Prior Know le dge. There generally exists prior top o- logical constrain ts that couple the optimization ov er { θ i } p i =1 for differen t i in ( 3.5 ). One suc h top ological constrain t is symmetry in the interactions, i.e., θ i,j = θ j,i , corresp onding to an undirected graph E . One wa y to incorp orate this symmetry is to u se augmen ted lagrangian metho ds that impose symme- try in the form of a v ariational p enalty , e.g., P i,j ( θ i,j − θ j,i ) 2 ( 23 ). Another metho d is to relax the symmetry constraint during the optimization follow ed b y a veraging the θ i,j and θ i,j together after optimization is completed. If symmetry in θ i,j is not imp osed, the join t log-likelihoo d naturally fac- torizes as in ( 3.5 ), and can b e decoupled by applying a co ordinate descen t- lik e lik eliho o d function maximization that cycles through differen t no des, up dating its neighborho o ds and holding the other θ i ’s fixed: min θ i − ` ( θ i ; D ) + λ X j 6 = i | θ i,j | sub ject to log(1 − ω ) ≤ θ i,j ≤ 0 , ∀ j 6 = i. (3.9) Researc hers may hav e additional prior knowledge suc h as known in terac- tions, known non-interactions, or minim um or maxim um size of neighbor- ho o ds. Some common forms of prior knowledge, and their corresp onding constrain ts are summarized in T able 1 . T able 1 Common prior know le dge for c omplex networks app e aring as c onstr aints for the S I R gr aphic al mo del sele ction pr oblem Prior Kno wledge F orm of Constraint Symmetry θ i,j = θ j,i Kno wn Interactions θ i,j = log(1 − ω ) , j ∈ η i Kno wn Non-Interactions θ i,j = 0 , j / ∈ η i Min P ossible Size of Neigh b orho o d P j 6 = i θ i,j ≥ a i · log(1 − ω ) Max P ossible Size of Neigh b orho o d P j 6 = i θ i,j ≤ b i · log(1 − ω ) 8 HARRINGTON AND HER O It is more natural to w ork with the dual of the ob jective function in ( 3.7 ). In the dual one can immediately identify whic h of the inequality constrain ts are activ e. F or instance, if one has prior knowledge regarding the maxim um size of a particular neigh b orho o d, e.g., P j 6 = i θ i,j ≤ b · log(1 − ω ), one can determine if b · log(1 − ω ) < s , in which case, the constraint of k θ k ` 1 ≤ s w ould b e inactiv e for the subv ector θ i . This results in conv exity preserving top ological constrain ts min θ − ` ( θ ; D ) (3.10) sub ject to k θ k ` 1 ≤ s log(1 − ω ) θ 0 { h j ( θ ) ≤ ν j } k j =1 { g l ( θ ) = 0 } r l =1 . 3.2. Numeric al Solution. The prop osed ` 1 -p enalized likelihoo d problem in ( 3.9 ) is a con v ex program where there exists a v ariet y of p ow erful solv ers capable of pro ducing a solution ( 2 ). The prop osed numerical solution in this pap er is most appropriate for netw orks on the order of hundreds to a few thousand no des. F or net works on the order of tens of thousands of no des, a large scale metho d suc h as the one given in ( 14 ) might b e more appropriate. W e will relax the symmetry c onstrain ts when optimizing ov er θ and later imp ose them as a p ost-estimation heuristic (3.11) ˆ η i ( λ ∗ ) ← ˆ η i ( λ ∗ ) ∪ j, if i ∈ ˆ η j ( λ ∗ ) ∩ j / ∈ ˆ η i ( λ ∗ ) ∀ i, j. W e use a coordinate-wise gradien t descen t based method for solving ( 3.9 ) by quadratically expanding the negativ e log-lik eliho o d, resulting in iterativ ely solving a sequence of quadratic programs that incorp orates an additional line searc h. The Newton-step up date is accomplished by solving δ θ ( m ) i = arg min θ i 1 2 θ T i H ( m ) i θ i + θ T i g ( m ) i + λ X j 6 = i | θ i,j | s.t. log(1 − ω ) ≤ θ i,j ≤ 0 , ∀ j 6 = i, (3.12) with gradien t (3.13) g ( m ) i = −∇ ` ( θ i ; D ) | θ i = ˆ θ ( m ) i , and Hessian (3.14) H ( m ) i = −∇ 2 ` ( θ i ; D ) | θ i = ˆ θ ( m ) i . SP A TIO-TEMPORAL GRAPHICAL MODEL SELECTION 9 The up dated parameter ˆ θ ( m +1) i giv en b y (3.15) ˆ θ ( m +1) i = ˆ θ ( m ) i + ( m ) i δ θ ( m ) i , with step size ( m ) i determined by p erforming a bac ktrac king line searc h ( 2 ) (3.16) while − ` ( ˆ θ ( m ) i + ( m ) i δ θ ( m ) i ; D ) > − ` ( ˆ θ ( m ) i ; D )+0 . 2 ( m ) i ( g ( m ) i ) T δ θ ( m ) i , ( m ) i ← 0 . 3 ( m ) i , with ( m ) i initially set to 1. While ( 3.12 ) is con v ex, the presence of the ` 1 - norm mak es the ob jectiv e function non-differen tiable. Ho wev er, the ob jective function can b e transformed into an equiv alent conv ex, differentiable ob jec- tiv e by replacing the ` 1 -norm with linear inequalit y constrain ts ( 2 ; 14 ). An alternativ e to solving the Newton up date ( 3.12 ) with the ( p − 1)x( p − 1) Hes- sian is replace it with a quasi Newton up date which construct a surrogate ob jectiv e function ( 29 ; 17 ; 15 ) and replaces the Hessian, H ( m ) i with α ( m ) i I , where I is the iden tit y and α ( m ) i is c hosen suc h that (3.17) α ( m ) i I H ( m ) i , and ( 3.17 ) means that α ( m ) i I − H ( m ) i 0 is p ositive semi-definite. A conse- quence of the prop osed p enalized lik eliho o d formulation for the S I R mo del is that H ( m ) i , in addition to b eing symmetric and p ositive semi-definite, has p ositiv e entries, i.e., ( H ( m ) i ) s,r ≥ 0. Such non-negative conditions on the en tries in H ( m ) i can b e enforced by using the Perron-F rob enius b ound ( 12 ) (3.18) max s λ s H ( m ) i ≤ max s X r H ( m ) i s,r , where the optimization is applied to the upp er b ound (3.19) α ( m ) i = max s X r H ( m ) i s,r , th us guaran teeing ( 3.17 ). By replacing the Hessian with a diagonal surrogate is that the p − 1- dimensional quadratic program in ( 3.12 ) factorizes in to p − 1 individual pro- grams which ha ve an analytical update and can b e ev aluated sim ultaneously . The up date for θ i,j under suc h a surrogate Hessian b ecomes δ θ ( m ) i,j = arg min θ i,j 1 2 α ( m ) i θ 2 i,j + g ( m ) i,j θ i,j + λ | θ i,j | , log(1 − ω ) ≤ θ i,j ≤ 0 = − 1 α ( m ) i | g ( m ) i,j | − λ + : g ( m ) i,j < λ − α ( m ) i · log(1 − ω ) log(1 − ω ) : g ( m ) i,j ≥ λ − α ( m ) i · log(1 − ω ) (3.20) 10 HARRINGTON AND HER O with ( u ) + = max(0 , u ). The prop osed gradient descen t metho d for the ` 1 - p enalized likelihoo d problem for the spatio-graphical mo del selection prob- lem is summarized in Algorithm 1 (b elow). Algorithm 1 1. Let ˆ θ (0) i ∈ [log(1 − ω ) , 0] p − 1 b e an initial parameter v ector for the i th neigh b orho o d. 2. Up date δ θ ( m ) i b y solving ( 3.12 ) or solving ( 3.20 ) ∀ j 6 = i with surrogate diagonal Hessian giv en b y ( 3.19 ) 3. ( m ) i ← backtrac king line search from ( 3.16 ) 4. ˆ θ ( m +1) i = ˆ θ ( m ) i + ( m ) i δ θ ( m ) i 5. If conv ergence criteria met, stop and rep eat step 1 with next no de index, i ← i + 1. If con v ergence criteria not met, up date gradient and Hessian (and p otentially the surrogate diagonal Hessian) and rep eat step 2 through 5 Note: Algorithm 1 can b e parallelized across all p log-lik eliho o ds rather than the cyclical up date of i ← i + 1. Symmetry is imp osed through ( 3.11 ). A possible sp eed up w ould b e to perform activ e set updates to those coef- ficien ts which are non-zero by preferen tially up dating the co efficients corre- sp onding to no des that most likely b elong to the neigh b orho o d. Suc h activ e set up dates ha ve b een used successfully in e stimating sparse partial corre- lations ( 24 ). They ha ve also been prop osed to blo ck co-ordinate descen t in group lasso logistic regression ( 17 ). Implementing suc h accelerations is out of the scope of this pap er. 3.3. Sele ction of T uning Par ameters. Algorithm 1 requires sp ecification of the tuning parameter λ . T ypically , an estimate of the b est λ is desirable in order to p erform cross v alidation or other error assessment. In this pap er w e rep ort a BIC-like p enalty , similarly used in previous work on the estimation of partial correlation netw orks ( 24 ), for selecting the b est estimate of λ , denoted b y λ ∗ , b y cross v alidation. Sp ecifically , assuming the attack rate ω is kno wn, w e p erform the up date θ i,j as follo ws (3.21) ˆ θ i,j ( λ ) ← log(1 − ω ) , ∀ i, j ∈ { i, j : ˆ θ i,j ( λ ) < 0 } . The BIC penalty for the i th no de is (3.22) B I C i ( λ ) = − ` i ( ˆ θ i ( λ ); D ) + 1 2 log T i # { j : ˆ θ i,j ( λ ) < 0 } , where # { i, j : ˆ θ i,j ( λ ) < 0 } is the num b er of non-zero entries in the estimator. The term T i = # { k : z (0) i,k = 1 } represen ts the effective time horizon for the SP A TIO-TEMPORAL GRAPHICAL MODEL SELECTION 11 i th no de as the n umber of terms in the i th log-lik eliho o d, whic h dep ends on the n umber of of z (0) i,k equal to one (see ( 3.6 )). Given ( 3.22 ), there will b e m ultiple regularization parameters, one for each neighborho o d i : (3.23) λ ∗ i = arg min λ B I C i ( λ ) . The common approach is to imp ose that all the λ ∗ i ’s are the same and solve for a single tuning parameter (3.24) λ ∗ = arg min λ p X i =1 B I C i ( λ ) . The latter approac h has b een previously used in con trolling the sparseness of estimated partial correlation net works ( 24 ) and learning directed acyclic graphs (D A Gs) ( 27 ). 4. Numerical Results. Given the global resp onse to the recent out- break of pandemic influenza A (H1N1) 2009, the abilit y of public health organizations and w orld go v ernmen ts to develop effectiv e control and in ter- v en tion strategies dep ends on kno wledge of the top ology of so cial netw orks. W e illustrate the prop osed p enalized likelihoo d top ology estimate for the problem of identifying the structure of synthetic so cial net w orks giv en dis- ease spread that has attack rate parameters that sim ulate H1N1, sp ecifically ω = 0 . 273 as rep orted in ( 32 ). The other t w o parameters, not needed for net w ork inference but necessary for generating S I R tra jectories from ( 2 ), w ere taken as α = 0 . 250 reflecting a mean infectious p erio d of 4 days and γ = 0 . 100 pro ducing an av erage time of 10 days for transition from “recov- ered” to “susceptible”. W e simulated t wo 200 no de netw orks using tw o types of connection mo d- els: scale-free and small-w orld. These mo dels hav e b een proposed for man y practical complex net works ( 22 ). The t wo randomly generated netw orks used for exp erimen ts w ere created using the iGraph pac k age for R ( 6 ). The pow er la w netw ork was sampled such that the degree distribution reflected those whic h app ear in real complex net w orks. Sp ecifically , the exp onent param- eter of the degree distribution w as tak en as 2 . 2, consistent with evidence rep orted in ( 22 ). The rewiring probability of the small-world net w ork was tak en as 0 . 1 to elicit tight comm unities that w ere lo osely connected to other clusters. The S I R mo del ( 2 ) w as used to generate training, v alidation, and test data for each of the t w o simulated 200 node netw orks. The net works were initialized with 40 randomly selected no des w ere in “infected” state while 12 HARRINGTON AND HER O the rest were in “susceptible” state. The quadratic program app earing in Algorithm 1, ( 3.12 ), was solv ed using the CVX environmen t in MA TLAB and the solv er SDPT3 4.0 ( 11 ; 30 ) with cold start initializations of ˆ θ (0) i = 0. Symmetry was included in the estimated neigh b orho o ds follo wing the post estimation heuristic ( 3.11 ). W e presen t a comparison against a mo dified version of graphical model se- lection using ` 1 -logistic regression ( ` 1 -LR) ( 31 ). Since the metho d describ ed in ( 31 ) is designed for binary random v ariables generated from an Ising mo del, to implemen t ` 1 -LR w e transform the three state S I R v ariables to binary random v ariables. The transformation is the following: for each no de i , the indicator even t of the i th no de transitioning from “susceptible” to “in- fected”, is regressed on all other p − 1 “infected” no des indicator v ariables at previous time k − 1 with a bias controlling constan t as explained in ( 31 ) and symmetry imp osed through ( 3.11 ). By transforming the multi-state S I R random v ariables to the binary random v ariables for the implementation of ` 1 -LR, we capture the causalit y of transmission from neighbors. While w e transform the three state S I R random v ariables to t w o state random v ariables for implemen ting ` 1 -LR, the prop osed graphical mo del selection in this pap er, referred to as ` 1 -SIR, uses the original three state v ariables in the log-lik eliho o d ( 3.6 ). As the estimated parameters using ` 1 -LR ( 31 ) can tak e on an y v alue on the real-line, w e define the estimated neigh b orho o d for the i th no de as those estimates with non-zero v alue. The ROC curves corresp onding to ` 1 -SIR and the mo dified ` 1 -LR for the scale-free net work and small-world net work for T = { 500 , 1000 } are displa y ed in Figure 1(a) and Figure 1(b) , resp ectively . Insp ection of Figure 1 v alidates that the prop osed ` 1 -SIR graphical mo del selection outp erforms ` 1 -LR when confron ted with data drawn from the S I R distribution. At a false alarm rate of 5%, w e see that the proposed ` 1 -SIR metho d ac hieves a 5% − 10% gain in p ow er ov er the mo dified ` 1 -LR metho d for b oth net works. As ` 1 -LR ( 31 ) uses one ` 1 p enalt y , for baseline comparison b etw een these t wo graphical mo del selection algorithms, only a single regularization p enalty w as used in the R OC curves generated from ` 1 -SIR. Both structure learning metho ds p erform p o orer in the case of the small-w orld net w ork than in the case of the scale-free netw ork. This is possibly due to the increased frequency of re-infection in the tight clusters of the small-w orld net work. W e next present the mo del selection p erformance on the 200 no de scale- free net w ork using the prop osed metho d with global and neighborho o d sp e- cific p enalties, optimized by minimizing the BIC penalties ( 3.24 ) and ( 3.23 ), resp ectiv ely , for time durations of T = { 100 , 400 , 700 , 1000 } . The images in Figures 2 and 3 reflect the estimated net w ork topologies, represen ted as SP A TIO-TEMPORAL GRAPHICAL MODEL SELECTION 13 ! !"!# !"$ !"$# !"% ! !"$ !"% !"& !"' !"# !"( !") !"* !"+ $ $ ! ,-./010/023 ,.4,0205023 6$ ! 789:;<=$!!!> 6$ ! 69:;<=$!!!> 6$ ! 789:;<=#!!> 6$ ! 69:;<=#!!> (a) Scale-F ree Netw ork ! !"!# !"$ !"$# !"% ! !"$ !"% !"& !"' !"# !"( !") !"* !"+ $ $ ! ,-./010/023 ,.4,0205023 6$ ! 789:;<=$!!!> 6$ ! 69:;<=$!!!> 6$ ! 789:;<=#!!> 6$ ! 69:;<=#!!> (b) Small-W orld Netw ork Fig 1 . ROC curves of ` 1 -SIR gr aphic al mo del sele ction ( blue ) vs. ` 1 -lo gistic r e gr ession ( r e d ) for numb er of time p oints T = { 500 , 1000 } symmetric adjacency matrices E , a v eraged ov er the 1000 resampled initial conditions corresp onding T = 100 and T = 1000, resp ectiv ely . Subfigures a.) through c.) corresp ond to ground truth, ` 1 -SIR with a single ` 1 -p enalt y , and ` 1 -SIR with neigh b orho o d specific ` 1 -p enalt y , resp ectively . The in tensity , lo cated at row i and column j , indicates the frequency of an edge discov ered b etw een no des i and j , white designates a strong edge and blac k designates no edge. Visual insp ection of these figures establish that the prop osed ` 1 -SIR graphical mo del selection metho ds accurately extract the global communit y structure of the scale-free net work when using a single or m ultiple p enalties to enforce sparseness. A quan titativ e comparison of accuracy of top ology estimation is given by the sensitivity , specificity and probabilit y of error. T able 2 summarizes the mean (with standard deviation sho wn in parentheses) when assessing the p erformance across the 1000 reconstructed top ologies corresp onding to the 1000 resampled simulations. W e see that the sensitivit y of this method, using a single λ ∗ and m ultiple { λ ∗ i } p i =1 , increases when the n umber of time samples increases while the sp ecificity remains robust to the n um b er of time samples and consistently ab o ve 0 . 96. Likewise, the global probabilit y of error is below 0 . 05 for both methods across all time horizons explored. It is worth noting that the prop osed metho d is only able to resolv e an interaction b etw een no des i and j if b oth no des states ha v e c hanged at some point throughout 14 HARRINGTON AND HER O a.) b.) c.) Fig 2 . % zer os in the r e c onstruction of e dges in 200 no de synthetic sc ale fr ee network under 100 time p oints r esample d over 1000 initial c onditions of 40 r andomly sele cte d no des as “infe cte d” with r est “susc eptible”. a.) ground truth, b.) single tuning p arameter, c.) multiple tuning p ar ameters (white - 0% black 100%) a.) b.) c.) Fig 3 . % zer os in the r e c onstruction of e dges in 200 no de synthetic sc ale fr ee network under 1000 time p oints r esample d over 1000 initial c onditions of 40 r andomly sele cte d no des as “infe cte d” with r est “susc eptible”. a.) gr ound truth, b.) single tuning p ar ameter, c.) multiple tuning p ar ameters (white - 0% black 100%) SP A TIO-TEMPORAL GRAPHICAL MODEL SELECTION 15 the monitoring interv al. Therefore for small time horizons, the epidemic ma y not ha ve enough time to propagate the entire graph thus inhibiting the abilit y to accurately detect interactions. A scale-free netw ork has a wide distribution of v ertex degrees (few hubs, man y lesser connected no des). Figure 4 a.), b.), and c.) show the sensitiv- it y , sp ecificit y , and probability of error, resp ectively , of correctly detecting the neighborho o d of eac h no de as a function of increasing vertex degree. In all three subfigures, w e see that regularizing with tuning parameters c har- acteristic to eac h neighborho o d { λ ∗ i } p i =1 selected according to ( 3.23 ) tends to pro duce similar sensitivit y and sp ecificity with low er probabilit y of error across all t yp es of no de degrees than when regularizing with a single penalty λ ∗ selected according to ( 3.24 ). T able 2 Dete ction statistics vs. time horizon for 200 node synthetic sc ale-fr e e network with tr aje ctories r esample d over 1000 initial c onditions of 40 r andomly sele cte d no des as “infe cte d” with r est “susc eptible” Metho d T S ens. ( λ ∗ ) S pec. ( λ ∗ ) P e ( λ ∗ ) ` 1 -SIR( λ ∗ ) 100 0.40(0.02) 0.96(0.00) 0.05(0.00) ` 1 -SIR( { λ ∗ i } p i =1 ) 100 0.34(0.02) 0.97(0.00) 0.05(0.00) ` 1 -SIR( λ ∗ ) 400 0.80(0.05) 0.97(0.00) 0.03(0.00) ` 1 -SIR( { λ ∗ i } p i =1 ) 400 0.78(0.05) 0.96(0.00) 0.04(0.00) ` 1 -SIR( λ ∗ ) 700 0.95(0.08) 0.96(0.00) 0.04(0.00) ` 1 -SIR( { λ ∗ i } p i =1 ) 700 0.95(0.07) 0.96(0.00) 0.04(0.00) ` 1 -SIR( λ ∗ ) 1000 0.97(0.08) 0.96(0.00) 0.03(0.00) ` 1 -SIR( { λ ∗ i } p i =1 ) 1000 0.97(0.08) 0.96(0.00) 0.03(0.00) The performance of the prop osed metho d w as also assessed for a 200 node small-w orld netw ork. Visual insp ection of Figure 6 sho ws that the prop osed metho d metho d accurately extracts the small-world communit y structure, represen ted b y the recov ery of the banded structure of the adjacency ma- trices. In addition to detecting the c haracteristic clusters of the small-world ground truth net work, the method also tends to iden tify the betw een-cluster in teractions whic h are depicted in the off-diagonal elemen ts. In terms of the 16 HARRINGTON AND HER O 0 5 10 0.5 0.6 0.7 0.8 0.9 1 node degree a.) sensitivity 0 5 10 0.5 0.6 0.7 0.8 0.9 1 node degree b.) specificity 0 5 10 0 0.05 0.1 0.15 node degree c.) probability of error single penalty multiple penalties single penalty multiple penalties single penalty multiple penalties Fig 4 . Neighb orho o d dete ction statistics vs. no de de gr ee for 200 no de sc ale-fr e e network with T = 1000 and 1000 r andom trials. Initial c ondition was 40 r andomly sele cte d nodes as “infe cte d” with r est “susc eptible”. a.) sensitivity, b.) sp e cificity, c.) pr ob ability of err or ( r e d Single Penalty, blue Multiple Penalties) detection statistics (T able 3 ), the sensitivit y of b oth metho ds impro v es with the num b er of time samples and the single tuning parameter metho d ( 3.24 ) results in higher p ow er across all time samples. The metho d of regularizing with tuning parameters unique to each neigh b orho o d ( 3.23 ) seems to p er- form similarly to the metho d when using a single p enalt y . The decomp osition of the global detection statistics on a per vertex degree basis for the small- w orld netw ork was also explored. Figure 7 a.), b.), and c.) represen t the sensitivit y , specificity , and probability of error, resp ectively , in reconstruct- ing the neighborho o ds of no des as a function of no de degree. The more highly connected no des tend to ha ve p o orer sensitivit y and higher probabil- it y of error. Figure 7 suggests that b oth metho ds tend to pro duce similar results in detection p erformance as a function of v ertex degree. Giv en this similarit y , one should opt for the reduced complexity of using single p enalt y with tuning paramete r selected by ( 3.24 ). 5. Conclusion. W e ha v e presen ted an estimator of the top ology of in- teractions in a spatio-temp oral graphical mo del. While the p enalized like- liho o d form ulation was derived for the general S I R mo del, more complex S I R processes, i.e. , S I 1 · · · , I m RS could b e handled b y our approac h. The detection p erformance resulting from sim ulations of a H1N1 epidemic model suggests that the proposed metho d accurately reconstructs the top ology of SP A TIO-TEMPORAL GRAPHICAL MODEL SELECTION 17 a.) b.) c.) Fig 5 . % zer os in the r e c onstruction of e dges 200 no de synthetic smal l world network under 100 time p oints r esample d over 1000 initial c onditions of 40 r andomly sele cte d no des as “infe cte d” with r est “susc eptible”. a.) ground truth, b.) single tuning p arameter, c.) multiple tuning p ar ameters (white - 0% black 100%) a.) b.) c.) Fig 6 . % zer os in the r e c onstruction of e dges 200 no de synthetic smal l world network under 1000 time p oints r esample d over 1000 initial c onditions of 40 r andomly sele cte d no des as “infe cte d” with r est “susc eptible”. a.) gr ound truth, b.) single tuning p ar ameter, c.) multiple tuning p ar ameters (white - 0% black 100%) 18 HARRINGTON AND HER O T able 3 Dete ction statistics vs. time horizon for 200 node synthetic smal l-world network with tr aje ctories r esample d over 1000 initial c onditions of 40 r andomly sele cte d no des as “infe cte d” with r est “susc eptible” Metho d T S ens. ( λ ∗ ) S pec. ( λ ∗ ) P e ( λ ∗ ) ` 1 -SIR( λ ∗ ) 100 0.26(0.05) 0.94(0.01) 0.08(0.01) ` 1 -SIR( { λ ∗ i } p i =1 ) 100 0.28(0.04) 0.92(0.01) 0.10(0.01) ` 1 -SIR( λ ∗ ) 400 0.41(0.02) 0.95(0.00) 0.07(0.00) ` 1 -SIR( { λ ∗ i } p i =1 ) 400 0.46(0.02) 0.93(0.00) 0.08(0.00) ` 1 -SIR( λ ∗ ) 700 0.77(0.02) 0.90(0.01) 0.11(0.01) ` 1 -SIR( { λ ∗ i } p i =1 ) 700 0.77(0.02) 0.90(0.00) 0.11(0.00) ` 1 -SIR( λ ∗ ) 1000 0.87(0.01) 0.90(0.00) 0.07(0.01) ` 1 -SIR( { λ ∗ i } p i =1 ) 1000 0.87(0.02) 0.90(0.00) 0.07(0.00) 4 6 8 0.5 0.6 0.7 0.8 0.9 1 node degree a.) sensitivity 4 6 8 0.5 0.6 0.7 0.8 0.9 1 node degree b.) specificity 4 6 8 0 0.05 0.1 0.15 0.2 node degree c.) probability of error single penalty multiple penalties single penalty multiple penalties single penalty multiple penalties Fig 7 . Neighb orho o d dete ction statistics vs. no de de gr e e for 200 node smal l-world network with T = 1000 with tr aje ctories r esample d over 1000 initial c onditions of 40 r andomly sele cte d no des as “infecte d” with r est “susc eptible”. a.) sensitivity, b.) sp e cificity, c.) pr ob- ability of err or ( r e d Single Penalty, blue Multiple Penalties) these t yp es of netw orks while outp erforming other state of the art structure learning algorithms. SP A TIO-TEMPORAL GRAPHICAL MODEL SELECTION 19 Ac kno wledgemen ts. The authors gratefully appreciate the insightful commen ts and discussions with Ami Wiesel, Kerby Shedden, and Ji Zh u. References. [1] L. Alkema, A. E. Rafter y, and S. J. Clark , Pr obabilistic pr oje ctions of hiv pr evalenc e using b ayesian melding , ANNALS OF APPLIED ST A TISTICS, 1 (2007), p. 229. [2] S. Bo yd and L. V andenberghe , Convex Optimization , Cam bridge Universit y Press, 2004. [3] D. Chakrabar ti, Y. W ang, C. W ang, J. Lesko vec, and C. F aloutsos , Epi- demic thr esholds in r e al networks , ACM T rans. Inf. Syst. Secur., 10 (2008), pp. 1094– 9224. [4] R. Cohen, S. Ha vlin, and D. ben A vraham , Efficient immunization str ate gies for c omputer networks and p opulations , Ph ysical Review Letters, 91 (2003), p. 247901. [5] G. F. Cooper and E. Herskovits , A Bayesian metho d for the induction of pr ob a- bilistic networks fr om data , Mach. Learn., 9 (1992), pp. 309–347. [6] G. Csard i and T. Nepusz , The igraph softwar e p ackage for c omplex network r e- se ar ch , InterJournal, Complex Systems (2006), p. 1695. [7] M. Draief, A. J. Ganesh, and L. Massouli ´ e , Thr esholds for virus spr e ad on networks , Ann. Appl. Probab., 18 (2008), pp. 359–378. [8] D. Ea ton and K. Murphy , Bayesian structur e learning using dynamic pr o gramming and mcmc , in UAI, 2007. [9] S. Eubank, H. Guclu, Anil, M. V. Mara the, A. Sriniv asan, Z. Toroczkai, and N. W ang , Mo del ling disease outbr eaks in r e alistic urb an so cial networks , Nature, 429 (2004), pp. 180–184. [10] J. Friedman, T. Hastie, and R. Tibshirani , Sp arse inverse c ovarianc e estimation with the gr aphic al lasso , Biostat, (2007). [11] M. Grant, S. Boyd, and Y. Ye , CVX: Matlab Softwar e for Discipline d Convex Pr o gr amming . http://www.stanford.edu/~boyd/cvx/ , V ersion 1.2, August 2008. [12] R. A. Horn and C. R. Johnson , Matrix Analysis , Cambridge Univ ersity Press, 1990. [13] M. Keeling and K. Eames , Networks and epidemic mo dels , Journal of the Ro yal So ciet y Interface, 2 (2005), pp. 295–307. [14] K. Koh, S.-J. Kim, and S. Boyd , An interior-p oint metho d for lar ge-scale l1- r e gularize d lo gistic r e gr ession , J. Mach. Learn. Res., 8 (2007), pp. 1519–1555. [15] K. Lange, D. R. Hunter, and I. Y ang , Optimization transfer using surr o gate obje ctive functions , Journal of Computational and Graphical Statistics, 9 (2000). [16] S.-I. Lee, V. Ganap a thi, and D. K oller , Efficient structur e le arning of Markov networks using L1-r e gularization , in Adv ances in Neural Information Pro cessing Sys- tems (NIPS 2006), 2007. [17] L. Meier, S. v an de Geer, and P. B ¨ uhlmann , The gr oup lasso for lo gistic r e gres- sion , Journal Of The Roy al Statistical Society Series B, 70 (2008), pp. 53–71. [18] N. Meinsha usen and P. B ¨ uhlmann , High dimensional gr aphs and variable sele ction with the lasso , Annals of Statistics, 34 (2006), pp. 1436–1462. [19] L. A. Meyers , Contact network epidemiology: Bond p erc olation applie d to infe ctious dise ase pr e diction and c ontr ol , Bull. Amer. Math. Soc., 44 (2007), pp. 63–86. [20] K. P. Murphy , Dynamic b ayesian networks: r epr esentation, infer enc e and le arning , PhD thesis, Univ ersit y of California, Berkeley , 2002. 20 HARRINGTON AND HER O [21] M. E. J. Newman , The spr e ad of epidemic dise ase on networks , Ph ysical Review E, 66 (2002), p. 016128. [22] M. E. J. Newman , The structur e and function of c omplex networks , SIAM Review, 45 (2003), pp. 167–256. [23] J. Nocedal and S. J. Wright , Numeric al Optimization , Springer, 2000. [24] J. Peng, P. W ang, N. Zhou, and J. Zhu , Partial corr elation estimation by joint sp arse r e gr ession mo dels , Journal of the American Statistical Association, 104 (2009), pp. 735–746. [25] A. Rafter y and L. Ba o , Estimating and pr oje cting tr ends in HIV/AIDS gener alize d epidemics using incr emental mixtur e imp ortanc e sampling , Biometrics, (2010). [26] P. Ra vikumar, G. Raskutti, M. W ainwright, and B. Yu , Mo del sele ction in gaussian graphic al mo dels: High-dimensional c onsistency of l1-r e gularize d mle. , in NIPS, D. Koller, D. Sch uurmans, Y. Bengio, and L. Bottou, eds., MIT Press, 2008, pp. 1329–1336. [27] M. Schmidt and K. Murphy , L assoOr derSe ar ch: L earning Dir e cte d Gr aphic al Mo del Structur e using L1-Penalize d R e gres sion and Or der Se ar ch , Learning, 8, p. 2. [28] R. Tibshirani , R e gr ession shrinkage and sele ction via the lasso , Journal of the Roy al Statistical So ciety Series B-Metho dological, 58 (1996), pp. 267–288. [29] P. Tseng and S. Yun , A c o ordinate gr adient desc ent method for nonsmo oth sep ar able minimization , Math. Program., 117 (2008), pp. 387–423. [30] R. H. T ¨ ut ¨ unc ¨ u, K. C. Toh, and M. J. Todd , Sdpt3 version 4.0 (b eta) - a matlab softwar e for semidefinite-quadratic-line ar pr o gr amming . http://www.math.nus.edu.sg/mattohkc/sdpt3.html/ , July 2006. [31] M. J. W ainwright, P. Ra vikumar, and J. D. Laffer ty , High-dimensional gr aph- ic al mo del sele ction using l1-r e gularize d lo gistic r e gr ession , in NIPS, MIT Press, 2006, pp. 1465–1472. [32] Y. Y ang, J. D. Sugimoto, M. E. Halloran, N. E. Bast a, D. L. Chao, L. Ma- trajt, G. Potter, E. Kenah, and I. M. Longini , The tr ansmissibility and c ontr ol of p andemic influenza a (H1N1) virus , Science, 326 (2009), pp. 729–733. [33] M. Yuan and Y. Lin , Model selection and estimation in the gaussian gr aphic al mo del , Biometrik a, 94 (2007), pp. 19–35. P a trick L. Har rington Jr. Bioinforma tics Gradua te Program Dep ar tment of St a tistics University of Michigan 2017 P almer Commons Bldg. 100 W ashtena w A ve. Ann Arbor, MI, 48109-2218 Tel. (734) 615-8895 F AX: (734) 615-6553 WWW: http : //w ww .umich.edu/ ∼ plhj r E-mail: plhjr@umich.edu Alfred O. Hero I I I. Dep ar tment of EECS Dep ar tment of St a tistics Dep ar tment of Biomedical Engineering University of Michigan 1301 Beal A venue Ann Arbor,MI 48109-2122 Tel. (734) 763-0564 F AX: (734) 763-8041 WWW: http : //w ww .eecs.umich.edu/ ∼ her o E-mail: hero@umich.edu
Original Paper
Loading high-quality paper...
Comments & Academic Discussion
Loading comments...
Leave a Comment