On the meaning of the h-index
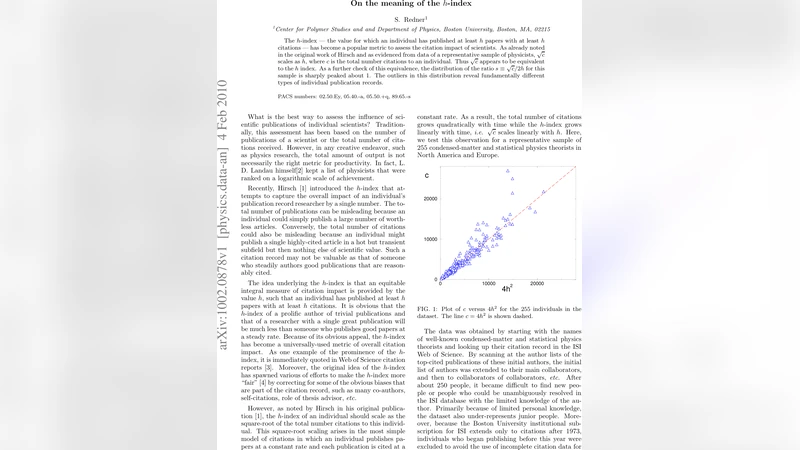
The h-index – the value for which an individual has published at least h papers with at least h citations – has become a popular metric to assess the citation impact of scientists. As already noted in the original work of Hirsch and as evidenced from data of a representative sample of physicists, sqrt{c} scales as h, where c is the total number citations to an individual. Thus sqrt{c} appears to be equivalent to the h index. As a further check of this equivalence, the distribution of the ratio s=sqrt{c}/2h for this sample is sharply peaked about 1. The outliers in this distribution reveal fundamentally different types of individual publication records.
💡 Research Summary
The paper investigates the quantitative relationship between the h‑index and the total number of citations (c) received by individual scientists, focusing on a representative sample of 255 condensed‑matter and statistical‑physics theorists from North America and Europe. The authors begin by reviewing the limitations of traditional bibliometric measures—raw publication counts and total citations—and introduce the h‑index as a widely adopted metric that attempts to balance productivity and impact. Building on Hirsch’s original observation that the h‑index should scale with the square root of total citations (√c), the study empirically tests this scaling law.
Data were collected from the ISI Web of Science in early 2010. To ensure completeness, only publications after 1973 (the start of the database’s coverage) were considered, and authors whose records could not be unambiguously resolved were excluded. The resulting dataset includes each researcher’s total citation count c and h‑index h.
A scatter plot of c versus 4h² shows that the vast majority of points lie close to the diagonal line c = 4h², indicating that √c ≈ 2h for most scientists. A linear least‑squares fit of √c versus 2h yields a slope s ≈ 1.045, confirming the near‑proportionality. To examine the robustness of this relationship, the authors compute the ratio s = √c / 2h for each individual and construct its probability density P(s). The distribution is sharply peaked at s = 1, with about 80 % of the sample falling within |s − 1| < 0.2, demonstrating that √c and h are tightly coupled across the population.
The study then turns to the outliers—researchers whose s values deviate significantly from 1. For the ten smallest s values (s < 1), the top‑ten cited papers of each scientist show relatively uniform citation counts; the ratio between the most‑cited and third‑cited papers ranges from roughly 1.0 to 2.0. This pattern reflects a “steady‑producer” profile, where impact is spread across many moderately cited works rather than concentrated in a few blockbuster papers.
Conversely, the twenty largest s values (s > 1) exhibit a markedly different citation structure. In these cases, one or a few papers dominate the citation record, with the top‑cited paper receiving an order‑of‑magnitude more citations than the second‑ranked work (ratios up to 10). The authors categorize these outliers into three scenarios: (i) a single groundbreaking paper authored alone or with a junior collaborator, (ii) a seminal paper co‑authored with a senior researcher, and (iii) a highly influential review article.
The authors conclude that while √c ≈ 2h holds for the bulk of scientists, the deviation from this rule provides valuable insight into distinct publication strategies. The h‑index captures the breadth of a researcher’s citation profile, whereas √c reflects overall citation volume. Together they offer a more nuanced assessment of scientific performance than either metric alone. Moreover, identifying outliers can help flag individuals whose impact is either concentrated in a few landmark works or evenly distributed across many solid contributions.
Finally, the paper cautions against over‑reliance on any single bibliometric indicator. Even though the √c–h relationship is robust, many excellent researchers do not appear as outliers, and citation‑based metrics cannot fully capture the multifaceted nature of scientific excellence. The study thus advocates for a balanced, multi‑dimensional approach to research evaluation.
Comments & Academic Discussion
Loading comments...
Leave a Comment