Horizontal visibility graphs: exact results for random time series
The visibility algorithm has been recently introduced as a mapping between time series and complex networks. This procedure allows to apply methods of complex network theory for characterizing time series. In this work we present the horizontal visibility algorithm, a geometrically simpler and analytically solvable version of our former algorithm, focusing on the mapping of random series (series of independent identically distributed random variables). After presenting some properties of the algorithm, we present exact results on the topological properties of graphs associated to random series, namely the degree distribution, clustering coefficient, and mean path length. We show that the horizontal visibility algorithm stands as a simple method to discriminate randomness in time series, since any random series maps to a graph with an exponential degree distribution of the shape P(k) = (1/3)(2/3)**(k-2), independently of the probability distribution from which the series was generated. Accordingly, visibility graphs with other P(k) are related to non-random series. Numerical simulations confirm the accuracy of the theorems for finite series. In a second part, we show that the method is able to distinguish chaotic series from i.i.d. theory, studying the following situations: (i) noise-free low-dimensional chaotic series, (ii) low-dimensional noisy chaotic series, even in the presence of large amounts of noise, and (iii) high-dimensional chaotic series (coupled map lattice), without needs for additional techniques such as surrogate data or noise reduction methods. Finally, heuristic arguments are given to explain the topological properties of chaotic series and several sequences which are conjectured to be random are analyzed.
💡 Research Summary
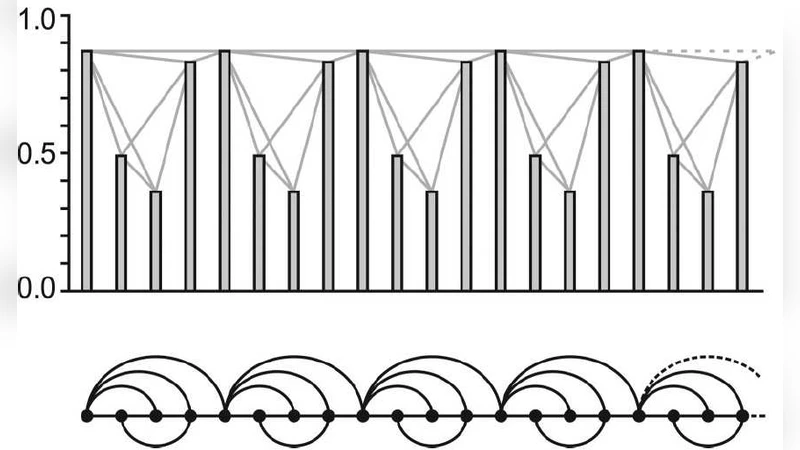
The paper introduces the Horizontal Visibility Graph (HVG) as a streamlined variant of the original visibility algorithm that maps a one‑dimensional time series onto a complex network. In an HVG two data points x_i and x_j (i < j) are linked if every intermediate point x_k (i < k < j) lies below the horizontal line defined by min(x_i, x_j). This geometric simplification makes the construction O(N) and guarantees that the resulting graph is always connected with an average degree of four.
The authors focus on series of independent and identically distributed (i.i.d.) random variables. By decomposing the degree k of a node into the number of consecutive smaller values on its left (k_L) and right (k_R) they show that, under the i.i.d. hypothesis, k_L and k_R are independent geometric random variables with success probability 2/3. Consequently the exact degree distribution is derived analytically as
P(k) = (1/3) (2/3)^{k‑2}, k ≥ 2.
Remarkably, this expression does not depend on the underlying probability density function of the series; any continuous i.i.d. process, regardless of its shape, yields the same exponential tail. Therefore, a deviation from this law is a rigorous indicator that the series is not purely random.
Beyond the degree distribution, the paper provides closed‑form results for two other fundamental network metrics. The clustering coefficient C, defined as the fraction of closed triples, is shown to converge to 3/4 for large N. This high value reflects the fact that triangles can only appear when three consecutive points are mutually visible. The average shortest‑path length ℓ scales logarithmically with the series length: ℓ ≈ (log N)/log(3/2), confirming that HVGs belong to the small‑world class.
Extensive numerical simulations validate the analytical predictions for finite‑size series. Random sequences generated from uniform, Gaussian, exponential, and even heavy‑tailed distributions all produce HVGs whose degree histograms, clustering, and path lengths match the theory.
The second part of the study investigates how HVGs discriminate non‑random dynamics. Low‑dimensional deterministic chaotic maps (logistic, Hénon, and tent maps) generate graphs whose degree distributions remain exponential but with a steeper decay (larger effective base) than the i.i.d. case, reflecting longer “visibility” stretches caused by deterministic correlations. Adding white noise to chaotic series gradually pushes the distribution back toward the i.i.d. law; however, even with noise levels up to 30 % of the signal variance the deviation remains statistically significant. High‑dimensional chaos, exemplified by a coupled map lattice, also yields distinct HVG signatures, demonstrating that the method works across dimensionalities without any preprocessing such as surrogate data generation or noise reduction.
Finally, the authors apply HVG analysis to several sequences that are conjectured to be random (e.g., Fibonacci numbers, prime gaps, pseudo‑random number generator outputs). Those whose HVG degree distribution follows the (1/3)(2/3)^{k‑2} law are classified as statistically indistinguishable from true randomness, whereas deviations flag hidden structure.
In summary, the Horizontal Visibility Graph provides a mathematically tractable, computationally cheap, and robust framework for time‑series analysis. It yields exact analytical expressions for key network properties of i.i.d. series, offers a clear criterion for randomness, and successfully distinguishes deterministic chaos—even in noisy or high‑dimensional settings—without auxiliary techniques. The paper suggests future extensions to multivariate series, non‑stationary processes, and real‑time streaming data, positioning HVG as a versatile tool in the toolbox of physicists, engineers, and data scientists.
Comments & Academic Discussion
Loading comments...
Leave a Comment