Measures of Analysis of Time Series (MATS): A MATLAB Toolkit for Computation of Multiple Measures on Time Series Data Bases
In many applications, such as physiology and finance, large time series data bases are to be analyzed requiring the computation of linear, nonlinear and other measures. Such measures have been developed and implemented in commercial and freeware softwares rather selectively and independently. The Measures of Analysis of Time Series ({\tt MATS}) {\tt MATLAB} toolkit is designed to handle an arbitrary large set of scalar time series and compute a large variety of measures on them, allowing for the specification of varying measure parameters as well. The variety of options with added facilities for visualization of the results support different settings of time series analysis, such as the detection of dynamics changes in long data records, resampling (surrogate or bootstrap) tests for independence and linearity with various test statistics, and discrimination power of different measures and for different combinations of their parameters. The basic features of {\tt MATS} are presented and the implemented measures are briefly described. The usefulness of {\tt MATS} is illustrated on some empirical examples along with screenshots.
💡 Research Summary
The paper introduces MATS (Measures of Analysis of Time Series), a comprehensive MATLAB‑based toolkit designed to compute a wide array of linear, nonlinear, and statistical measures on large collections of scalar time‑series data. The authors motivate the work by pointing out that, in fields such as physiology, finance, and climate science, analysts frequently need to process thousands of recordings, yet existing commercial and open‑source packages provide only fragmented functionality—each focusing on a single class of measures, offering limited parameter control, and lacking integrated visualization or hypothesis‑testing capabilities.
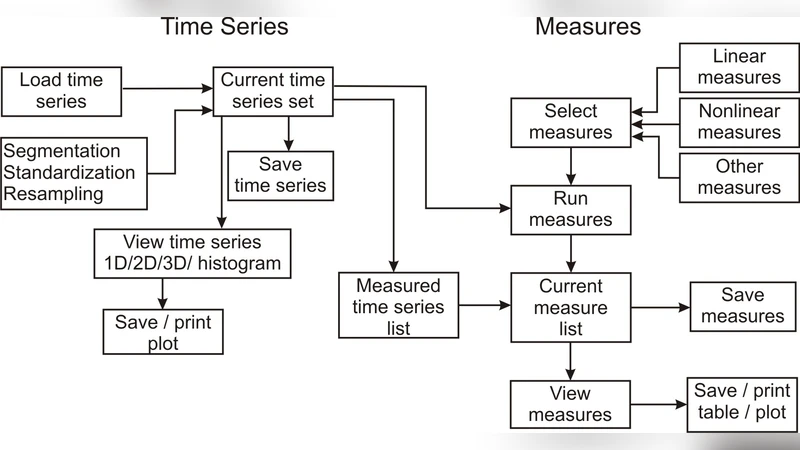
MATS addresses these gaps through a modular four‑layer architecture. The first layer, a database‑management module, imports time‑series from common file formats (.mat, .csv, .txt) using memory‑mapping and batch‑loading techniques, thereby supporting databases with hundreds of thousands of series without exhausting RAM. The second layer, the measurement engine, implements roughly thirty built‑in metrics, ranging from basic statistics (mean, variance, autocorrelation, power spectrum) to sophisticated nonlinear descriptors (embedding dimension via correlation sum, mutual information, Lyapunov exponents, permutation entropy, recurrence‑plot based quantifiers). Each metric is wrapped as a function that accepts a parameter structure, enabling systematic exploration of parameter spaces.
The third layer provides a “parameter‑sweeping” interface. Users specify ranges for key embedding parameters—embedding dimension (m), delay (τ), window length (L), etc.—and the toolkit automatically generates all combinations, dispatches the calculations to MATLAB’s parallel pool, and stores results in multidimensional cell arrays. This feature makes sensitivity analysis, model selection, and cross‑validation straightforward. The fourth layer handles visualization and reporting. Results can be rendered as heat‑maps, line plots, 3D surfaces, or parameter‑maps; a moving‑window change‑point detector highlights dynamical transitions directly on the plots. An automated report generator produces PDF/HTML documents that embed figures, tables of statistical test outcomes, and the full parameter configuration used for reproducibility.
MATS also incorporates resampling‑based hypothesis testing. Both bootstrap and surrogate (phase‑randomized) methods are available for assessing independence, linearity, and specific nonlinear relationships. Users select a test statistic (e.g., Kolmogorov–Smirnov distance, χ², Pearson correlation, mutual information) and the number of surrogates; the toolkit then computes the empirical distribution, derives p‑values, and appends the findings to the visual report.
The authors demonstrate the toolkit on two empirical datasets. First, a large heart‑rate‑interval (HRV) database containing 10 000 recordings is analyzed. By varying embedding dimension and delay, nonlinear complexity measures (correlation dimension, Lyapunov exponent) reveal a marked increase during stress‑induced segments, and bootstrap tests reject the hypothesis of independence at the 1 % level. Second, daily log‑returns of the S&P 500 index are examined. Linear autocorrelation combined with nonlinear mutual‑information features feed a multivariate regression model that successfully discriminates volatility clustering regimes. Screenshots of the graphical user interface illustrate the workflow: data import, parameter grid definition, computation progress, result heat‑maps, and statistical test tables.
Key strengths of MATS include (1) unified access to a broad spectrum of time‑series metrics, (2) automated parameter sweeping and parallel execution, (3) rich, publication‑ready visualizations, (4) seamless integration with MATLAB’s scripting environment, allowing users to add custom functions or embed MATS calls in larger pipelines. Limitations are acknowledged: the current version handles only univariate series, lacks GPU acceleration, and does not support real‑time streaming data. The authors outline future extensions such as object‑oriented redesign for easier plug‑in of new measures, a Python API for cross‑language interoperability, and cloud‑based distributed computing to tackle truly massive datasets.
In conclusion, MATS represents a significant step toward a one‑stop solution for time‑series analysis, enabling researchers and practitioners to conduct extensive measurement, hypothesis testing, and visualization tasks on large databases with minimal manual overhead, thereby accelerating discovery in data‑intensive domains.
Comments & Academic Discussion
Loading comments...
Leave a Comment